All the Portfolios – Consolidated Returns

Today’s post is an attempt to draw together all of the portfolios that we’ve looked at over the past three years into a consolidated set of investments.
Contents
Consolidated returns
Today’s post is another one of those rare articles that stems from user feedback.
Over the past three years on the this blog, we’ve looked into creating a fair number of portfolios.
- Some have been tracked fairly regularly.
- Others have suffered from neglect.
- Yet others have been abandoned or subsumed into another portfolio.
Today I’ll try to pull the story together in one place, and work out a way forward.
- We’ll also look at the returns on our consolidated portfolio – what you might call the auditable 7C returns.
All the portfolios
Here’s my list of the portfolios we’ve looked, with a comment on their current status, and any future plans for them:
- PiggyBack Portfolio
- This was originally a paper portfolio, but was converted to real cash in 2017.
- Originally to be filled with stocks recommended by other bloggers and Twitterati
- Now restricted to Main Market stocks (see SGAP below) but still going strong
- SmallCap AIM Growth Portfolio (SGAP)
- A practice (but real money) portfolio to learn about AIM before setting up an IHT portfolio
- Still going strong
- Bonkers (Momentum) Portfolio
- A real-money portfolio that only uses momentum and trend-following to select funds and stocks
- Originally split across three (and later four) accounts, but now consolidated into spread bets
- Sorely neglected over the two years of its existence, but now going strong again.
- AIM IHT Portfolio
- This takes advantage of the BPR relief to protect against IHT
- Set up in 2017 using my mother-in-law’s money
- Still going strong, but doesn’t use my money, so won’t be considered in detail today
- Sector Plays
- This is an actively managed variation of the Stockopedia NAPs portfolio
- The 2017 version was subsumed into the SGAP & Piggyback portfolios
- The 2018 version is being run (and reported on) as a separate portfolio
- HL Portfolio
- A simple fund and ETF portfolio set up for a beginner
- Still going strong, but doesn’t use my money, so won’t be considered in detail today
- ETF Portfolio
- Demo portfolio to show asset allocation and portfolio construction rules
- Not actively traded
- Now subsumed into the 7C-100
- Investment Trust (IT) Portfolio
- Passive Portfolio of actively managed funds, designed to complement the ETF portfolio
- Now subsumed into the 7C-100
- Dividend portfolio
- Paused because Dividend investing is a proxy for Value investing, and during the life of the blog to date, conditions have been unfavourable for value investing.
- Will be revived as part of the Defensive Portfolio to be built in 2018.
- Mike’s Portfolio
- This reflects my total net worth and is reviewed once a year
- The consolidated portfolio we are building today is a subset of this
2017 portfolios
The portfolios that we will try to bring together today are the three that were active at the end of 2017:
- SGAP (AIM)
- Piggyback (Main)
- Bonkers (Momentum)
Three more portfolios will be added as they come online during 2018:
- Sector Plays (already invested)
- Defensive (in progress)
- Multi-Asset Trend Following (MATS – not yet started other than as momentum spread bets within the Bonkers Portfolio).
Cash in
The first thing to look at is cash in.
- We began with £50 in the Piggyback in January 2015.
- Since then there have been ten top ups and one slight withdrawal.
Here’s a table of the transactions:
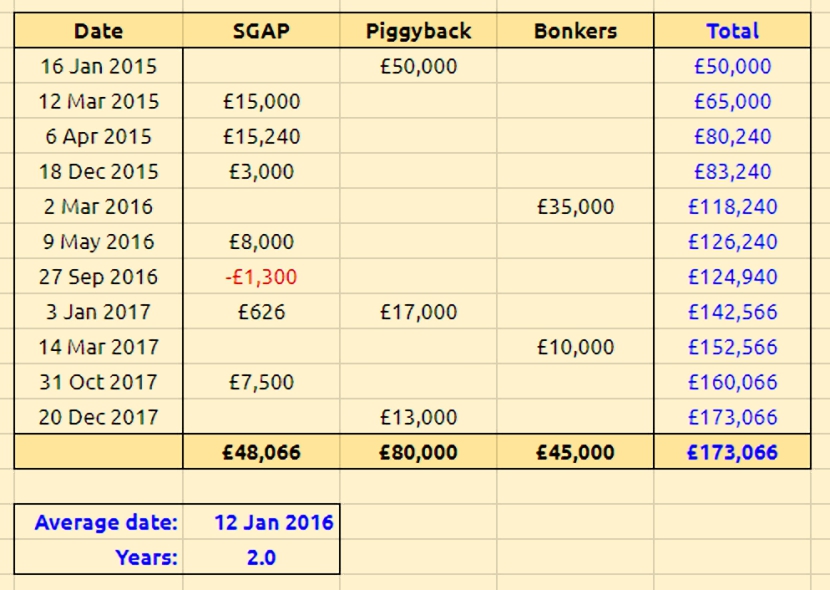
To date we’ve invested £173K.
- The money-weighted date of investment is 12th January 2016, so the consolidated portfolio is just over two years old.
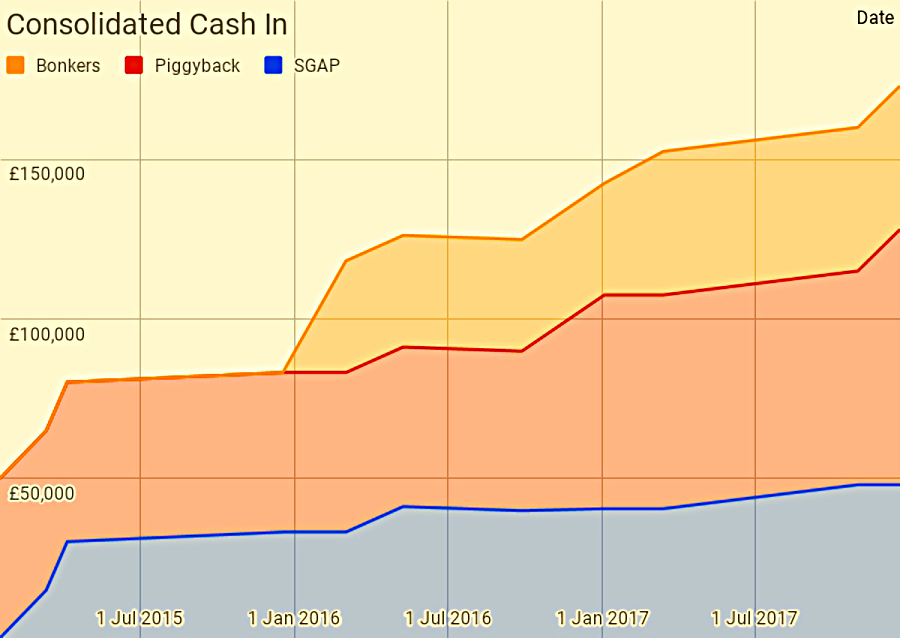
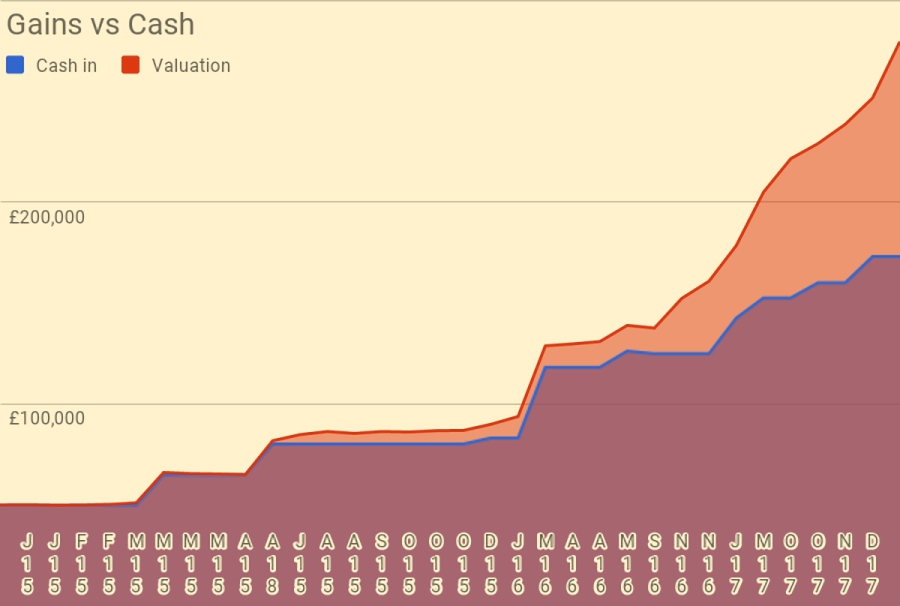
Here’s the same data in cumulative form:

And here’s a chart:
Growth
Here’s a table showing the growth of the consolidated portfolio across the many valuations we’ve carried out over the past three years:
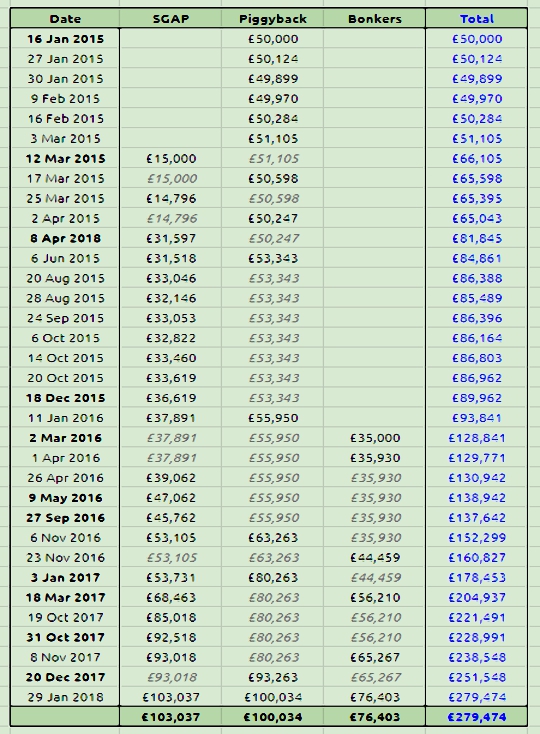
The dates in bold are those where new money was added.
- The numbers in italics are where the valuation of that portfolio was the same as the previous one (ie. that sub-portfolio wasn’t revalued).
Here’s the same data as a chart:

Returns vs Cash
Here are the valuations compared with the cash in (the raw gains):
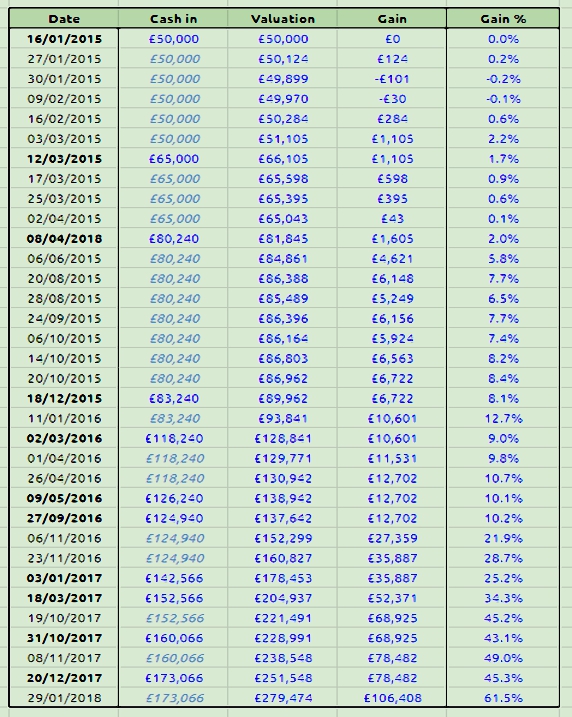
And here is that data as a chart:
Returns vs Index
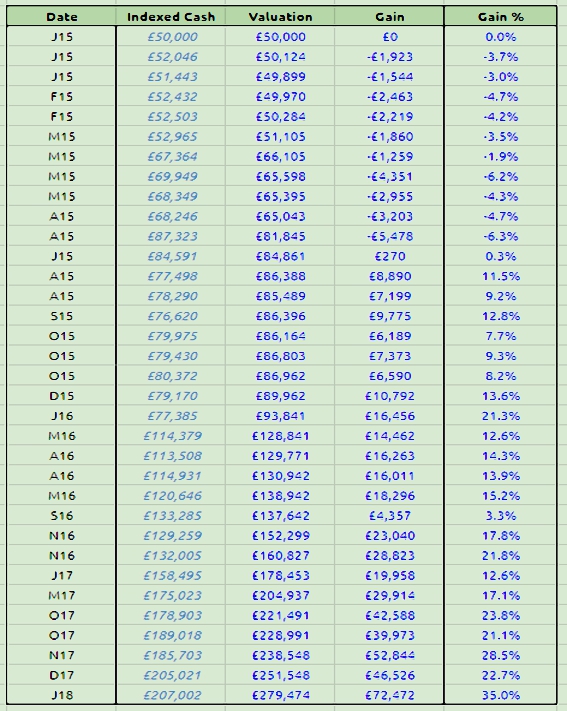
Here’s a table that shows the consolidated portfolio valuations against cash in figures that have been indexed to the gains (or losses) in the ASX since the portfolio began.
- The rightmost two columns show the gains and percentage gains for the portfolio against this indexed cash.
Here’s the same data in a chart:
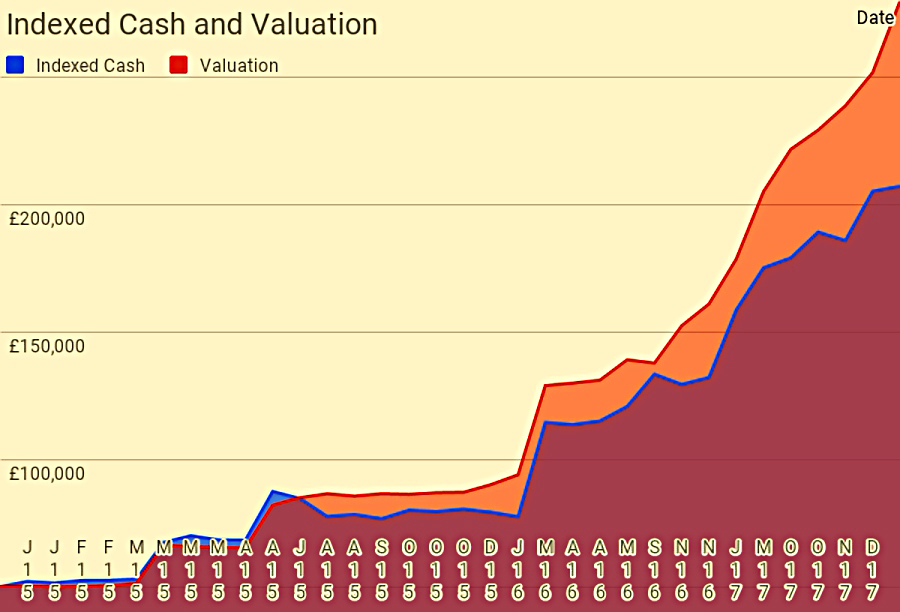
It looks fairly interesting, but in fact it’s not particularly accurate:
- Every time I add new cash, it’s effectively spread through the history of the portfolio to date.
So adding new cash (which we are likely to do for at least another year) means that the gains against the index are underestimated – until we catch up to the real position at the very end.
- What I really should do is unitise all the portfolios, but I never seem to get around to it.
Interlude
Between the drafting and the publication of this post, I worked out a better way of indexing the cash flows for comparison with the consolidated portfolio valuations.
- Unfortunately, during the ten days between the first and second versions of my chart (early February 2018), the market fell out of bed.
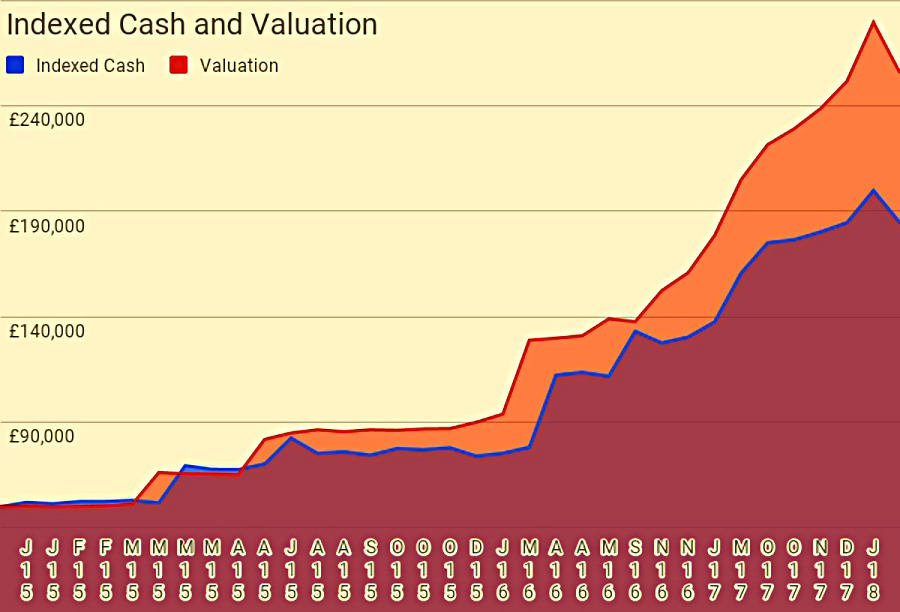
The index fell 10% in less than two weeks.
- The consolidated portfolio didn’t do as badly as that.
- Unfortunately, the new chart makes it look like it fell more than the index – that’s because Google Finance was having one of its data glitch days where certain stocks are marked down to only 1% of their true value.
Hopefully that will be fixed when I do the next update in the series.
- But, hey – at least the input cash has been indexed properly.
Money-Weighted returns
Now back to the data from the end of January.
Until I get around to unitisation, we have the money-weighted analysis.
- It could be argues that this approach is not perfect either, since the comparison index (ASX) does not go up in a straight line.
Indeed, at the moment the consolidated portfolio is weighted such that it’s starting point is January 2016.
- This is the recent low for the ASX, and so could exaggerate its returns over the life of the consolidated portfolio.
But in fact we use a weighted average starting point for the ASX, based on all the cash flow dates.
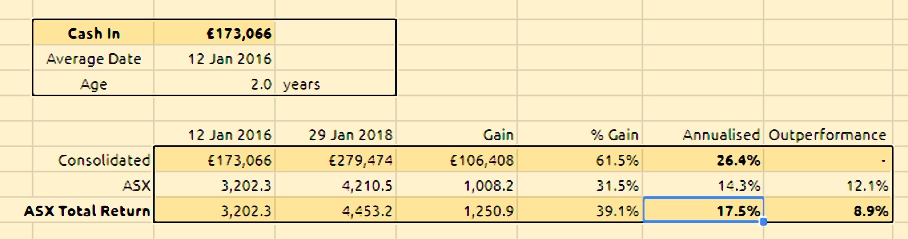
On a money weighted basis, the consolidated portfolio is just over two years old.
- The gains over that period are 61.5%, for an annualised growth rate of 26.4%
The FTSE All-Share (ASX) is up 31.5% over the same period, for an annualised return of 14.3%
- So the consolidated portfolio has beaten the ASX by 12.1% pa.
If we add in dividends, the ASX Total Return is up by 39.1%, for an annualised return of 17.5%
- The consolidated portfolio has beaten the ASX Total Return by 8.9% pa.
Of course, we don’t track dividends in any of the sub-portfolios, so perhaps the raw ASX is the better comparison.
That’s it for today.
- I’ll try to remember to provide an update on the consolidated portfolio whenever I report on one of the sub-portfolios.
- And I’ll give some thought to including it in the monthly Trades, Tips and Funds posts.
Until next time.
Mike Rawson
Mike is the owner of 7 Circles, and a private investor living in London. He has been managing his own money for 40 years, with some success.