Disclosure of investment fund costs

Today we are going to take a look at a position paper issued by the Investment Association this week on the disclosure of investment fund costs.
Costs are crucial in long-term investing, particularly in the current low-growth climate. The difference between the cheapest and most expensive funds and platforms can contribute up to a third of the final portfolio value over an investment career.
![]()
The problem historically is that costs have been both high and opaque. Both situations are improving, but it remains difficult for the private investor to easily compare the range of investing options open to them.
I believe that if investors could clearly see the charges in funds and compare them across all similar products, they would vote with their feet and move to cheaper funds, driving down costs (and profits) in the industry.
This is clearly not in the interests of the IA, so let’s see how close the turkey has come to voting for Xmas.
Contents
Objectives & performance criteria
The report lists five objectives, but I’ve condensed them to three:
- To provide a template for consistent disclosure of charges and transaction costs for investment products
- To inform the technical debate at European level (MIFID II and Key Information Documents -KIDs, which will replace the confusingly-named KIIDs)
- To develop additional information about activity levels within portfolios (portfolio turnover rate – PTR)
The paper also lists three ways in which the success of the proposals can be judged, of which I I have selected the one closest to my own position:
- ability of users to compare a range of product types and provider
What I want as a private investor is to be able to compare my investing options:
- open-ended fund (OEIC) on a SIPP/ ISA platform
- closed-end fund (investment trust) on a platform
- ETF on a platform
- the underlying shares on a platform
And I want to do this by looking at the total costs to me over a range of time periods – say 5, 10, 15, 20, and 25 years.
The proposals
The paper includes a number of principles for disclosure:
- Use of the Ongoing Charges Figure (OCF) to replace Annual Management Charge and Total Expense Ratio (TER); OCF splits out:
– contingent charges (such as performance fees)
– one-off charges (entry / exit) - Transaction costs and charges should be separated so that fees can be compared between managers
- A distinction between historic (actual) and forward (estimated) costs must be made
- A definition of explicit costs that can be expressed in pounds or percentages
- A definition of implicit costs (quarterly bid-offer spread)
- Intangible opportunity costs (market impact / best execution) must be looked at separately.
- A recommendation for PTR methodology (based on the SEC approach)
- Graphic representation of PTR and transaction costs to show consumers the performance hurdle
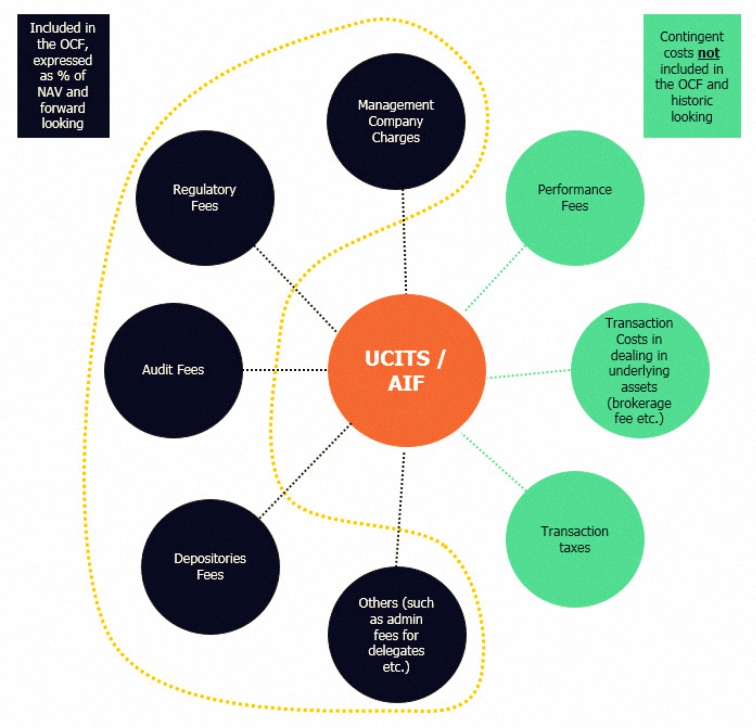
The graphic below shows what is included in the OCF:
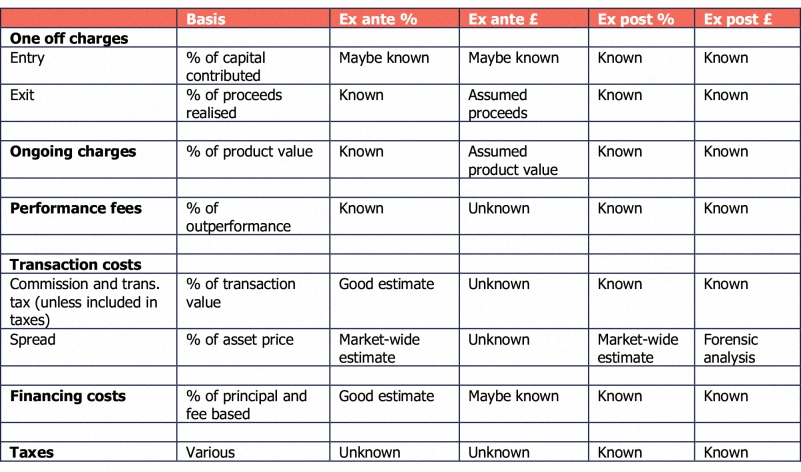
The next table shows the availability of the components:
Types of cost
Before looking at whether the report’s recommendations can help us with our goal, let’s look in more detail at the types of costs in investment:
- a fee charged by the fund manager (or by two or more managers, in the case of “funds of funds”)
- a fee charged by the ISA/SIPP platform manager ((or the broker, if you have a taxable account))
- performance fees
- brokerage commission
- bid-offer spread, which is rarely noted at the time of a transaction, and often lumped in with performance when a position is closed; spreads for bonds can be particularly difficult to determine
- transaction tax (eg. stamp duty in the UK)
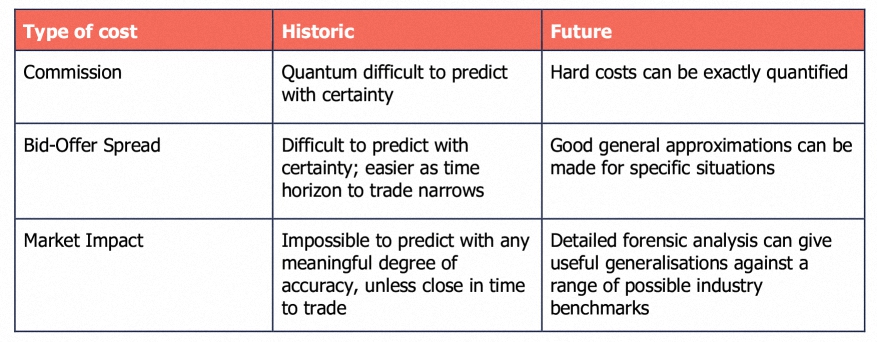
The corresponding table from the report includes only includes the last three of these costs and appears to have an error in the first line:

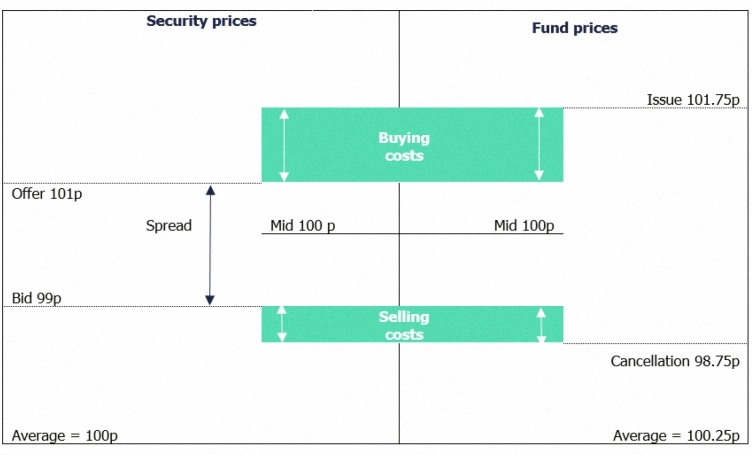
The graphic below shows how fund prices are calculated:
The explicit transaction costs are already divulged for funds:

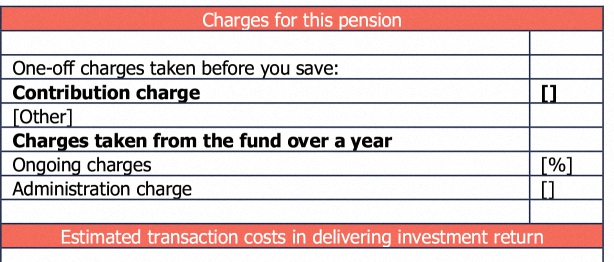
This is how the IA suggest that forward-looking charges might be disclosed:
There is also another group of hidden costs ((sometimes known as the “Plexus iceberg”, though confusingly this definition includes many of the costs we have previously discussed)) which arise from the response of the market to trading / intent to trade, and from the timing of a trade.
Quantifying these costs is not straightforward, but the IA proposes some disclosure relating to what they term “best execution”.
Transaction charges
Here is the proposed format for the presentation of charges in the current Key Investor Information Document (KIID):
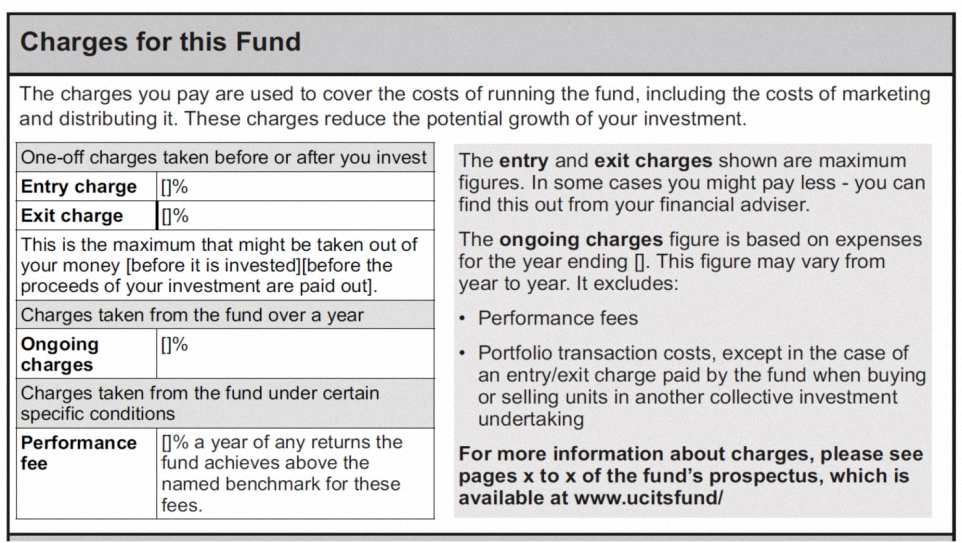
You can see that at this stage transaction costs (bid-offer spread, stamp duty, broker commission) are excluded, but the IA says they will be added during the transition from KIIDs to KIDs.
The investment manager will alway be keen to separate these “unavoidable” costs from the amount that he is trousering, but from the investor’s perspective it’s all lost money. And in any case the transaction charges are driven by the actions of the fund manager – how often he buys and sells, and which instruments he used to gain market exposure.
A couple of points worth noting:
- transaction costs will vary across asset types so splitting them out could be useful in this context
- transaction charges can be difficult to predict on a forward-looking basis and some kind of best estimate / historic average will have to be used here ((the IA believes that historic data is not a reliable indicator of future costs))
- in the historical context, transaction costs can be presented against the returns they have produced
To sum up, the inclusion of transaction charges seems essential to me and the new format is not useful without it. If they are separated out they should also be presented in a combined format (single number) so that investors can easily choose between offerings.
Portfolio Turnover
This is also known as churn – the amount of the underlying investment that is bought and sold each year. The IA seems to believe that this is a difficult measure for investors to understand, though I can’t see why myself.
The idea is to identify the discretionary costs – the amount added by the fund manager’s decisions to trade. While the extent to which trades are truly discretionary will vary between assets, sectors and pricing mechanisms, comparing PTRs of funds within a category will be useful.
There are a number of decisions to be made in calculating PTR, and the process does need to be standardised:
- In Europe, the UCITs calculation of PTR excludes trading due to fund inflows and outflows (effectively creation of new units).
- In the US, the SEC calculation simply uses the lesser of purchases or sales to achieve a similar objective.
- Whether the inflows and outflows should be excluded depends on whether the pricing mechanism includes a protection against dilution (if so, they can be excluded) – the IA therefore recommends two methods of calculating PTR
- There are also variations based on the period of analysis (daily, monthly, annual).
- Trades that don’t impact transaction costs (overnight cash sweeping, in specie transfers of stock) need to be excluded.
- The net flows may help or hinder the manager to achieve his trading goals. ((I would argue that using the flows efficiently is a small part of the job of a fund manager))
- The effects of switching from legacy units to new RDR units must be excluded.
- Derivatives could be included or excluded.
The IA compared three methodologies:
- UCITs / 2
- UCITs /2 without adjustments for flows
- modified SEC
All three methods tell a similar story:

The IA believes that the PTR number suffers from spurious precision and would prefer to use a visual representation:
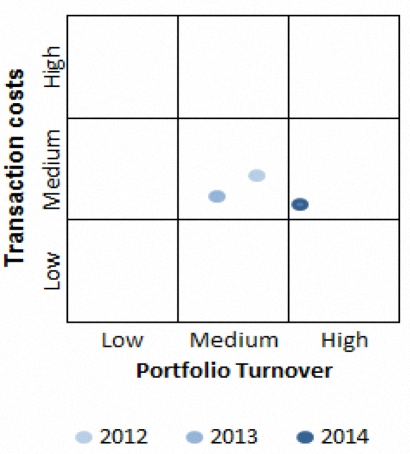
As regular readers will know, I’m a big fan of using pictures to tell stories, but the problem here is how (and by whom) the breakdown of transaction costs and PTR into low, medium and high bands take place.
As private investors we want to compare within a limited universe of investment options on our radar, and we will need absolute numbers for this.
Conclusions and recommendations
- The IA paper is only concerned with closed-end funds (OIECs) and ignores the other three ways that we might invest (investment trust, ETF, direct share purchase)
- The paper ignores the platforms and products (SIPPs and ISAs) that we use to access funds
- The paper takes 61 pages to say not very much
- The proposals are an improvement on what we have now, but are far from what is needed
- It’s not clear whether a single percentage number for the sum of all costs will be included, but this is required by the private investor
- The separation of actual historic and estimated future costs is not a problem in itself, but if they are materially different a narrative explanation will be needed
- The inclusion of transaction costs is very important, and should be accelerated
- There are issues around the best definition of PTR, but they are not insurmountable
- PTR and transaction costs need to be provided as numbers, and not only via comparative graphics
This is an industry association report making slow and somewhat unwilling progress on an important issue, defending the interests of its members at each step.
What is needed instead is a government / FCA sponsored location where private investors can compare the long-term cost impact of the practical choices they are making. This needs to include all types of product and platforms.
At the moment we have the True and Fair Calculator, but this requires you to enter your own fund data. We need fund managers and platforms to be required to supply live cost data to a central site.
Perhaps if the Pension Wise website is a success (something that is by no means guaranteed) the official cost calculator and fund database could be added there.
Mike Rawson
Mike is the owner of 7 Circles, and a private investor living in London. He has been managing his own money for 40 years, with some success.