Fundamental Analysis – Excess Returns 5

Today’s post is number sixteen in our series on the lessons to be learned from guru investors. It’s about Fundamental Analysis.
Contents
Fundamental Analysis

So far we’ve looked at the various types of successful investor, and the strategies they used to succeed. We also looked at where you can find bargain stocks and at which stocks to avoid and indeed to sell short.
Today we’ll look at fundamental analysis.
- This a huge topic, and one that Frederik Vanhaverbeke devotes more than 25,000 words to.
- In a single blog post – or more likely two – we can’t hope to provide more than an overview.
- As ever, you are advised to read the book first hand if you want further detail.
At the risk of putting you off before we begin, here’s Frederik’s overview diagram of the factors that go into making a fundamental assessment of a firm:
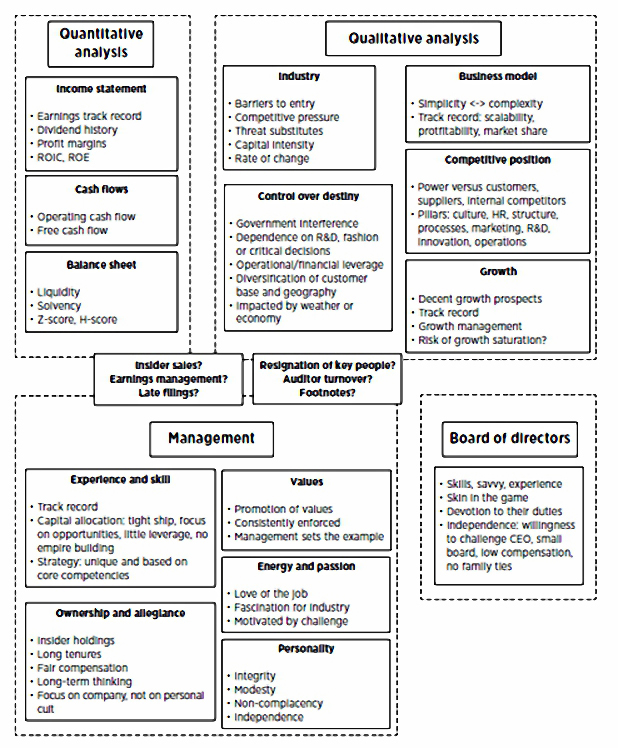
Frederik splits fundamental analysis into three sections:
- quantitative analysis
- qualitative analysis, and
- management analysis.
Many investors (myself included) prefer to focus on the quantitative aspects of analysis, but Frederik has found that the top investors treat all three with the same respect.
- We’ll look at each of the three in turn, but first a word about success.
Fundamental analysis is important to many investors (particularly to long-term value and growth investors) because in the long run, the share price of a company is based on the underlying success of the firm itself.
- Working out what a company is worth is something we will look at in more detail a bit further down the road.
- At this stage, what we are really trying to do is to work out whether a company will be successful.
The income statement
The income statement is about profits, dividends and return on capital.
Here are the main things to look for:
- Track record of earnings (profits), ideally for 5 to 10 years
- Record of dividend payments – steady increases for 10 to 20 years are the ideal here
- High profit margins (gross, operating, net) compared to their industry.
- this is indicative of competitive advantage (strategy, operations or products) – the famous “moat” that Buffett looks for
- high margins also protect a firm during a downturn
- High return on invested capital, in both absolute terms and relative to their competitors
- this is another indicator of competitive advantage, and probably of good management (superior capital allocation skills)
- this is a hard figure to manipulate, compared to return on equity, which can be increased through leverage
- Improving profitability – we’d like to think that profits will increase in the future
ROIC = Earnings Before Interest & Taxes / (debt + equity + deferred taxes)
return on assets (ROA) = Earnings Before Interest & Taxes / total assets
See here for more detail.
Stick to buying good companies (ones that have a high return on capital) and to buying those companies only at bargain prices (at prices that give you a high earnings yield). – Joel Greenblatt
The balance sheet
The balance sheet is all about liquidity and solvency.
Liquidity is the company’s ability to meet its short-term obligations. Classic metrics include:
- current ratio
- quick ratio
- net working capital
- interest cover
Companies with too much short-term debt (which needs to be rolled over frequently) or too much floating-rate debt (which can lead to fluctuations in interest payments) should be avoided.
Solvency is effectively the long-term version of liquidity.
The key indicator is leverage, the debt to equity ratio, which should ideally be less than 50%.
- Buffett points out that high leverage is not necessary, as great businesses throw off sufficient cash to fund their projects without it
- High debt equals high risk – the large fixed costs of debt repayment cause problems in a downturn
- High debt pushes up the cost of further funding, which is more likely to be needed during adverse conditions
- High debt reduces the options available to management, who must prioritise servicing the debt, and listen to what important creditors want
As always, compare the company’s numbers to those of the industry.
See here for more detail.
The cash flow statement
The key numbers here are the operating and free cash flows:
- they should be improving in absolute terms and compared with competitors
- they should match the reported earnings – free cash flow much lower than earnings is a sign of accounting manipulation
See here for more detail.
Red flags
Other things to look out include:
- Earnings manipulation – the signs include:
- auditors that have other relationships with the firm, or that have recently changed
- numbers that look “too good to be true”
- discrepancies between the income statement and the balance sheet (eg. inventories vs cost of sales, assets vs depreciation)
- overvalued assets
- improper capitalisation of expenses
- track record of management
- complicated and opaque accounting
- Unfunded pension liabilities
- Risk of distress
- the Altman Z-score (minimum score 1) or H-score (minimum score 25) can be used here
- the price of the company’s bonds and its credit default swap spreads are market indicators of the company’s financial health
Qualitative analysis
Qualitative analysis has long been used by top investors and Frederick argues that its importance has increased as quantitative data has become more accessible to the average investor.
- It’s also the case that far fewer investors have the knowledge and skills to carry out qualitative analysis, so for those that can it represents a competitive advantage.
Industry analysis
The success of a company depends a lot on the industry in which it operates.
Key factors in an attractive industry include:
- Barriers to entry – the famous competitive “moat”
- Barriers deter outsiders from entering an industry
- Industries with huge barriers to entry are usually more stable and more profitable – lower competition usually means higher profits
- The key barriers are:
- Economies of scale, which force new entrants to start big
- High capital requirements, particularly in risky R&D (this protects for example, big pharma companies
- Need for product differentiation, which means heavy advertising investment in order to create a new and successful brand
- Distribution channels at capacity – launching a supermarket product is difficult for this reason
- Access to raw materials, or patents, or key locations
- Government regulation (eg. of utilities and telecoms)
- Competition is inversely correlated with barriers to entry, but there are other factors:
- Opportunity for differentiation
- commodities imply price competition, but differentiated products can be protected in other ways
- Popularity
- it can be difficult to make money in “hot” industries that are attracting a lot of investment (ie. competition)
- boring, unpopular, disagreeable, no-growth industries are usually safer
- Size of major players
- if there are lots of equally sized market leaders, competition will be intense
- Exit barriers – expensive specialised assets, high fixed costs, strategic inter-relationships
- these can make unprofitable players remain in the industry, leading to overcapacity and price competition
- Opportunity for differentiation
- Threat of substitutes:
- customers might replace the industry’s offering with something that performs a similar function (the internet vs, newspapers, planes vs trains etc)
- Capital requirements:
- many top investors prefer industries that make decent profits with few tangible assets; these include:
- computer software (Microsoft)
- pharmaceuticals
- branded consumer goods (Coke)
- service industries (consultancy etc.)
- Capital-light businesses find it easier to expand, and suffer less under high inflation.
- many top investors prefer industries that make decent profits with few tangible assets; these include:
- Rate of change:
- many top investors avoid industries with rapid change and unpredictable product life cycles (eg.technology, biotech)
- Lots of good management decisions are needed here to stay on top
- Stable industries like the funeral business are in contrast highly predictable
Business models
A company’s business model describes how the company will make money and beat the competition.
Things to avoid include:
- Complex business models:
- Peter Lynch famously said that he would only invest in a business that could be explained with a crayon in less than three minutes
- Companies without repeat business:
- products that only have to be bought once are not much use to the investor
- you need to have repeat purchases and / or service and maintenance revenue
- big-ticket items like elevators and gas turbines can generate a lot of support work
- razors, electric toothbrushes and ink-jet printers are sold at or below cost with profits coming from consumables
- Models that have not proven successful over at least one business cycle; success in this context means:
- profits
- growing market share with higher cash flows
- scalability (success during expansion – eg. for restaurant chains, success in different geographical locations rather than a single city)
Competitive position
Frederik uses Michael Porter’s Five Forces to analyse competitive strength.
- Barriers to entry, competition and substitutes were covered under industry analysis above.
Here we will look at competitive power with regard to customers, suppliers and rivals.
Customers
The company’s power versus its customers stems from its product:
- Do customers need or want the product, regardless of economic conditions?
- soap and medicine (as well as fags, booze and betting) will produce revenues under all circumstances
- strong brands like Coke also fall into this category
- Price versus quality
- the cheapest product at a given quality will appeal to the most customers
- Differentiation
- I struggle to work out the difference (to differentiate, in fact) between product differentiation and branding
- for Frederik (and presumably Porter), Starbucks has a differentiated product, but in Europe at least, Starbucks offers inferior coffee to what was there before, and must be successful because of branding
- whatever we call it, differentiation removes the need to compete on price
- commodity businesses (raw materials, but also industries like the airlines) are much less attractive
- Service: “excellent service can add another dimension to a product’s differentiation”
- again I’m tempted to lump this in with branding, unless the “product” is a service
- I might look for great service in a private hospital or high-end restaurant or hotel, or in a car repair shop, but where does service come into buying a light bulb?
- Ease of switching: investors want customers to be locked into products
- Microsoft software is Frederik’s example, but the same could be said about Apple or any other closed system
- Number of customers: when revenues come from many customers, the company has more power.
- Dependence on a few major customers is a weaker and also more risky position.
Suppliers
Here we will include the workforce as an internal supplier of labour.
The supplier relationships mirror the customer relationships, and similar forces apply to each.
- When suppliers can raise their prices, the company has a weak position.
Here are some of the factors that determine a supplier’s position:
- Competition faced by suppliers:
- if there are lots of other suppliers of the same product, or lots of substitute products, the supplier’s position is weak.
- low skilled labour has a weak position, especially when unemployment is high
- Number of customers:
- a supplier will find it hard to raise prices to a customer that accounts for a large share of its revenues
- retail giants usually have a lot of power over their suppliers, as they are few in number and large relative to the suppliers
- Ease of switching the input product: if is easy to switch inputs, suppliers can be made to compete on price
- with labour, entrenched unions make it difficult to switch inputs
- Importance of the input: the supplier of a critical component has more power than that of a peripheral one
Rivals
Market leaders – companies with dominant market shares – have many advantages.
- they are usually the most profitable and lower cost producers, with scale advantages
- they have a stronger bond to customers (they are “the best”), which means they can charge higher prices
- their market position is hard to challenge unless they make a stupid mistake
Duopolies (where only two companies compete) are also attractive, with government regulation often weaker than in a monopoly.
Control
Closely related to a company’s competitive position is its ability to maintain its position – whether or not it has control over its destiny.
There are a number of factors that restrict this ability:
- Regulatory risk – utilities, banking and resources companies are less attractive; resources companies operating developing countries also face the risk of expropriation
- Reliance on government support (subsidies and tax breaks) – renewable energy is a good recent example here
- Reliance on R&D, which is uncertain (eg. biotech)
- Fashion: having to always get the new fashion right creates risk
- “Bet-the-farm” companies like aircraft manufacturers – Buffett avoids these firms
- Too much leverage (financial or operational – high fixed costs and break-even point), which means a loss of control in unfavourable conditions
- Geographical dependence – another form of leverage
- Weather dependence – farms and food producers
- Macro factors: cyclical companies (sensitivity to either the business cycle or to capacity cycles in their industry), companies dependent on commodity prices, or interest or FX rates, or low inflation (long-term contracts at fixed prices)
Growth
Companies whose sales are growing make the best investments.
- Even when cheap, companies with declining sales are often “value traps”.
There are only two ways for a company’s stock price to increase:
- increasing earnings
- multiple expansion (increase in PE ratio)
So good investors look for growth, in sales, profits and cash flows.
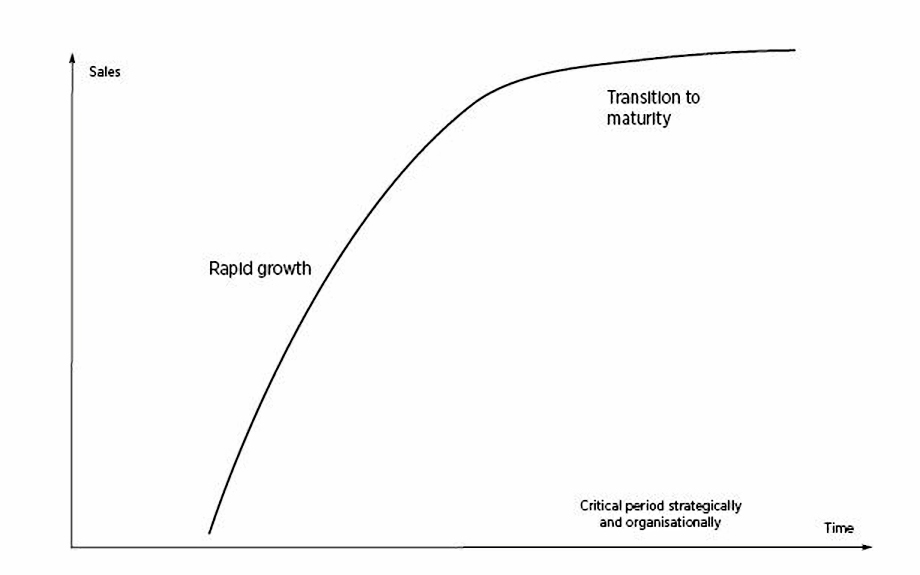
Growth stages
Lots of novice investors think that the best growth prospects are in new technologies and pioneering companies.
- But these firms and industries often fail (see the dot-com boom of 1999-2000)
- And there is no link between increasing sales and increasing profits (see car and plane companies).
In fact, the rapid growth phase can often lead to poor profits through intense competition.
- There may be some big winners, but it can be hard to predict in advance which company will triumph.
Historic growth
To understand future growth prospects, look at the past. Things to look for are:
- The average historical growth rate:
- unless there is a clear catalyst for higher growth in the future (or a reason for growth to level off), this is the best guide
- look for consistent industry-beating growth in sales and profits, ideally through a business downturn
- moderate growth (say 7% pa) is fine
- with high growth (> 20% pa) companies, make sure you are not over-paying for growth that cannot be sustained
- Quality of growth: sales growth should be driven by more units or higher prices, not by acquisitions
- Revenue versus profit:
- sales without profits are generally no use, and often a sign of poor management
- see Amazon for a possible exception to this rule
Growth management
The road from minnow to whale is paved with pitfalls, and investors need to look out for the signs that growth is at risk:
- Founders clinging on to power:
- the best people to start a firm (entrepreneurs) may not be the best people to make it grow
- founders often refuse to delegate and surround themselves with yes men
- Not introducing processes and systems early enough:
- founders often hate bureaucracy and believe that they can continue to be successful without process
- lack of process can lead to constant fire-fighting, inertia, and dependence on key personnel
- signs include growth in payables and inventories, production bottlenecks, space constraints and sudden, unexplained loss of profitability
- late and opaque accounts are also an indicator
- HR failings:
- poor organisational structure (too many layers, unclear responsibilities)
- lack of rewards for good performers
Growth projections
Investors should not simply extrapolate historic returns though many do.
- If you can confidently predict higher or lower growth in the future, there is a possibility that the stock may be currently mispriced.
Here are some other heuristics to factor into your prediction:
- Returns tend to revert to the mean over about seven years
- Analyst expectations and broker forecasts:
- here the trend can be as useful as the current estimate
- any conflict between analyst views and your own can lead to an exploitable mispricing
- it’s also worth avoiding firms where analysts predict lower profits since they have a positive bias in general
- Growth saturation:
- every business matures eventually
- a high PE means a company is ripe for a fall when growth slows
- weaknesses in the company (poor strategy, overcapacity, increasingly sophisticated and discerning customers) will be exposed when the high growth phase ends
- ambitious, talented staff may lose motivation and transfer to a faster-growing rival
Growth saturation can be anticipated by looking for any signs of levelling off, such as “pipeline fill”, where the distribution channel is full and sales fall to the rate of consumer consumption.
- Talk of international expansion (especially to the US, or to developing countries) or brand extension into unrelated areas are also signs of desperation for growth.
More red flags
There are a few miscellaneous red flags that could put you off investing in a company:
- Insider sales at large scale by multiple people
- Key resignations, especially for “personal reasons”
- Change of auditor – often a sign that the financial statements are being manipulated
- Late filing of accounts
Conclusions
That’s probably about enough for today.
- Next time we’ll look at the role of company culture, internal systems and management in establishing a company’s competitive position.
Here’s a quick summary of what we’ve learned today:
- There are three parts to fundamental analysis:
- quantitative analysis
- qualitative analysis, and
- management analysis.
- Quantitative analysis is the ratio analysis of financial statements that we’ve come across before:
- income statement analysis looks at profit, dividends and return on capital
- the balance sheet tells us about liquidity and solvency (leverage)
- the cash flow statement looks at operating and free cash flows, which should match reported earnings
- always look for improving trends and favourable industry comparisons
- watch out for accounting manipulations
- Qualitative analysis is used by fewer investors, and this can be a source of competitive advantage
- The main factors in qualitative analysis are industry structure, business model and competitive forces
- A favourable industry has the following characteristics:
- barriers to entry
- opportunities for product differentiation (not a commodity industry)
- stability and low rate of change (not a “hot” industry, not technology)
- no barriers to exit, avoiding overcapacity and price competition
- no substitute products
- low capital requirements
- A favourable business model will:
- not be complicated
- involve lots of repeat business
- have been proven over at least one business cycle
- Competitive forces act between a firm and its customers, suppliers and rivals
- Customers:
- do they need the product under all economic conditions (defensive products)?
- can they switch easily to a competing product, or are they locked in?
- is the company the cheapest provider at a given quality level?
- does the company have a strong brand?
- does the company provide excellent service?
- does the company have many customers, or is it reliant on just a few?
- Suppliers (including labour):
- when suppliers can raise their prices, the company has a weak position
- when there are lots of suppliers or substitute inputs, the supplier’s position is weak
- if the company is a large part of the supplier’s business, then the supplier’s position is weak
- if the input component is critical, the supplier has more power
- low-skilled labour has a weak position, especially when unemployment is high
- entrenched unions make it difficult to switch labour inputs
- Rivals:
- market leaders usually make the best investments
- duopolies are okay
- avoid industries with lots of equally sized players who will compete against each other
- A strong competitive position is supported by the ability of the company to maintain that position – to control its destiny
- Growing companies make the best investments
- early stage growth is risky
- historic growth can predict future growth
- growth should be driven by more units or higher prices
- growth mean reverts and all companies reach saturation eventually
Until next time.
Mike Rawson
Mike is the owner of 7 Circles, and a private investor living in London. He has been managing his own money for 40 years, with some success.