Keeping up – live portfolio tracking spreadsheet

Today we’re going to look at what we need from a portfolio tracking spreadsheet, and see what resources are available to help us build one.
Contents
Why a live tracking spreadsheet?
Up to this point, we have been tracking our portfolios using online tools, provided either by brokers or by information providers like Google Finance.
These – particularly tools like Google Finance – have several useful features:
- live / near-live prices, so no re-typing ((I’m not a day trader, so prices that are 15-20 minutes out of date are live enough for me))
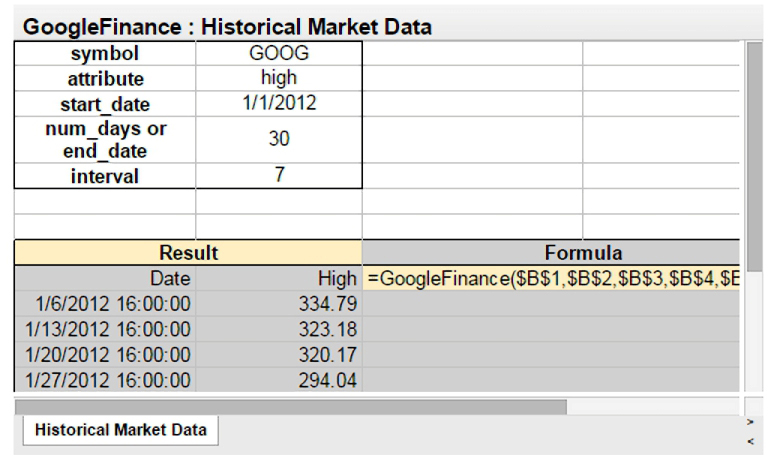
- technical analysis tools
- price history, so performance tracking
I am generally of the opinion that checking the value of a portfolio should be done only intermittently, according to a regular schedule. ((I would recommend annually, though quarterly is fine; for the purposes of this blog our portfolios each average a performance review perhaps once every six to eight weeks))
The one exception to this is an actively traded portfolio.
Active portfolios
We maintain a number of portfolios on this website, and they can be readily divided into three groups:
- primarily “buy and hold”
- mechanical selections with regular reviews
- actively traded portfolios, using fundamentals and technicals (price action)
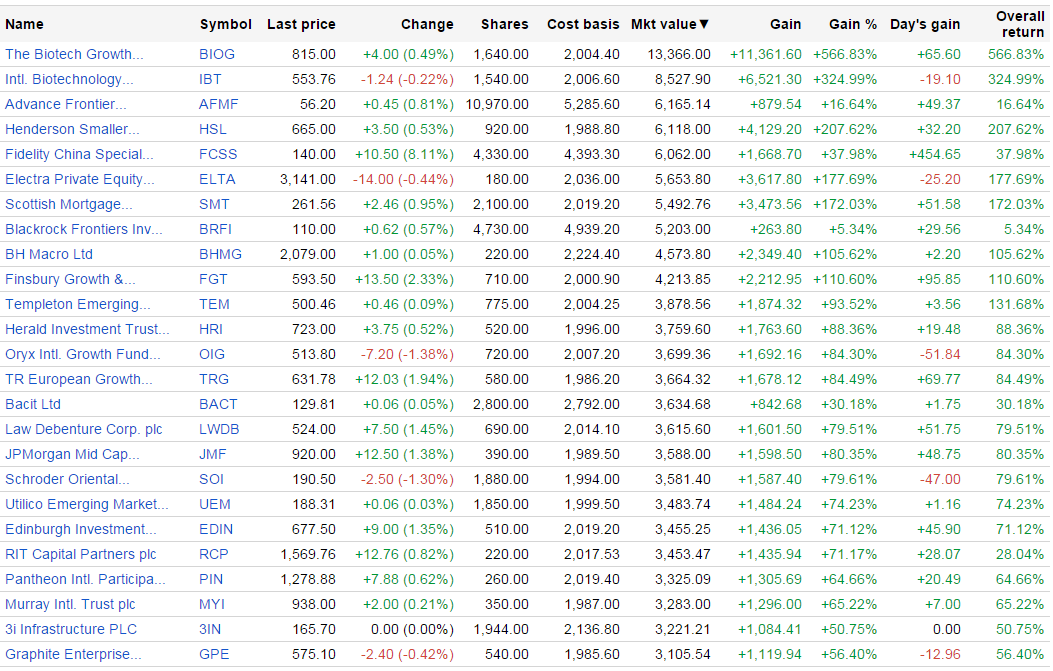
The portfolio tracking spreadsheet we are designing today will obviously be of most use with the Piggyback and SmallCap Growth portfolios.
What do we need?
This partly depends on whether we see the new tool as complementary to, or a replacement for, our existing portfolio tracking solution (usually Google Finance).
If we want a replacement, then we need what the existing tool provides:
- live prices – no re-typing
- technical analysis tools
- price history for performance tracking
If we want something complementary – a dashboard – then the priorities are, order:
- free to use
- live prices
- conditional formatting – flashing (if possible) coloured lights to tell us quickly what’s going on
- available across a variety of platforms (desktop, laptop, tablet, smart phone) and operating systems (Win, OS X, android, IOS)
- able to be published, and ideally embedded into this website
- ideally transaction based (combines transactions in the same stock)
- account for / cope with dividends and splits
Google Sheets
An hour’s Googling around leads me to believe that there is only one free tool available for this job – Google Drive. Or is it Google Docs, or Google Sheets, or Google Finance?
The masters of the internet don’t make it simple to understand what’s going on with their G-everything naming convention, so I’ll try to explain.
When you create a Google account – usually in order to use Gmail – you are given a Google Drive. This is free disk space in the cloud. The default is 15 Gb, though somehow I’ve bumped mine up to 25 Gb.
Within Google Drive, you can store Google Docs, amongst other things. Google Docs is the Mountain View version of Microsoft Office. It includes Google Docs (confusingly), Google Sheets and Google Slides.
Google Sheets is the one we want to focus on. This includes a single function called GOOGLEFINANCE(), which acts as a window onto the data within the Google Finance product.
The Googlefinance() function
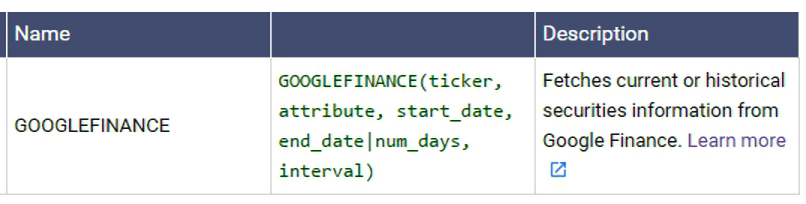
The help page for this function is here, but the most important bits are reproduced below.

It looks complicated at first sight, so I’ll walk through some of the highlights.

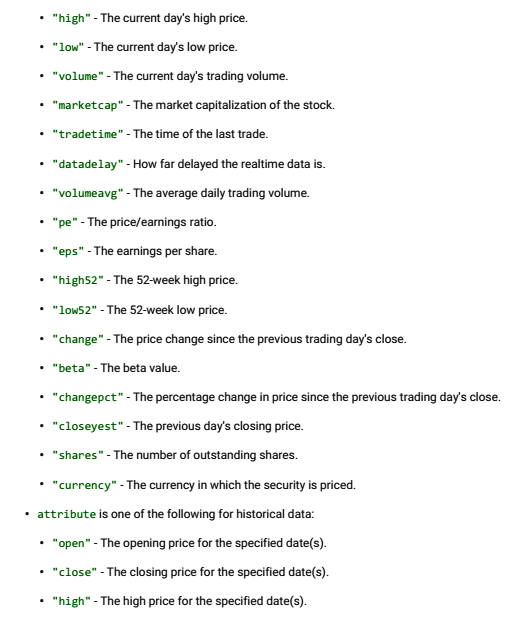
You can retrieve information about today’s price:
- price = current market price of the stock (delayed by up to 20 minutes)
- datadelay = the actual delay in the data (often 0)
- priceopen = the opening price today
- high / low = the highest / lowest price today
- volume = number of shares traded today
- marketcap (needs no explanation)
- tradetime = the last time the stock traded
- pe = the current Price to Earnings ratio
- change = change in price since yesterday’s close
- changepct = percentage change in price since yesterday’s close
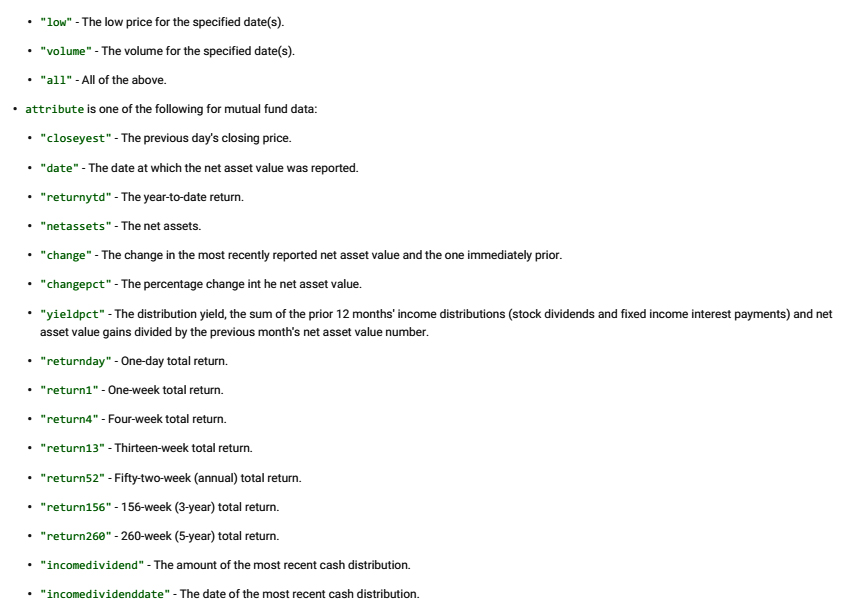
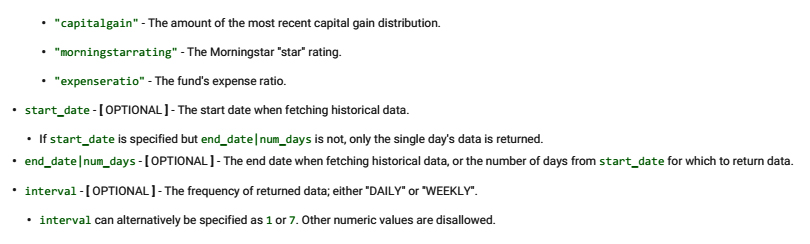
You can also retrieve historical data:
- price by date, as a series, as shown in the example above
- open, close, high, low, volume
- closeyes = yesterday’s closing price
- high52 = the 52 week high
- low52 = the 52 week low
- volumeavg = the average daily volume (over the past year?)
- beta = the beta of the stock against the market
There isn’t much in the way of fundamental data. All I could find was eps – the earnings per share.
I will investigate the possibility of using fundamental data from Yahoo.
UK Examples for us to build on
In keeping with the general spirit of this blog, I’ve had a quick look around the internet to see if there are any good examples of portfolio-tracking Google Sheets that we can build on.
And again as usual, there aren’t many that are UK focused. The only one I’ve come across is from GrinderTrader. ((Jamie Streeter at Compound Income also uses a Google Drive spreadsheet for his income stock scores, but for a slightly different purpose))
Ian is a Scottish offshore oil and gas worker and private investor who is active on Twitter and Stockopedia. His spreadsheet is here. ((Interestingly, Ian has embedded the live sheet into his blog, so that must be possible.))
International examples

- Internationally, the one I was most familar with came from Jae Jun over at Old School Value.
- Jae is now recommending his US version of the Investment Moats spreadsheet by Kyith Ng, an investor and blogger from Singapore.
- There is also a thread on Reddit that looks interesting.
Tutorials
I also came across a few instruction pages for those who want to get the hang of putting financial data into Google Docs:
- Finance Train has a short tutorial on using Google Finance and Yahoo Finance data within a Google Sheet
- Investing Sidekick also has a tutorial
- Drive Bunny has not one but two tutorials
We’ll leave it there for today. Next week I’ll look at the four example sheets in some detail, and put together my own version.
Until next time.
This article is part of a series on a Portfolio Tracking Spreadsheet. The rest of the articles can be found on the home page for the SmallCap AIM portfolio, which was used to test the spreadsheet.
Mike Rawson
Mike is the owner of 7 Circles, and a private investor living in London.
He has been managing his own money for 40 years, with some success.


Thanks for the info Mike. I’ve taken a slightly different approach with my portfolio-tracking spreadsheet by using MS Excel and some Visual Basic coding. You can find the “portfolio analysis spreadsheet” on this page:
http://www.ukvalueinvestor.com/free-resources/
Keep up the good work,
John
Thanks John – that looks like a very useful page of free stuff.
Thanks for these. I currently use the one from ‘No More Waffles’ :
http://www.nomorewaffles.com/2014/11/using-google-spreadsheets-to-track-your-dividend-portfolio-updated-template/
Thanks Weenie – I’ll look at that one in next weeek’s post, too.
Thanks for highlighting my Google Spreadsheet. It is meant to show quite up to date prices automatically, keep track based on buy, sell, dividend, split and bonus transactions, and works for a lot of major markets.
Hope you all like it.