Past Performance: Hope over Experience – Mark Finn

This article is part of our ‘Guru’ series – investor profiles of those who have succeeded in the markets, with takeaways for the private investor in the UK.
You can find the rest of the series here.
Contents
Mark Finn

Mark Finn is chairman of Vantage Consulting Group.
- He has worked with US state pension and investment funds, and also works with high-net-worth investors.
- He is a professor at the College of William & Mary
Graduate Business School.

Mark appears in John Mauldin’s book Just One Thing.
- His chapter is called The Triumph of Hope over Long-Run Experience: Using Past Returns to Predict Future Performance of a Money Manager.
Quite a mouthful, but potentially a useful subject, as working out how to interpret past performance is something that lots of investors find difficult.
Past performance
Second marriage is the triumph of hope over experience. – Samuel Johnson
The path of least resistance and least trouble is a mental rut already made. – John Dewey
Hope is a good companion but a poor guide. – Mark Finn
Past performance is not a guide to future performance. – UK asset managers’ disclaimer
Despite the quotes above, most people invest with the asset manager with the best track record.
Some do this blindly, and some carry out an analysis to understand how the past out- (or under-) performance has been achieved.
- But even in the latter case, the analysis only explains the past, and is still not necessarily predictive.
Signal to noise
Mark compares the historical data problem to the signal to noise ratio in engineering.
- The idea is that some of the historical return was caused by the manager’s actions, and some was not (was random).
- With stock returns, the amount of noise is high, and the signal to noise ratio is low.
There are three sources of noise in the returns of a stock:
- The market
- The sector or industry
- The stock itself
What an investor “knows” about the future is small compared to what he can’t know. – Mark Finn
Worse than that, what one investor knows about the future is likely known by other investors, and so already discounted by the market.
The future variability in asset returns relates to information and events that are not correctly anticipated by investors.
Traditionally investors compared fund managers with a benchmark (often the FTSE- All Share here in the UK).
- This doesn’t really address the noise problem at all, as it’s based on a false assumption that all portfolios are equally diversified and risky.
The next step was to separate funds into different sectors, to match their objectives.
- The assumption here – again false – is that managers would take similar routes towards these objectives.
Beta
The next stage was the use of beta – the sensitivity of a fund to its benchmark.
- When portfolios are made up from 50 or more stocks across different sectors, stock-specific risk drops from 50% (at one stock) to 4%.
- So what is left is market risk (systematic risk), and beta attempts to measure this.
But again, the idea is that all managers are using similar portfolios and in reality they aren’t.
Mark puts a lot of performance variation down to the use of factors – what many analysts these days call the “style” of a fund.
Factor dimensions include:
- growth vs value
- large-cap vs small
- high-tech vs cyclical
So if a more refined benchmark – appropriate to the manager’s style – is used, the comparison will be a better measure of his skill.
By comparing apples to apples you reduce a significant amount of noise. – Mark Finn
Mark uses the returns in the table below to illustrate:
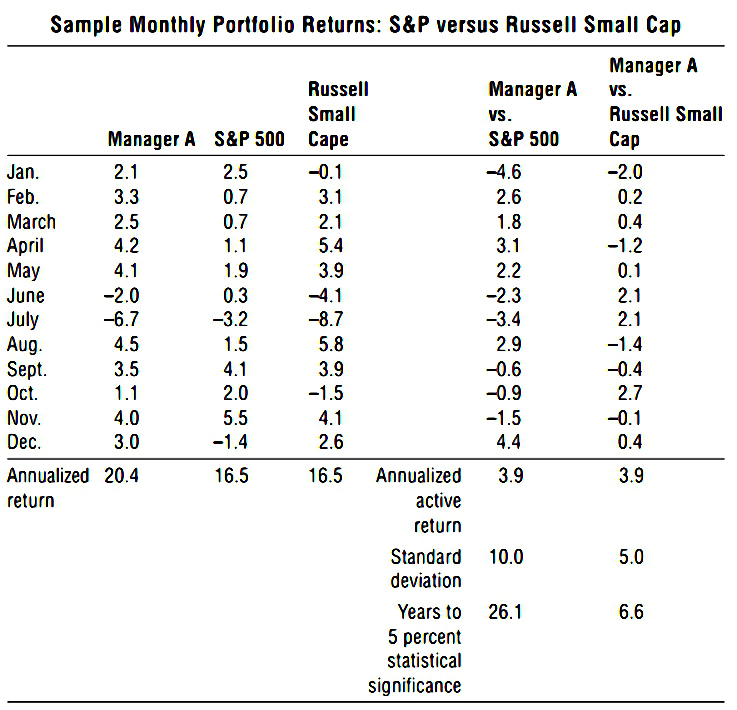
This compares a manager’s returns to two benchmarks, the S&P 500 and the Russell Small Cap Index.
- The annualized active return relative to both benchmarks is 3.9%, but the manager’s portfolio tracks much more closely to the Russell Small Cap Index (standard deviation is 5%, compared to 10% relative to the S&P 500).
This is expected because it’s a small-cap fund.
- But the maths means that only 7 years of outperformance would be needed to reach statistical significance, compared to 26 years if the S&P 500 were used.
Information ratio
The information ratio, takes into account both return and risk, and indicates the level of return obtained per unit of risk.
- A bigger number means more skill
The most widely used version of an information ratio is the Sharpe ratio, which measures excess return per unit of risk.
- This allows you to compare managers with different levels off risk and different returns.
But there is still the problem that many years of returns are needed to demonstrate statistically that outperformance is down to the manager’s skill.
Performance studies
Most studies show that past performance is not predictive.
Early studies looked at whether fund managers as a group outperformed the market.
- For me, this is the wrong question, because in aggregate the funds are approximately the market and must underperform because of the fees they charge ((This is the major argument in favour of investing via passive index funds ))
They did not outperform, and nor was proportion of outperforming managers higher than might be expected.
There were also problems with survivor bias.
- Managers that went out of business or merged were usually dropped from the sample, biasing results upwards.
And generally just a simple market benchmark (the S&P 500) was used.
Why past performance fails
Analysis of past performance can explain why a manager performed as he did during a period:
- sector selections
- stock selections
- beta
- factors – like a size, or value bias
But it doesn’t tell where performance will come from in the future, or what it will be.
Further problems include:
- fund manager turnover
- competition between managers arbitraging away opportunities
- not analysing through a bull and bear market cycle
- equal manager weighting
- manager life-cycle
Even where studies do look at a full cycle, the reasons behind each cycle are different, and what worked well last time may not work well next time (the dot-com bubble is a useful example here).
Weighting managers equally tells you how the average manager has done, but not the average investor.
- Funds should be weighted by capitalisation
Fund managers often take more risks early on in their career. They are trying to outperform and grow their fund.
- Once the fund is large, they have more incentive to play safe and become a closet tracker.
Growth versus value
Mark emphasises the role of style in determining short-term performance (90% causality).
- Selecting managers who have outperformed in the past five years is like selecting the factor that has done best recently (value, say).

The graph shows value stocks vs growth stocks.
- Sometimes value stocks do better, sometimes growth stocks do better.
- Investing in growth managers in 1999 on the basis of their recent track record would have been a bad idea.
Behavioural factors
Investors neither appreciate the role of uncertainty in investing, nor are they comfortable in dealing with uncertainty.
- Investors like to explain everything that has happened, and predict what will happen in the future.
- They associate uncertainty with a lack of control.
This is made worse by hindsight bias, when events are remembered not as they felt at the time, but reconstructed in the light of what subsequently happened.
- This makes things seem inevitable, when they are far from it.
People also have a tendency to assume that more information means more accuracy in prediction, but this linear relationship does not exist in practice.
- We also suffer from availability bias, and past performance is one of the most available pieces of information.
How to use performance data
Mark recommends using Bayesian statistics to analyse past performance.
This requires three pieces of information
- the range of abilities (alphas) across active managers
- generally people think that the average manager has zero alpha and two-thirds of managers would fall between +2% pa and -1% pa
- in practice, fees would drag these numbers down a bit
- your belief about a particular manager’s alpha
- this has to be based on things other than past performance (eg. process / philosophy / style)
- professional investors believe they can estimate this to within 1.5% pa
- past performance
As an example, Mark uses a hypothetical manager with 3% observed alpha over five years and a standard deviation of 6%.
Using Bayesian statistics Mark calculates that the range of all managers’ abilities should get a 35% weighting, estimates of the manager’s alpha should get 61% weighting, and past performance should get only 4% weighting.
- I can’t claim to understand how Mark has arrived at these figures, but they back up his point about not trusting past performance.
Mark suggests four criteria need to be met for past performance data to be useful:
- The benchmark matches the manager’s style
- The performance record covers many different market environments
- Either the portfolio is well diversified OR the manager specified in advance why certain investment decisions would lead to outperformance
- The alpha is large relative to the portfolio’s level of diversification.
He stresses that meeting all these conditions is very rare.
Mark recommends that investors use “volatility throttling” – that is, they allocate to several managers according to the inverse of their variance.
- The lower-volatility managers will get a bigger allocation because they probably have less noise in their style.
- This in turn will dampen the noise in the overall portfolio.
Conclusions
Although Mark’s research was aimed at institutional investors trying to choose one or more money managers, the basic lesson for private investors is clear:
- Past performance is a poor guide to future performance
Analysis of past performance can only explain what happened in the past.
- Recent outperformance is mostly down to the style (factors) used by a manager.
If you must use past data, then:
- Look at all available information on the manager’s process
- Control for survivorship bias
- Use a relevant benchmark
- Weight by market capitalisation when comparing funds
- Analyse over a full market cycle
- Look at where a manager / fund is on its career cycle (early growth or mature closet tracker)
- Use a Bayesian analysis to work out how much weight to give to past fund performance
- Use volatility throttling to make allocations within a portfolio
Until next time.
Mike Rawson
Mike is the owner of 7 Circles, and a private investor living in London. He has been managing his own money for 40 years, with some success.