Portfolio Review – Year End 2015 – Slow Ahead

It’s the first week of January once more, and time for my annual Portfolio Review. Let’s look at my performance over the past twelve months.
Contents
Benchmark
Let’s start by working out what we needed to beat.
As discussed back in January, I use a composite benchmark to measure my performance.
This is made up of four items:
- UK stocks – 32.5%
- International stocks – 32.5%
- UK residential property – 25%, and
- Cash – 10%
The asset allocation weights are derived by taking a target allocation for property and cash, and dividing the remainder between UK stocks and international stocks.
- I exclude bonds because I don’t hold any at the moment, preferring a higher than normal cash balance.
- The weightings are intended to be typical for a UK private investor aiming to reach financial independence.
- I have more than one property, and my main residence is in London, so my property weighting is higher than the benchmark.
- I also have more cash than the benchmark at the moment – I’ve just reached 55 and I’m building up the levels of cash in my SIPPs in case I want to withdraw the tax-free portion as a lump sum.
The individual benchmarks I use are as follows:
- FTSE All-share, total return = 1.0% for 2015
- FTSE All-world, ex-UK, total return = -1.3%
- Land registry data for England and Wales property = 5.6%
- Nationwide Champion ISA average rate for the year = 0.9%
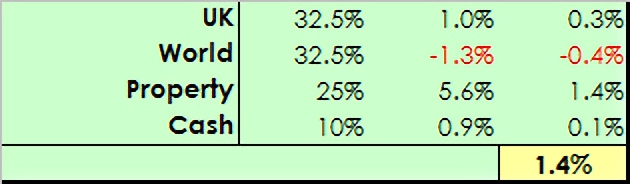
Blending these four together in the proportions described above gives me a target for the year of 1.4%, down from 4.2% in 2014.
So not much to beat this year.
Portfolio Review – Year End 2015
So how did I do? Well, at first sight I managed to beat the benchmark, but without having anything to write home about.
The growth in the portfolio for 2015 was 5.3%.
- That’s 3.9% better than the benchmark, but a lot less than the 15% to 20% reported by a lot of my friends on Twitter.
- Despite reaching the age when I can start withdrawing from my (private) pensions, I managed to be a net contributor during 2015, adding 0.3% to the portfolio.
- So net of new cash, the performance was a round 5.0%.
Let’s look at why I seem to be lagging my colleagues, and whether 5.3% might be a decent result after all.
Asset allocation
I run a big, diversified portfolio. It’s like a supertanker – it’s difficult to change its direction.
And it’s unlikely to ever return 20% a year.
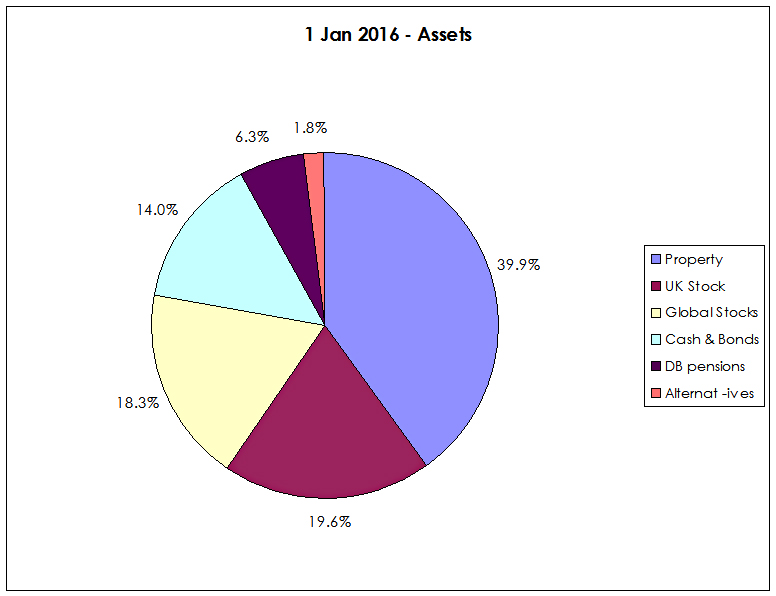
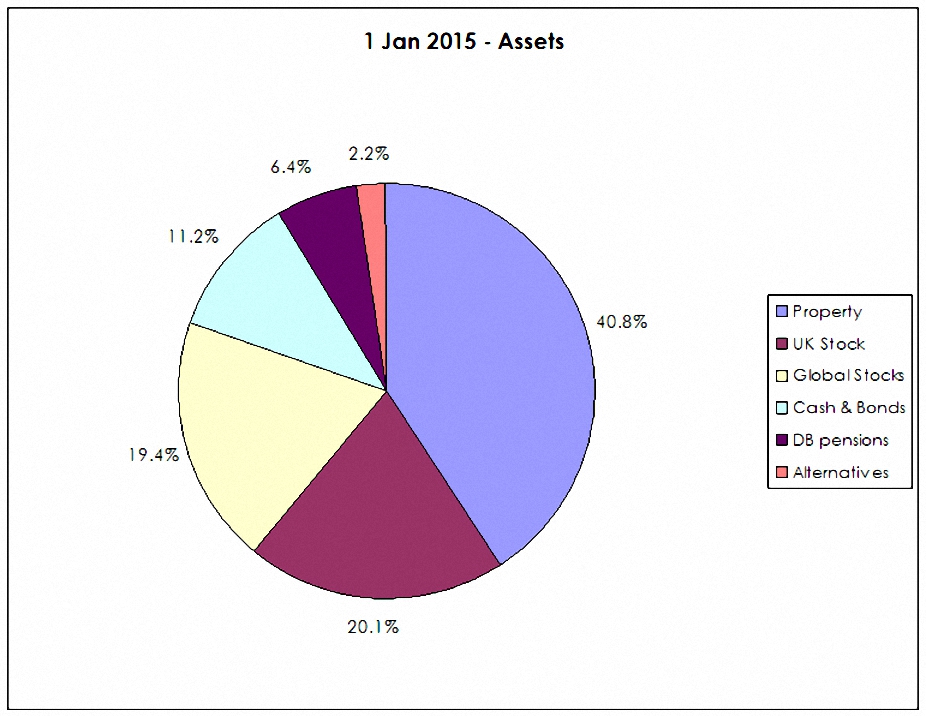
The portfolio is roughly 40% property, 38% stocks, 14% cash, 6% DB pensions and 2% other stuff. It hasn’t changed much from last year.
The table below shows the “performance” of each asset versus that component of the benchmark. In reality it reflects changes in asset allocation more than returns.
![]()
Returns by asset
Let’s look at the potential returns on these assets:
- my properties are in highly-rated parts of London, plus a moribund part of Manchester
- none of these areas is likely to do much more than keep up with earnings growth over the long run, unless the Northern Powerhouse causes a re-rating of property in Manchester dormitory towns
- international stocks should keep pace with global growth, plus an inflation factor, so maybe 5% a year here
- cash is on the floor at the moment, and the days of 5%+ returns appear gone forever
- but I don’t want to buy bonds at the moment, and I may need to take cash lump sums from my SIPPs
- the DB pensions are sums capitalised from the annual income promises in the future, and should do no more than keep up with inflation
- the alternatives are largely uncorrelated assets designed to return around 5% pa
- UK stocks could do better, though we’ve just had a bad year
So 80% of the portfolio is “doomed” to return rather less than 5%.
- Realistically only the 20% in UK stocks has the potential to return 20% pa like the guys on Twitter make.
Why this allocation?
So why stick with an allocation like this? The simple reason is because I’m old.
I’m already officially in the decumulation phase (though I haven’t withdrawn any cash yet).
- I have no income to fund extra contributions if I make a bad mistake
- I have a dependant to think of
So this is a defensive portfolio.
Why not trade more?
The other factor behind this performance is that I was so busy during 2015 with setting up this website, that I hardly had time to trade.
The only portfolio I worked on was the SmallCap Growth (AIM) portfolio, and even that still isn’t fully invested.
- This is not a big deal, since most of my money is arranged so that it can be pretty much ignored if necessary.
But what if I had traded more?
Realistically, I’m only likely to actively trade the 20% currently in UK stocks.
- Let’s say that I did well, and made 20% return on that 20%. That’s 4%.
- Add that to the 4% from the remaining 80% of the portfolio (at 5% pa), and you get a total of 8%.
So with a lot of work I might have boosted my 5% for 2015 to 8%. Which is fine.
But that’s about my limit unless we have another fantastic year for global stocks.
Not so bad?
But maybe 5.3% is ok. Here are five reasons why I might think so:
- 2015 was the hardest year to make money for 78 years
- Even Warren Buffett lost 11% in his Berkshire Hathaway vehicle ((I’m grateful to Matt Bird for pointing this out, along with the CNBC link above ))
- The true comparison is not with other investors ((even the lovely people on Twitter )) but with your old self, in this case from a year ago – and I am up for the year
- I did beat my benchmark by 3.6%
- Most importantly, that 5% increase in the value of the portfolio represents more than five years of living expenses for me and my partner
So adding on the year we’ve lived through, we have six more years in reserve than we did in January 2015.
Which is what I call a result.
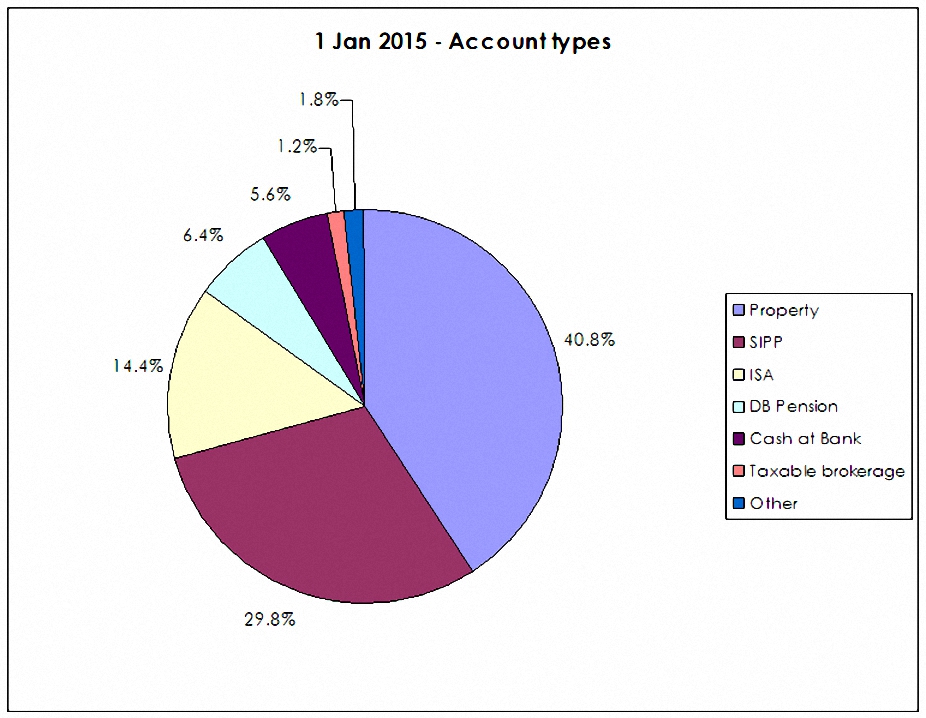
Product types
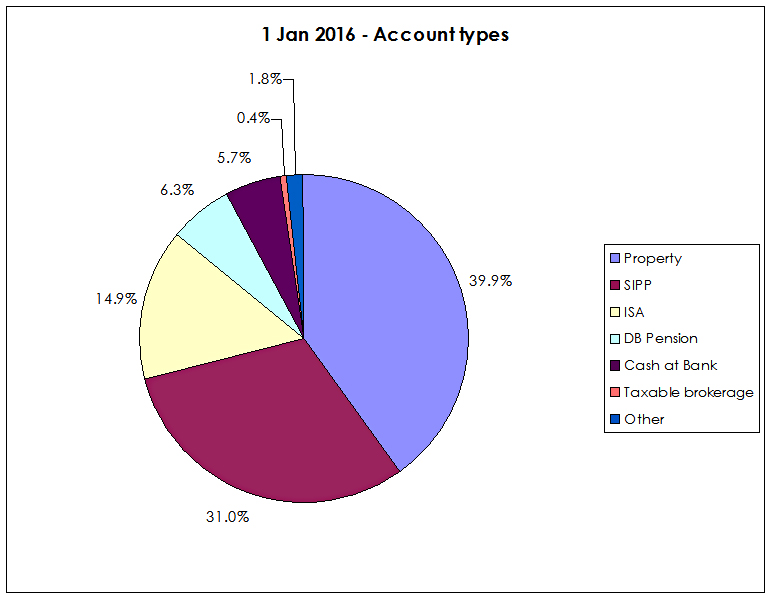
Along with 40% in property, 36% of the portfolio is in tax-sheltered accounts (SIPPs and ISAs). Another 6% is in DB pensions and 2% in “Other” items (non-taxable VCTs, NS&I bonds and an endowment policy).
The nominally taxable items are cash and a small taxable brokerage account – 6% in total. Even here there are routes to move this money – over a number of years – into tax-shelters without triggering tax.
These allocations haven’t changed dramatically since last year.
Two-year performance

I’ve added the 2015 performance to the numbers we worked out for 2014.
- We’re up 16.3% over two years, with an annual compound growth rate of 7.9%.

The normalised chart above shows how the relative proportions of the assets have changed.
- Cash is up and stocks are down.
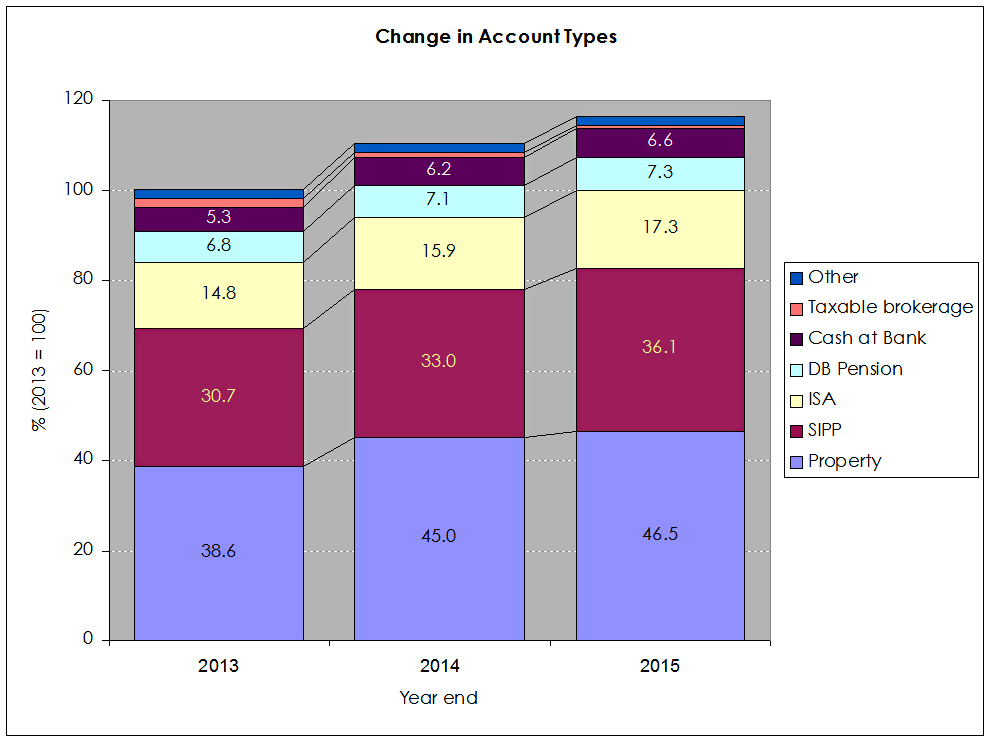
This chart shows how the various account types have grown over the two years.
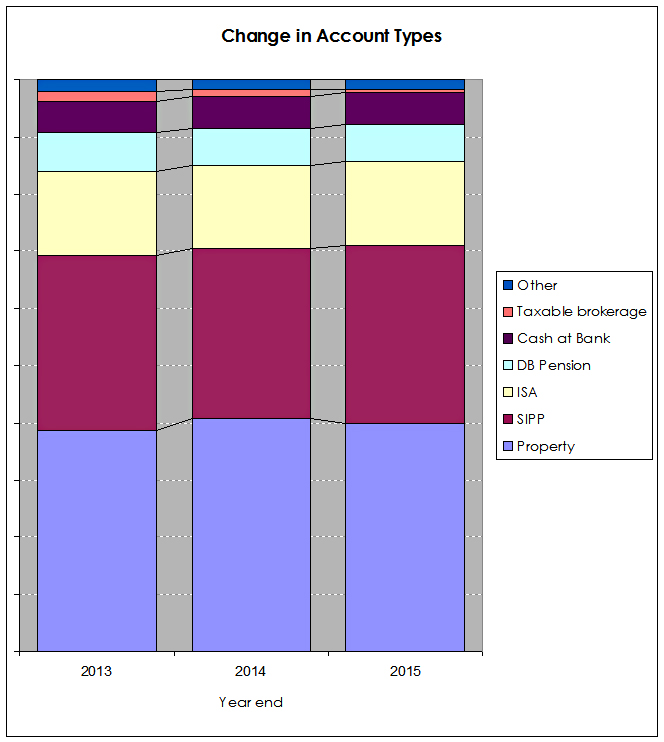
The normalised version shows how the taxable brokerage accounts have almost disappeared, and the “others” have shrunk.
I like how these two-year charts have turned out, and when I have some time I plan to extend them further back into the past.
- I think I have about 10 years of data somewhere on my hard drive.
Prospects for 2016
I don’t expect too much to change in 2016:
- the property allocation will remain the same (40%)
- the international stocks won’t change much (18%)
- cash levels won’t change much (14%) unless there is a major buying opportunity
- the DB pensions will be unchanged (6%)
But there are a few things that will happen:
- the endowment policy is due to mature (<1%)
- so are the NS&I bonds (<1%)
- and the VCTs may be sold for cashflow (<1%)
I’m also likely to take a more active approach with the UK stocks (20%) and trade more than in 2015.
But what the returns from this strategy will be, nobody knows.
Until next time.
Mike Rawson
Mike is the owner of 7 Circles, and a private investor living in London. He has been managing his own money for 40 years, with some success.


Hi Mike, your article inspired me to review my portfolio and I have been using your excellent Asset Allocation article back from November as a guide. I am overweight in UK and Japan and yet have no exposure to Emerging Markets which would seems like a good time to put right given recent drops. I have read both series of articles on ETFs and Invest Trusts but can’t decide which is the best route to take and how many funds I should split the 6% on Emerging Markets by. Any suggestions on how to solve this?
Hi Martin,
I agree that it could be a good time to top up in emerging markets.
I always think that less developed markets can benefit from the active management of ITs, but it really depends on how much faith you have in the index that the comparative ETF will be tracking.
On the other hand ETFs are generally much cheaper, so you might want to mix the two approaches.
The number of funds depends on the size of your portfolio and your trading costs, but also whether you plan to watch your investment closely or not.
You could get away with one fund if you watch it like a hawk, but with 6% of your portfolio in emerging markets, a more conventional answer would be to aim for three funds, each at 2% of your net worth.
As always, DYOR.