Quality Shares 1 – Profits and Return on Capital

Today’s post is our first visit to a recent book by a UK analyst with whom you might be familiar – How to Pick Quality Shares by Phil Oakley.
Contents
- Phil Oakley
- Process
- Requirements
- Portfolios
- Quality Companies
- Profits
- Interest and tax
- Income statement
- Exceptional items
- Profit margin
- A Company’s Interest Rate
- Return on capital employed (ROCE)
- Balance sheet
- Capital employed
- Cash
- Averages
- Domino’s ROCE
- Leases
- DuPont analysis
- DuPont and Domino’s
- Company report
- Conclusions
Phil Oakley

Phil Oakley is an investment analyst and private investor.
- He works for ShareScope, which is part of Ionic Information (along with the portable version of the software, called SharePad).
ShareScope is a software and data solution for analysing companies, aimed at private investors.
- Phil publishes regular tutorial articles showing you how to get the best out of the software (they are useful to non-users also).
Before that, Phil spent 13 years as an investment analyst, leaving the City in 2009.
- He worked for MoneyWeek before joining ShareScope in 2012.
He has the Chartered Institute of Securities & Investment Diploma and the Certificate in Private Client Investment Advice & Management.
- And now he’s written a book.

Process
The book provides a three-step strategy to analyse companies in order to find good long-term investments:
- find quality companies
- those with higher returns (profits and cashflows) on your investment
- Phil uses an “interest rate” concept here, to make things more accessible
- avoid dangerous (risky) companies
- this is largely to do with debt, including hidden debts and pension fund deficits
- don’t pay too much for the shares
- though you may have to pay more for quality or growth companies
- note that Phil doesn’t like the popular valuation methods and suggests some alternatives
It’s a quant process (numbers) rather than a qualitative one (people).
- But you only need basic arithmetic skills to follow it.
The book has lots of real-life examples, mostly from the UK, with Domino’s Pizza being the main one.
- This is a quality business that has shown great returns over many years.
- And it’s a firm whose products many people will be familiar with (( Disclosure: I have never eaten a Domino’s pizza ))
Phil warns against using the system on banks or insurance companies – it’s strictly for non-financial firms.
And it’s not a “get rich quick” scheme.
- It’s a long-term process, perhaps for the rest of your life.
Phil is a firm believer that amateurs can beat the professionals.
- Like me, he thinks that you should become a DIY investor.
Requirements
Phil’s process requires access to the company accounts, which can be directly (paper or online) or via software like ShareScope. (( Other analysis packages are available ))
- And, of course, that means that you need to know your way around a P&L (income statement), a balance sheet and a cash flow statement.
Portfolios
Phil recommends a concentrated portfolio of 10 to 15 stocks.
- And a minimum of £3K per firm, meaning you need £30K to get started.
For me, this needs some context.
- £30K is plenty to get a portfolio of the ground.
But you shouldn’t put your entire wealth into an actively managed portfolio of UK stocks.
- In fact, it’s unlikely that such a portfolio should ever make up more than 30% of your net worth.
And you need some wealth in safer places before you start allocating to active shares.
- I would suggest about £80K before you put the next £20K into stocks.
There’s more detail on how to use multiple portfolios here:
- Pick and Mix Portfolios – your choice from zero to £1M
Quality Companies
Phil uses three things in order to work out whether a company is high quality:
- Profits, where Phil uses two indicators
- Sales and Profit history
- Profit margin, the first of several ratios(between numbers in the accounts) that Phil looks at
- Return on Capital Employed (ROCE)
- Free cash flow
- Phil is particularly keen on cash flow, so we’ll come back to that in the next article.
For today, we’ll look at Profits and Return on Capital.
Profits
Profits (also known as income or earnings) are derived from sales (also called turnover or revenue).
So the first thing Phil looks for is a company that has been selling more each year.
- A company whose sales go up is growing, and can be called a growth company (depending on some minimum rate of growth).
Sales are vanity, profit is sanity – old business saying
But you also need the firm to be converting sales into profits.
- Often during periods of strong growth – especially when a company is small – it will not be profitable.
- It may be developing its product, or spending on marketing to build up its brand.
Where things get complicated is that there are six measures of profit.
1 – Gross profits
- These are sales less the cost of goods sold (raw materials, rents, wages and advertising etc).
- Different companies use different expenses, and they don’t really want customers or competitors to see how profitable they really are
- So the number itself is not crucial, but the trend from year to year can be useful
2 – Trading (operating) profits
- Here we also deduct items like depreciation on plant and machinery, and admin costs.
- This is a good and reliable number to use to compare companies, and years.
- It also has the advantage that interest (from debt) and tax (on profits) are not included.
3 – Earnings (profit) before interest and tax (EBIT)
- This is similar to operating profit, but includes the companies share of profits from associates and joint ventures (businesses now wholly owned by the company).
- EBIT is Phil’s favourite profit number, and we’ll come back to why that is in a moment.
4 – Profit before tax (PBT)
- Here we add in interest received, and take away interest paid.
- A lot of analysts and media commentators use this number, but Phil prefers EBIT.
5 – Profit after tax (PAT)
- The current rate of UK Corporation tax is 19%.
- This can be adjusted to reflect profits made outside the UK, but also because certain expenses are not tax-deductible.
- Other expenses receive a more favourable than usual treatment.
- Domino’s effective rate for 2015 was 18.96%, below the 20% rate at the time.
- Phil warns us to be wary of companies with very low effective tax rates, as the condition that keeps them low may not last forever.
- The variation in effective tax rates means that PAT is not very useful in comparing companies.
6 – Earnings per share (EPS)
- Phil is not a fan of the widely-used EPS number, as it can be calculated in many ways.
- The best calculation is PAT, minus profits due to minority interests and preferred shareholders, divided by the weighted average number of shares in issue throughout the year.
- Buying back shares will increase the EPS without an increase in profits
- To Phil, this means that a rising EPS doesn’t mean a good company, but to shorter-term / momentum style investors, share-buybacks and a rising EPS would be a positive sign.
- Phil also recommends that you look at fully diluted EPS, which adds back future shares from options and convertible debt.
Interest and tax
Phil likes EBIT because it’s the best measure of “how good the management of a company is at making money from the company’s assets”.
- In particular, it ignores the effect of interest (and hence debt) and of taxes.
He uses two friends (John and Bob) who are landlords to illustrate.
- Each buys a house worth £100K, but John uses cash, whereas Bob uses a £5K deposit and a 95% loan (mortgage).
- The loan costs 5% pa in interest.
They each manage somehow to find a tenant willing to pay £10K a year in rent.
- That’s a 10% yield, which would be enough to tempt even me into buy-to-let.
- And to simplify the example even further, Phil assumes that this is £10K of net rent, after the expenses of running the properties.
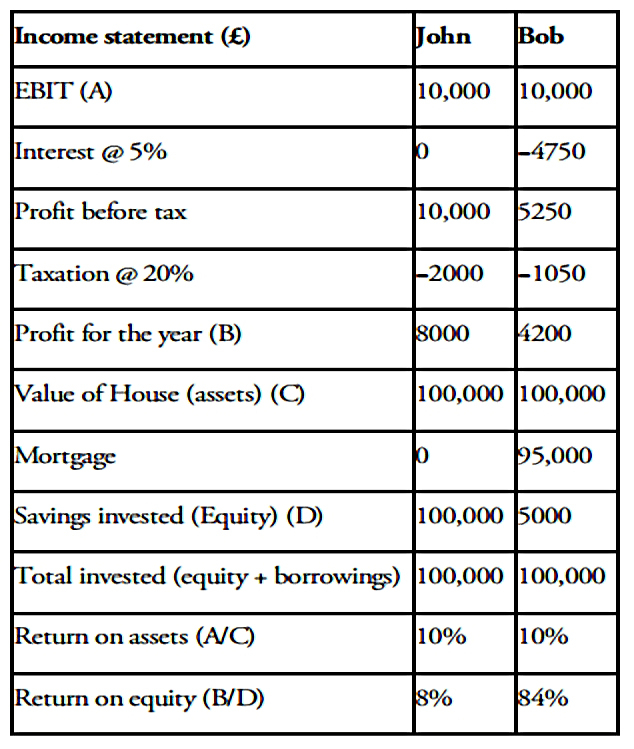
John has made more cash than Bob, since he only has to pay 20% tax on his earnings, while Bob needs to repay the interest.
- But Bob thinks he’s done better since his return on equity (he only has £5K of his own money in the house) is 84% compared to only 8% for John.
The return on assets for both of them is 10%, since this is based on EBIT.
Phil says that although debts and taxes matter a lot in other contexts, they can make it more difficult to identify a good business.
- So he sticks with EBIT, and looks for EBIT growth that is larger than revenue growth.
Income statement
All of these profit calculations come from the company’s income statement (formerly known and the profit and loss – P&L – statement).
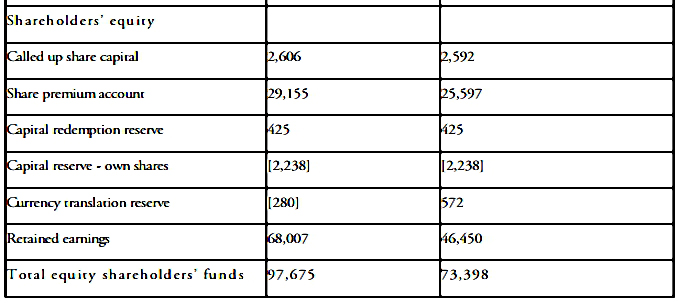
- Phil provides the statement from Domino’s for 2015 as an example.
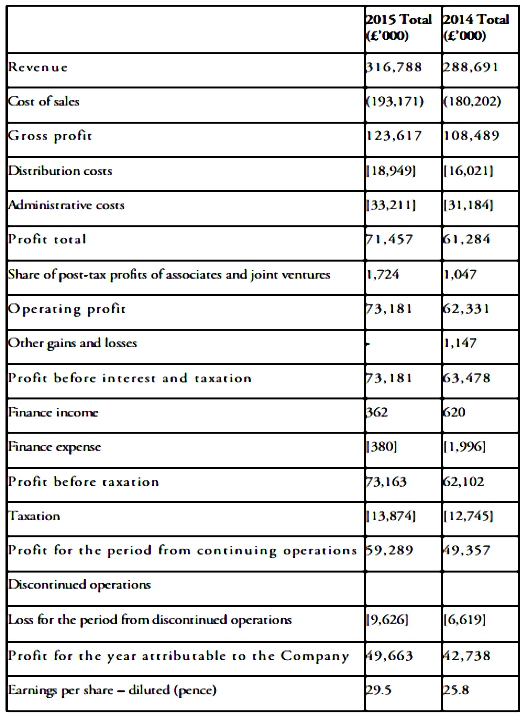
Negative numbers appear in brackets – this is an accounting convention, as you may have noticed from the formatting options in whichever flavour of spreadsheet you favour.
Phil recommends calculating the percentage change from year to year, which he’s done in the next table:
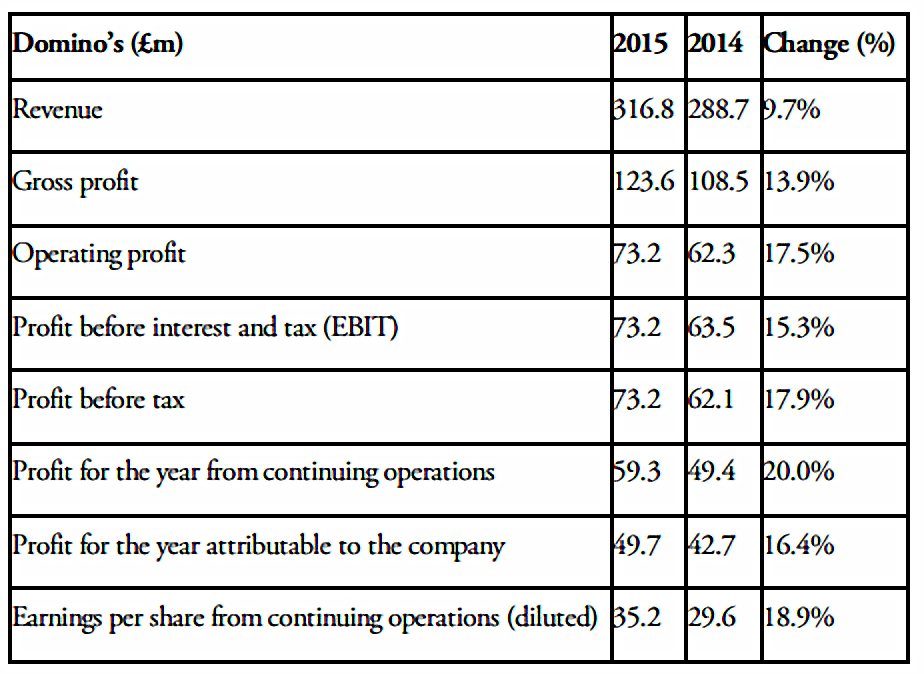
Phil looks for the increase in profits to be larger than the increase in revenues (which was 9.7%).
- This is the case for Domino’s, across all six measures.
Phil recommends a ten-year EBIT view as the best profit indicator.
- This should cover all parts of the economic cycle.
Here’s the 10-year chart for Domino’s:
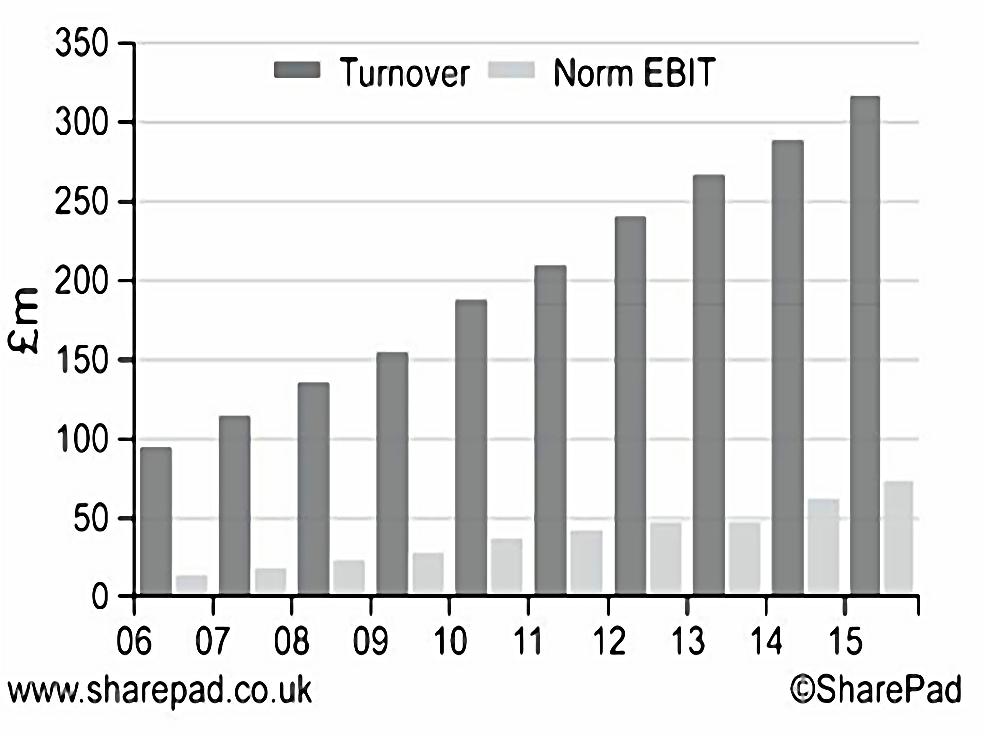
Phil includes sales along with EBIT, since he wants to see sales growing.
- But I think that without a second vertical axis, this makes the growth in EBIT harder to see.
EBIT can also be boosted by cutting costs, but there’s only so far that you can go with this.
Exceptional items
Note that Phil’s chart used “normalised EBIT”, which strips out “exceptional items” – one-off gains and / or costs.
What counts as exceptional is a matter of opinion, and many recent accounting scandals revolve around exceptional items that seem to occur every year.
- This is done to artificially boost profits.
You should be wary of companies which have regular one-off expenses and where normalised EBIT is always significantly higher than total EBIT.
This is telling you that these costs are not really one-offs, but regular. This can be a sign of aggressive accounting and is often a signal to steer well clear of a company.
Domino’s EBIT numbers are fairly close together most of the time:

Profit margin
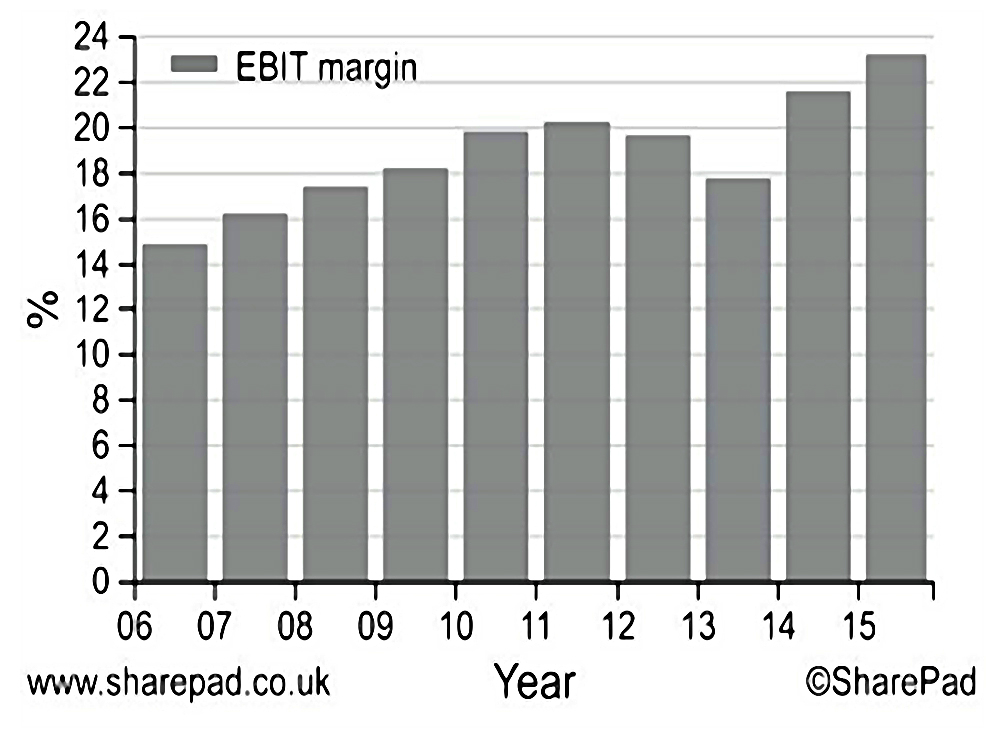
Phil also likes to calculate the EBIT margin (profit margin):
EBIT margin = EBIT / sales × 100%
High profit margins are best, since a temporary period of difficulty is more likely to leave the firm in profit.
- Phil sees high margins as combining quality and safety.
- He looks for a margin of 10% to 15%, consistent over time.
Different sectors have different profit margins, so you need to be careful in choosing the right comparator companies.
- Phil doesn’t attach too much significance to sectors, but rather simply looks for high margins.
As with EBIT, Phil looks at ten years of margins:
A Company’s Interest Rate
Phil wants to know how much a company spent to produce its sales and profits.
- How is it growing?
Usually companies need to invest in new assets that support increased production.
- Sometimes, companies grow by buying other companies.
Either way, as investors we need to understand if the company is getting a good return on what it spends.
- Phil calls this return the company’s interest rate, but it is usually referred to as return on capital (or Return on Capital Employed – ROCE).
- Phil looks for a ROCE of 15% pa or more.
I’m guessing Phil’s term is at some level intended to conjure up a comparison to the returns available from bank accounts.
- Despite this, he makes it clear that he’s referring to the returns earned by the company, rather than by the investor.
Return on capital employed (ROCE)
ROCE = EBIT / capital employed × 100%
Phil prefers the term money invested to capital employed, but they sound pretty similar to me.
Phil uses the landlord example from earlier to work out two approaches to the capital employed:
- The value of the house (£100K
- the asset purchased
- The cash deposit (£5K) and the mortgage (£95K)
- the money spent, which also totals to £100K.
Balance sheet
This leads neatly into the balance sheet, which also by design includes two ways of calculating a company’s capital:
Assets - liabilities = net assets = shareholders' equity
More usefully for us:
Assets = equity + liabilities
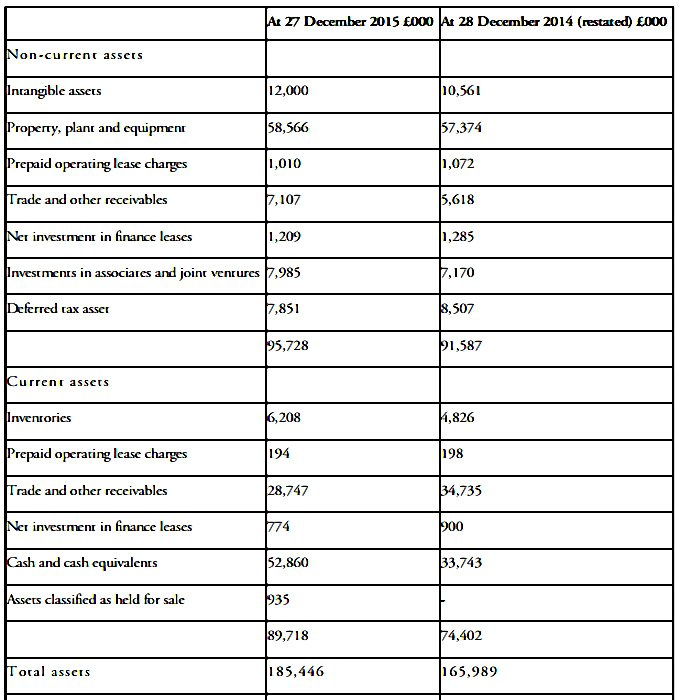
Capital employed
For the first version of the calculation we start with the total assets, and take away “non-interest-bearing current liabilities”.
- These are things like trade creditors, accruals and tax.
These need to be removed because they act like interest-free credit, reducing the amount of money a company needs.
- Domino’s suppliers are owed £52.91m at the end of 2015.
- But these costs have been expensed in calculating the profits.
In practice you can just subtract current liabilities and add back the financial liabilities (short-term borrowing).
- Capital employed = total assets – current liabilities + short-term borrowings
So, Domino’s capital employed was:
- £185.4M – £71.3M + £1Mm = £115.1M
This is the assets version of capital employed.
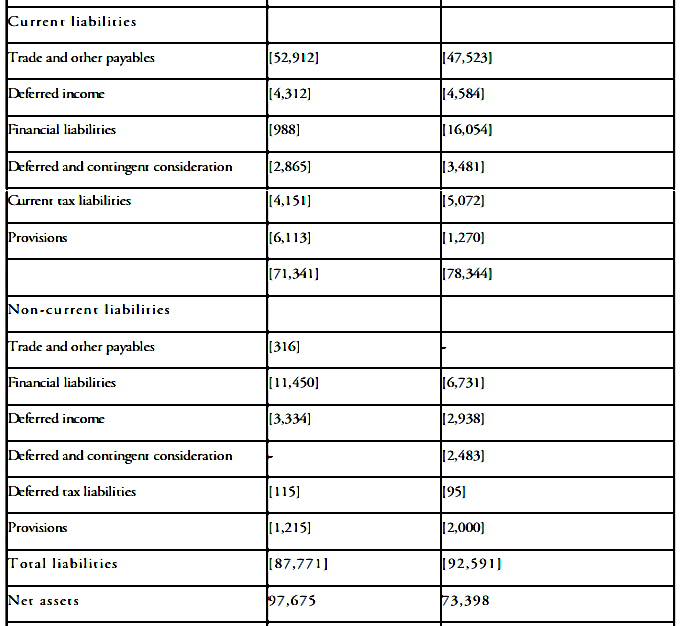
The alternative method uses the liabilities and equity.
- Capital employed = long-term liabilities (inc. debt) + equity
Note that liabilities here include short-term borrowings.
- For Domino’s, this is total borrowings (£1.0M + £11.4M), plus other long-term liabilities (£5M), plus total equity of (£97.7M) = £115.1M.
Which is of course the same number, since we are just re-arranging the balance sheet.
Cash
Some people remove cash from total assets but Phil says that an outsider can’t know if this cash is really the company’s to do with as it pleases (eg. to repay debt).
- Phil says that leaving cash in the calculation is the more conservative approach
- But obviously at some level of cash (as with the big tech firms at present) any surplus really is free cash.
So there’s an element of judgement here.
Averages
The balance sheet is a snapshot taken on a single day, unlike the income statement which summarises the activity across an entire year.
- So some assets in the balance sheet won’t have been productive for the whole year, and others will have been useful and then sold.
The way to get around this is to average the figures from two years (in this case from 2015 and 2014).
- For Dominos this means (£115.1M + £103.8M)/2 = £109.5M
Domino’s ROCE
So Domino’s ROCE is 73.6 / 109.5 * 100% = 67% pa
- Which is extraordinarily high.
Phil says that anything higher than 20% pa is the sign of a quality company.
As usual, Phil likes to look at the 10-year track record (in this case, his chart goes back 20 years):
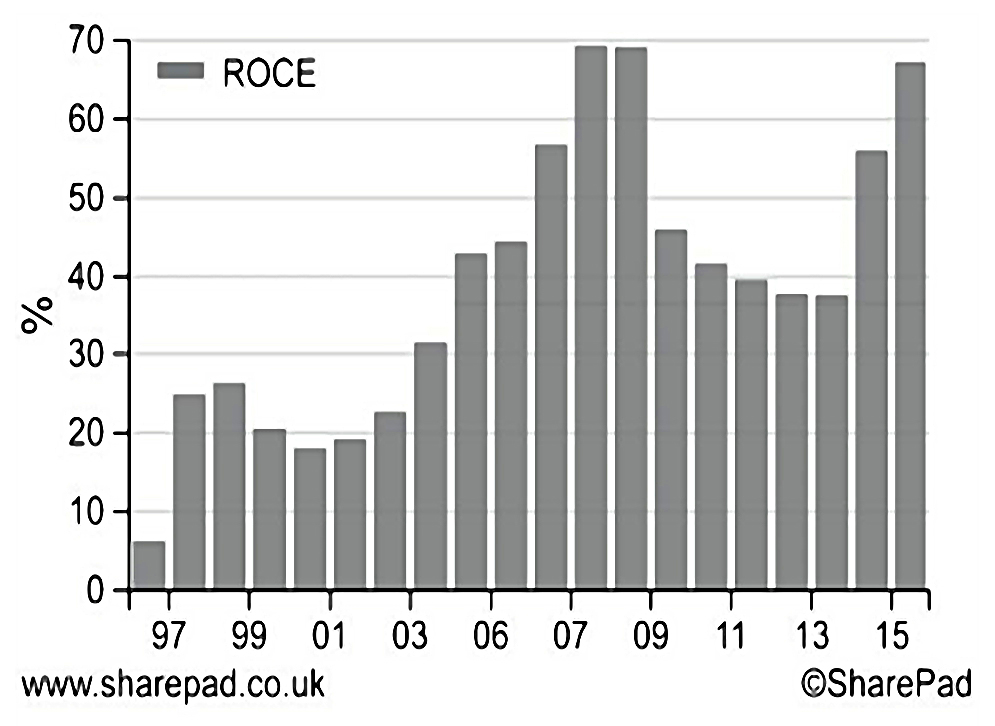
There has been a relative crash, and a recovery.
- But ROCE has been above 20% for 17 of the last 20 years.
Leases
Domino’s ROCE appears to be so high because it has what are effectively off-balance sheet assets.
- It leases its shops, and will usually have committed to make rental payments for many years into the future.
- This is a common situation when analysing high street retailers.
Airlines and train companies also frequently have lots of leases.
- From 2019, these obligations will be added to balance sheets.
Until then, Phil calculates a lease-adjusted (rent-adjusted) ROCE.
The first step is to estimate the value of the rented shops (this should appear on the balance sheet).
- Then add this to the amount of capital employed.
And you need to do this for two years because we are using average assets.
- You also need to adjust profits by adding back in the interest portion of the lease payments.
So it’s a four-step process.
Phil calculates the value of leases by multiplying the rental payments by 7.
- A range of 6 to 8 is used by credit rating agencies and most analysts, but you need to be consistent.
The lease payments are in a note to the accounts:

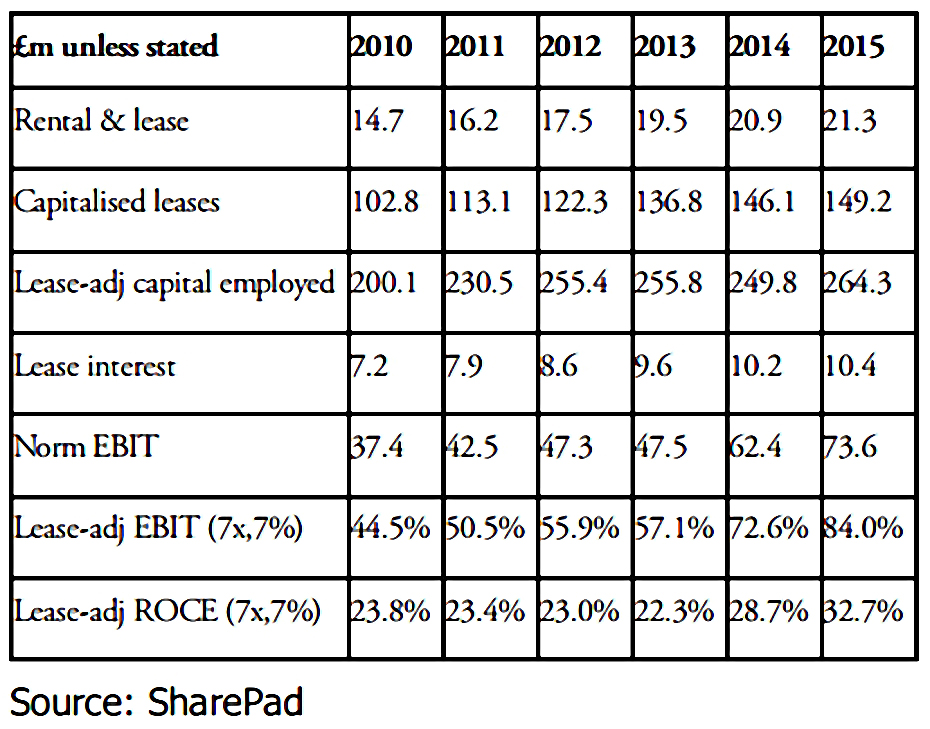
Phil multiplies £21.3M by 7 to get £149.1M
- This is then added to the capital employed: £115.1M + £149.1M = £264.2M.
Since Phil uses EBIT to calculate ROCE, the interest element of the rents needs to be added back to the profit figure.
So the lease-adjusted EBIT is now £73.6M + £10.4M = £84M.
For 2014, rentals are £20.9M.
- Multiply that by 7 to get £146.1M.
- Add this to the original capital of £103.8M to get £249.9M
So the average capital is (£264.2M + £249.9M)/2 = £257.1m
- And the lease-adjusted ROCE is now £84M / £257.1M = 32.7%
This is less that half the previous number, but it’s still terrific.
Phil provides a table of adjusted ROCE for the previous six years and a chart for the previous 10 years.

DuPont analysis
DuPont analysis was invented by Donaldson Brown in 1919 (when he was working for DuPont).
- It attempts to explain how a company makes its profits, breaking out the impact of margins and sales relative to capital.
- It should also indicate how sustainable profits are, and whether they will improve or get worse in the future.
ROCE = profit margin × capital turnover (sales per £1 of capital)
or:
ROCE = EBIT / Capital = ( EBIT / Sales ) * ( Sales / Capital )
Profit margins have four drivers:
- prices
- costs
- fixed and variable, which grow with sales
- companies with high fixed costs have high operational gearing, and their profits fluctuate wildly in response to changes in turnover
- product mix
- some lines are more profitable than others
- volumes (sales)
High-quality companies grow by selling more (increased volume), rather than raising prices.
- Higher prices and flat sales indicate trouble ahead.
Fluctuating profit margins indicate a cyclical business (with sales linked to the economic cycle) or possibly high operational gearing.
- These are risky stocks not suitable for the long-term.
- So Phil looks for stable profit margins.
Capital turnover can be increased by:
- Boosting sales with new products
- Reducing investment eg. in new assets
- less capital expenditure – capex
- Reducing working capital
- holding less stock, getting customers to pay faster, paying suppliers later
- Getting rid of underperforming assets
- low capital turnover / low ROCE ones
DuPont and Domino’s
As before, Phil provides a 6-yr table and a 10-year chart of this analysis for Domino’s.
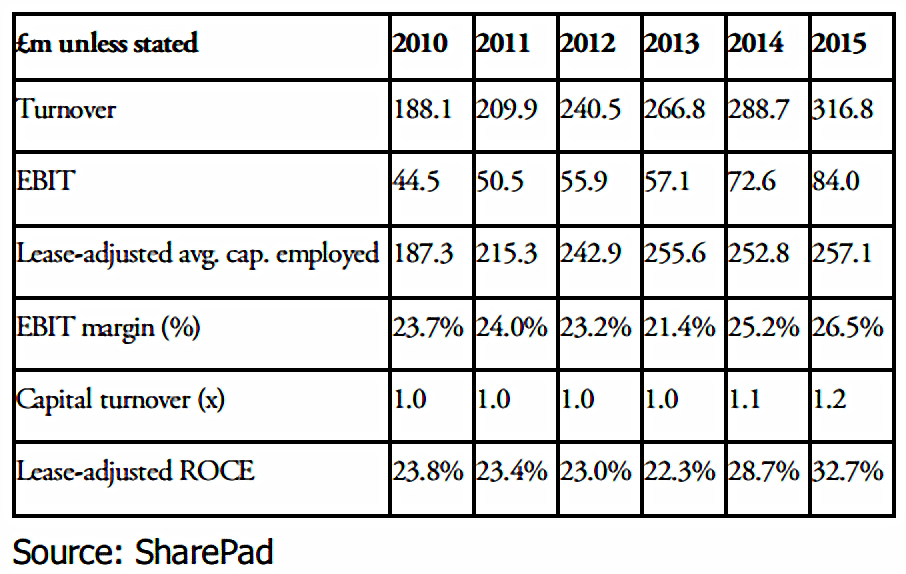
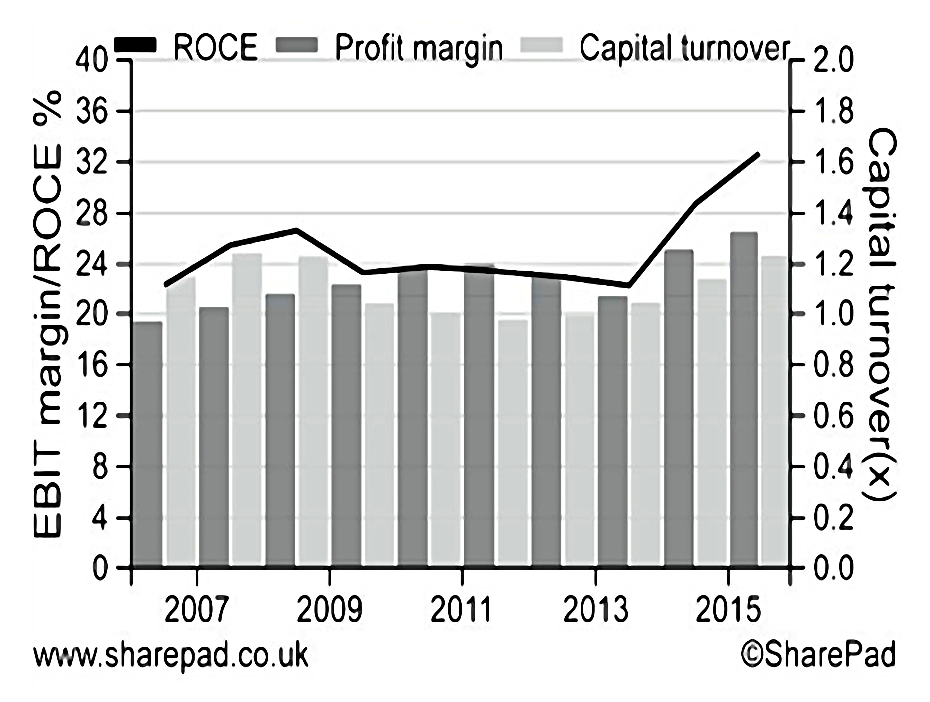
I can’t say that I find the chart the clearest.
- There is a discernable trend for profit margin to mostly increase (apart from 2012-13).
- Whilst capital turnover rises then falls, before recovering.
To investigate further, Phil looks at 2013 to 2015.
Phil first multiplies the 2013 profit margin by the 2015 capital turnover:
- 21.4% × 1.234 = 26.4%
He compares this to the 2013 capital turnover multiplied by the 2015 margin:
- 1.042 × 26.5% = 27.6%
He concludes that profit margins have had a bigger effect than capital turnover.
- This seems a relatively small effect to me.
Next he drills into profit margins, by looking at sales and expenses.

Domino’s has added £47.9M of sales from 2013 to 2015, but costs have increased by only £22.6M.
- So more than half its extra sales were turned into profit.
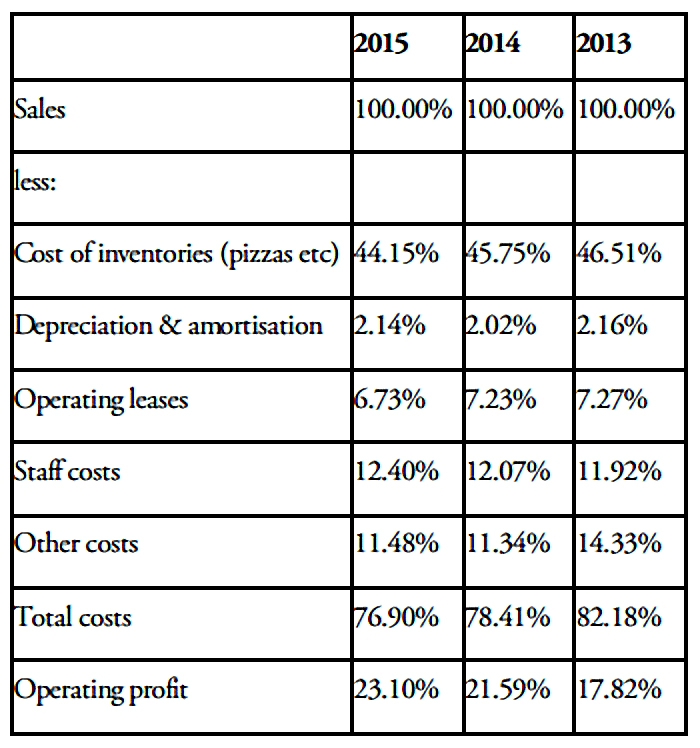
Alternatively, a 17.8% increase in sales led to a 52.7% increase in profits.
- This is operational gearing in action, but we could have deduced that Domino’s would be such a company.
Inventories (ingredients) have fallen by 2.36% of sales.
- And “other” costs are down from 14.3% of sales to 11.5%.
Once again, I’m struggling to understand the significance here:
- Margins are up because costs are down compared to sales.
- How else could it work?
Company report
Next, Phil turns to the company report, which confirms positive operational gearing and lower ingredient costs.
- So the increase in margins might reverse if food costs increased.
- Buying power with suppliers has increased, which is obviously good.
Phil recommends that you compare the companies comments with the opinion you have formed from your own analysis.
- Try to invest in companies where these match (and are positive).
Conclusions
We’ll leave it there for today.
This is a good – and dense – book, with lots to take in.
- I was impressed with the section on profits, and why EBIT is the most useful of the six available options.
- I also like the part about profit margins, and in particular the lease-adjusted margin calculations.
The most frustrating section so far has been the DuPont analysis, which sounded so promising in theory but illuminated little in practice.
- Perhaps this is just because Domino’s is not a good candidate for this kind of approach.
It seems likely to me that even a qualitative version of DuPont – looking at the likely changes in all the drivers of margins and capital turnover – would be useful in many cases.
- I’ll be back in a few weeks with the next couple of chapters in the book, which are about Free Cash Flow.
Until next time.
Mike Rawson
Mike is the owner of 7 Circles, and a private investor living in London. He has been managing his own money for 40 years, with some success.