Quality Shares 3 – Debt

Today’s post is our third visit to How to Pick Quality Shares by Phil Oakley. Today we’re looking at debt.
Avoiding dangerous companies

One of the key contributions to investment success is avoiding the companies that lose you money.
- For Phil, this is all about avoiding excessive debt.
There are three types of debt to look at:
- Borrowings from banks and investors (via bonds).
- Leases (from renting rather than owning assets).
- Phil calls these hidden debts.
- Pension fund deficits.
Normal debt
Some debt is normal.
Because debt is frequently secured against assets (like a mortgage on property), and because lenders get paid interest before shareholders get paid dividends, debt is cheaper than equity.
- Paying interest on your debts is mandatory, whilst dividends are optional.
- Debt interest is also tax-deductible, whereas dividends are paid from after-tax income.
So the more debt (and the higher the interest rate) the bigger the share of profits will be spent on servicing it.
- Shareholders will get less of the pie, and perhaps none at all.
The key thing is to only invest in companies with low debt relative to capital employed, profits and cashflows.
Gearing
The effect of debt interest is to multiply the effect of changes in profits on what is left for shareholders.
- This is known as gearing.
One of the reasons that property is such a popular investment is that it’s the easiest asset for the ordinary person to borrow a large proportion of money against.
- 95% mortgages were common for many years, though 80% to 90% loans are more common these days.
This means that with only the 20% deposit coming from your own pocket, a 5% rise in the price of the house feels like a 25% profit on your own money.
- Conversely a 5% fall is effectively the loss of 25% of your equity.
Imagine how you would feel if a friend or relative said that they planned to invest hundreds of thousands of pounds in the stock market, and that they had borrowed 90% of the money.
- That’s gearing, and it’s seen as completely normal with property.
So debt is great in the good times, and bad when things go sour.
Phil illustrates by comparing two companies, each with £1 bn of capital and £200M in profits (ROCE = 20%).
- Company A has no debt, but Company B has £800M of debt at 10% interest (very high for today), leading to an £80M interest payment each year.
Phil ignores operational gearing (the tendency for profits to increase faster than sales since some costs are fixed) in this example.
- Phil is not a fan of operational gearing because of the risks when things go wrong.
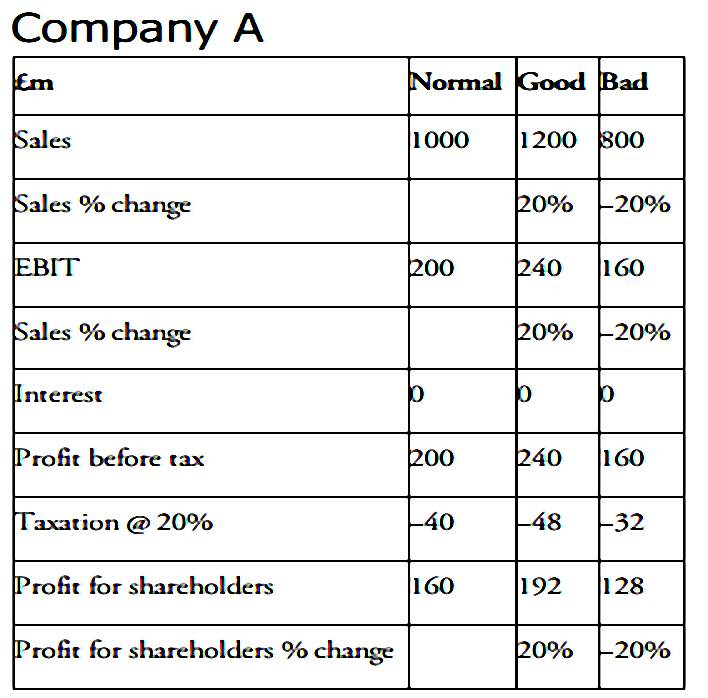
After tax at 20%, Company A returns £160M to shareholders.
- If sales go up by 20%, so do profits.
- If sales fall by 20% , so do profits.
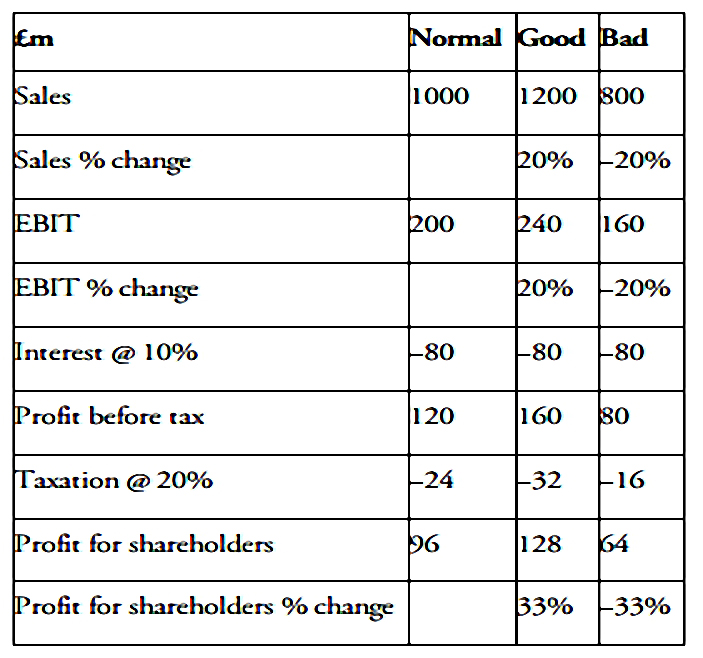
Company B has to pay the £80M of interest come what may, and so:
- the regular profit is £96M rather than £160M.
- a 20% increase in sales boosts this by 33% (to £128M, compared with 192 for Company A).
- a 20% decrease in sales cuts profits by 33% (to £64M, compared with £128M for Company A).
So a 20% fall in sales means that shareholders in B get only half what shareholders in A receive.
- This shows how debt is particularly dangerous for cyclical companies, whose sales move in line with economic and / or commodity cycles.
Measuring debt
Phil uses four ratios to judge debt on the balance sheet (normal debt):
- Debt to free cash flow.
- Debt to net operating cash flow.
- Debt to assets.
- Interest cover.
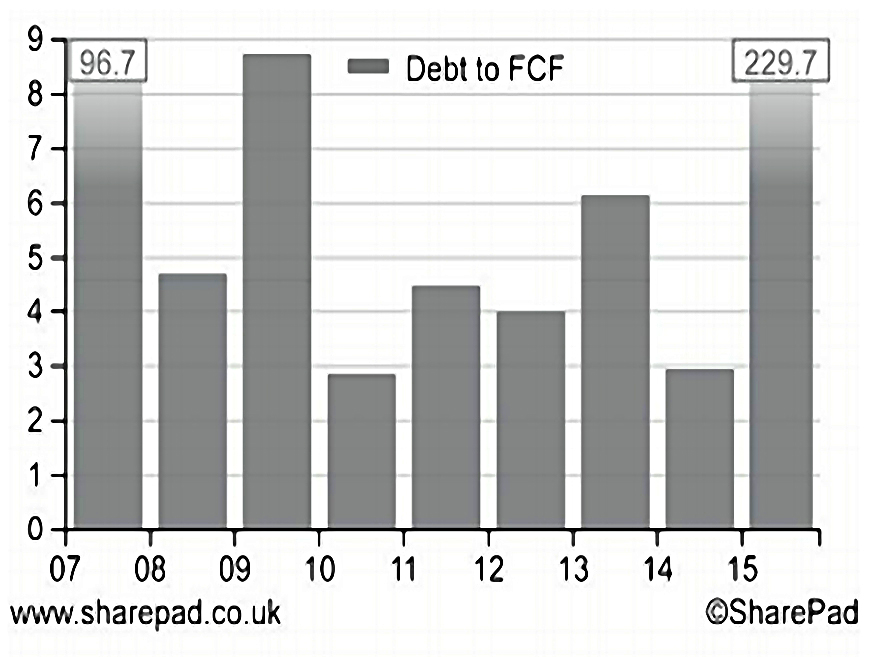
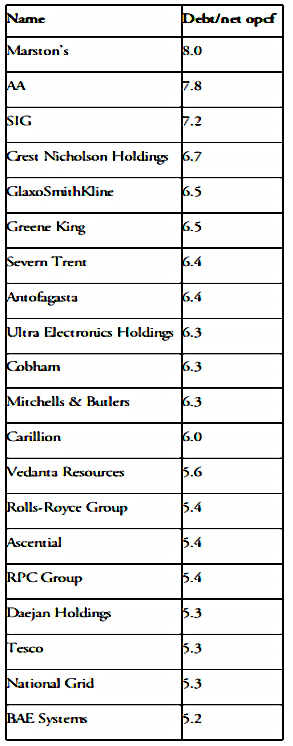
Debt to free cash flow
Debt to free cash flow = total borrowings / free cash flow
Debt to free cash flow tells you how many years it would take to repay the debt with the current rate of free cash flow it is producing.
- Phil wants this number to be below 10, but positive. ((It will be negative if the company has negative free cash flow ))

Property, pubs and utility companies normally have high debt as their cash flows are more stable.
- Rolls-Royce would take more than 200 years to repay its debts from its free cash flows.

Debt to net operating cash flow
debt to net operating cash flow = total borrowings / net operating cash flow
Net operating cash flow is the cash from trading after tax has been paid.
Phil calls this number a “worst-case scenario” test, as it assumes no further investment assets.
- He likes this ratio to be 3 or lower.
- Again, property, pubs and utility companies would have higher values.
Debt to assets
debt to assets = total borrowings / total assets
Phil likens this ratio to the loan-to-value measure on a house – it tells you what percentage of a company’s assets is made up of debt.
- Phil likes this number to be less than 50%.
- Banks normally have a 90% debt to assets ratio, which is why Phil doesn’t like them.
Domino’s ratio for 2015 was £12.4M / £185.4M = 6.7%.
Interest cover
interest cover = EBIT / interest payable
Interest cover tells us how much bigger the trading profits are than the interest that is due on the debt.
Phil likes this number to be 10 or more, but he insists on a ratio of at least five.
- That gives him a 40% margin of safety before the ratio hits 3, which is where he really starts to worry.
- As usual, utility companies and property companies with high levels of debt are the exception.
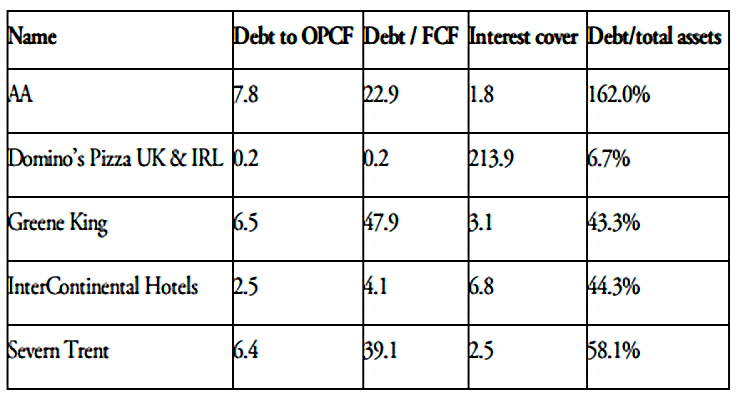
From the table above, Phil likes only Domino’s and InterContinental Hotels.
- The AA has too much debt (is too risky).
- Greene King will be forced to spend money on refurbishing pubs, which keeps FCF low.
- Severn Trent will have its ROCE capped by regulators.
Types of debt
In the next section, Phil looks at the breakdown of debt in the Imperial Brands accounts.
- It’s a forty-row table.
The key distinctions are:
- bank borrowing vs market borrowing (bonds)
- fixed interest vs floating rate (Phil prefers fixed)
- which currency is the debt it?
- Foreign currencies should be matched to assets and / or profits.
- repayment date (maturity)
- Phil likes to forecast whether debt that is about to mature will be replaced with cheaper or more expensive debt.
- He also likes to see an even schedule of maturities, without large amounts of debt needing to be replaced at once.
High debt can be OK
Phil uses funeral parlour Dignity as an example of a company with stable and predictable profits and cash flows that can support large amounts of debt.
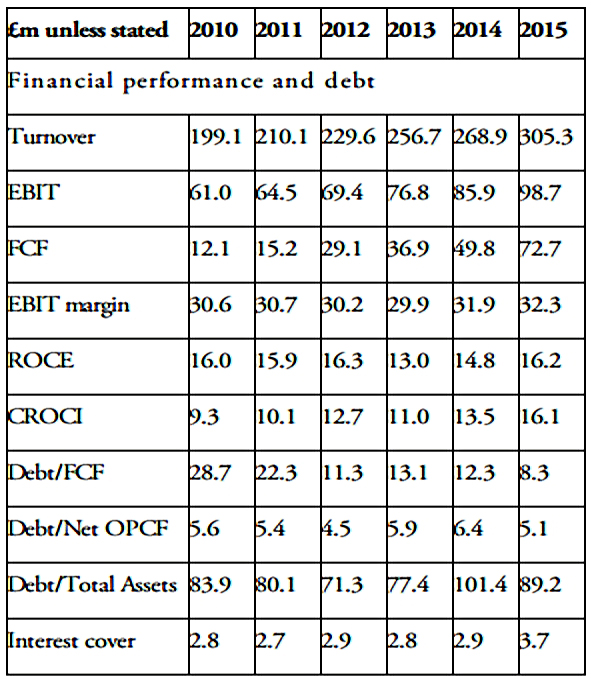
Though it has a lot of debt (high debt to assets, low interest cover) it has also grown sales, profits and FCF.
- It also has good EBIT margins and ROCE and CROCI.
Financial engineering
To illustrate how debt can fool you, Phil introduces Bob’s Book Shop.
- It makes £100M in EBIT each year and has no debt.
- ROCE is only 10% and ROE (post-tax) is 8%.
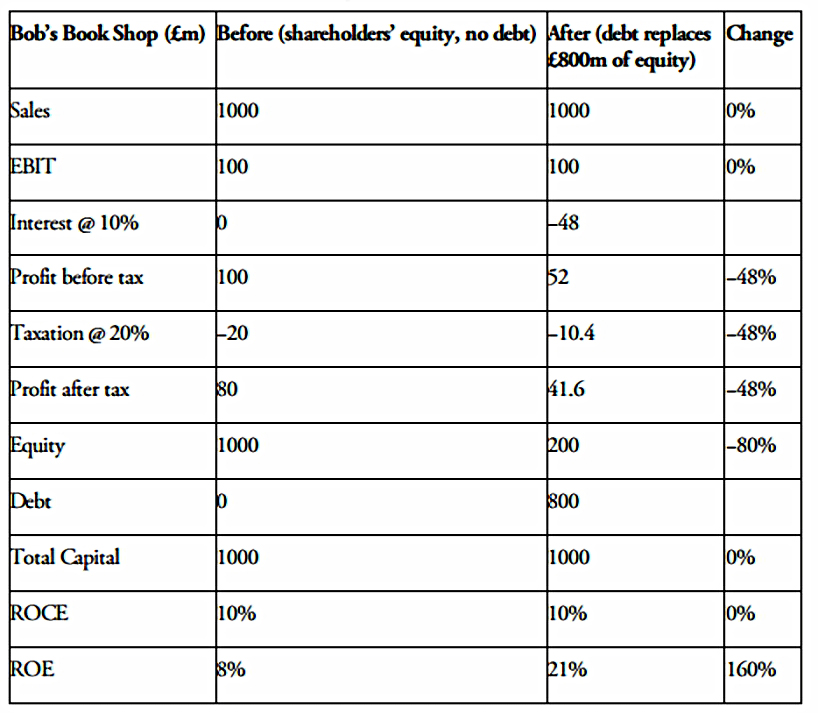
Then a banker persuades Bob to replace £800M of equity with debt at 6% pa.
ROCE does not change, but ROE is up to 21%.
- This is despite profits falling from £100M to £48M, and profit after tax falling from £80M to 41.6M.
So long as the percentage fall in post-tax profits caused by the new interest payments (less the tax saved) is smaller than the percentage of shareholders’ equity that has beeen replaced by debt, ROE will rise.
- Phil prefers ROCE to ROE for this reason.
It’s also worth noting that the company is now in quite a risky situation:
- interest cover is only 2.1, and debt now constitutes 80% of assets (total capital).
Hidden debts
What Phil means by hidden debts are mainly leases, where assets are rented rather than owned.
- This keeps the debt off the company’s balance sheet.
It’s particularly important with airlines, railways and retail firms (shops, not online retailers).
- Phil uses Domino’s as an example.
Domino’s has two choices when opening a new shop:
- buy (from cash reserves or by borrowing money)
- rent
If it buys, the balance sheet shows an asset (the new shop) and a liability (the debt used to buy it).
- The income statement shows an expense to depreciate the asset over its useful life and the cost of the interest on the new debt.
- Free cash flow is reduced by the money used to build / buy the new asset.
If it rents instead, there’s just an expense in the income statement.
- There’s no impact on the balance sheet, and the hit to cash flow is just the one year’s rent.
- But the company may have committed to a 10-year or even 20-year lease.
Some people think that the store asset and the liability of future rents for 20 years should appear on the balance sheet.
- Phil points out that not doing this overstates the ROCE (a number he likes) by not including the future rents in the capital of the firm.
- You can find the lease commitments in the notes to the accounts, and Phil likes to add them back.
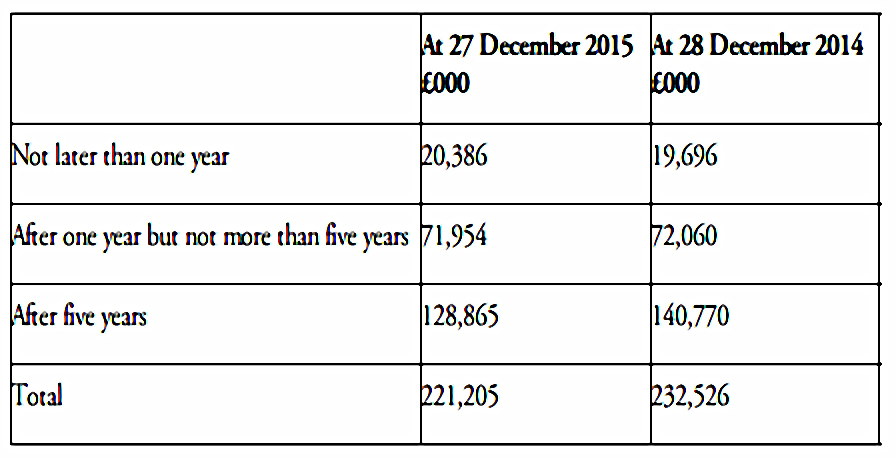
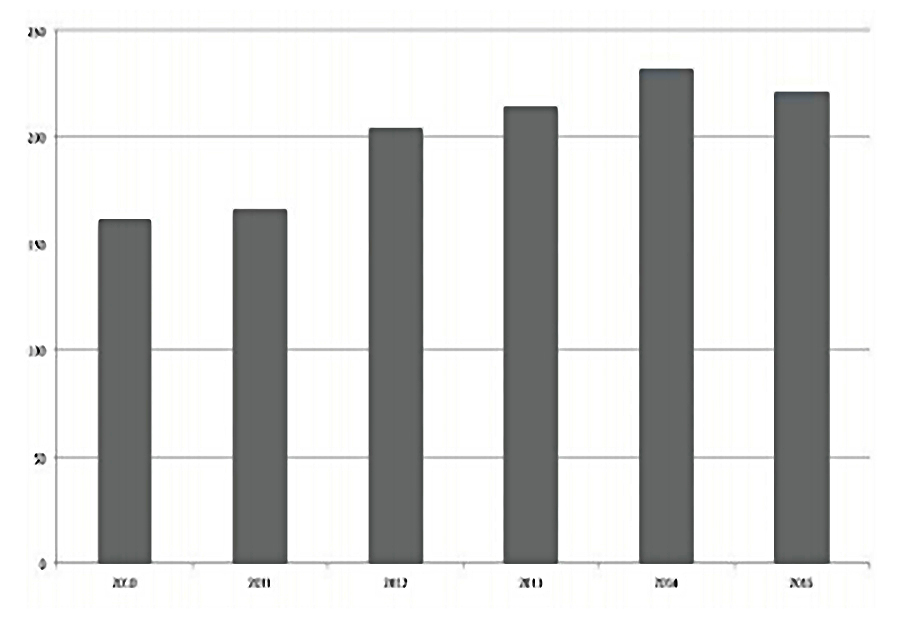
Domino’s has £221M of future rent commitments, and the number has been growing recently.
Analysing rents
Phil has two checks for firms with lots of rental commitments:
- Work out the fixed charge cover.
- How many times can trading profits pay the interest on borrowings plus the rents?
- Capitalise the value of leases.
- Then you can calculate an adjusted ROCE.
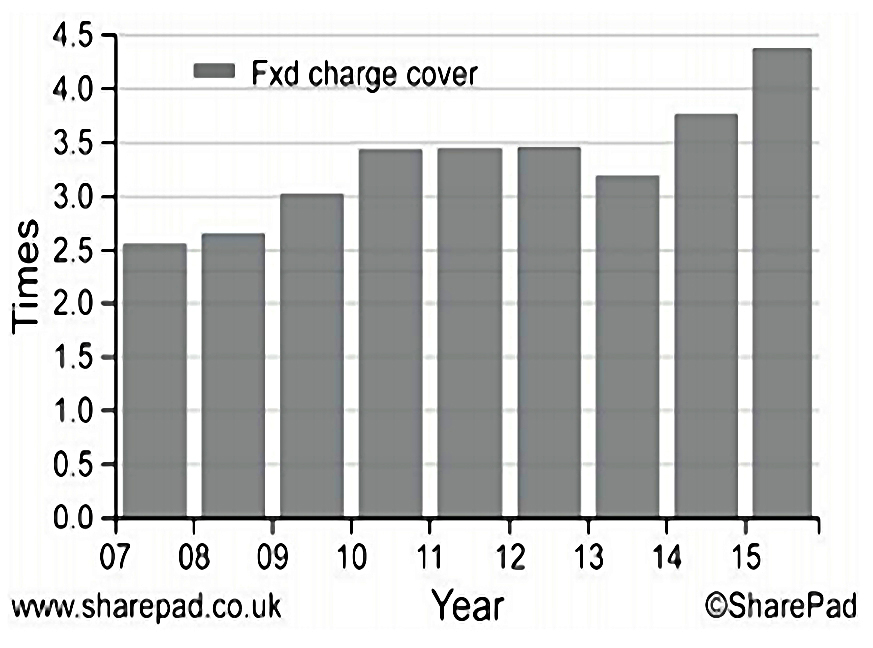
fixed charge cover = (EBIT + lease expense)/(net interest + lease)
Domino’s calculation was: (73.6 + 21.3)/(0.02 + 21.3) = 4.5 times
Phil likes this number.
- A range of 1.5 to 2 is common for retailers.
- Domino’s number is better because it mostly operates franchises, which means that the buildings it rents are sub-let to its franchisees.
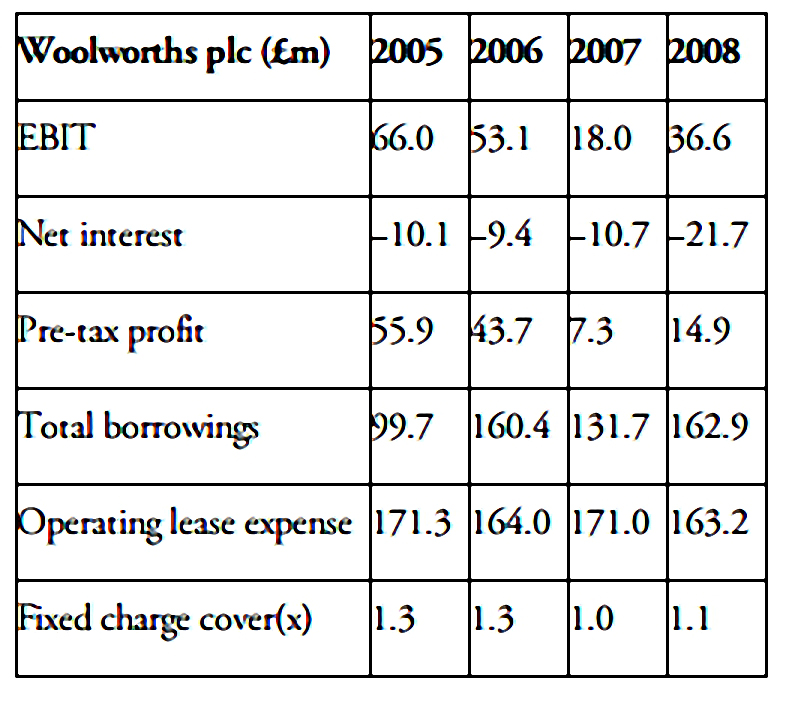
Phil would not accept a number below 1.3
- He says that attention to this number would have identified problems at HMV, Game Group and Woolworths.
- These companies didn’t have a lot of debt on their balance sheets, but were crippled by rental agreements when profits started to fall.
Phil describes two ways of capitalising operating leases (that is, working out what the future liability might be in today’s money):
- Discount the future lease commitments using an interest rate similar to that paid on existing borrowings.
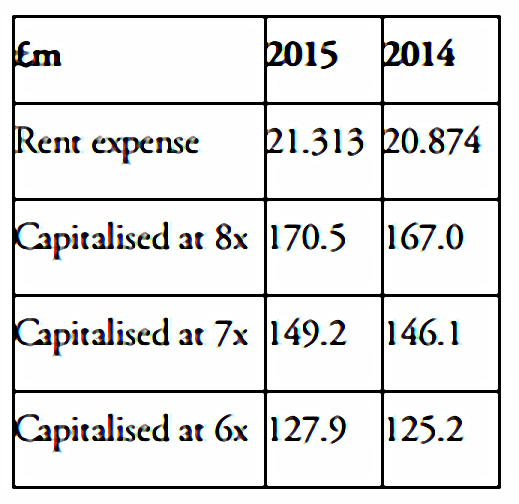
- Multiply the annual rental expense by between 6 and 8 – a rule of thumb that Phil uses.
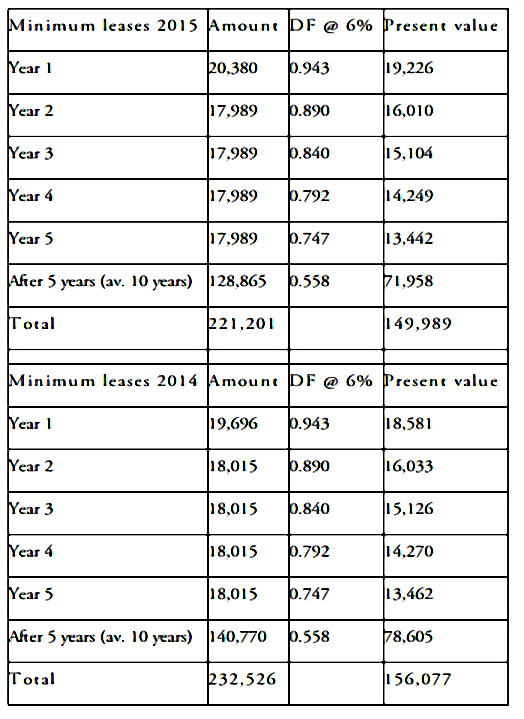
Using a 6% discount rate, Domino’s hidden debt is around £150M, down from £156M in 2014.

The annual rental expense was £21.3M, which multiplied by 8 gives £170.5M, somewhat higher than the discounted value.
- Using a multiplier of 7 would have been pretty close, though.
Domino’s hidden debts have been growing as the company has opened up more Pizza shops.
Lease-adjusted ROCE
In the next section, Phil revisits lease-adjusted ROCE, which we covered in the first article on his book.
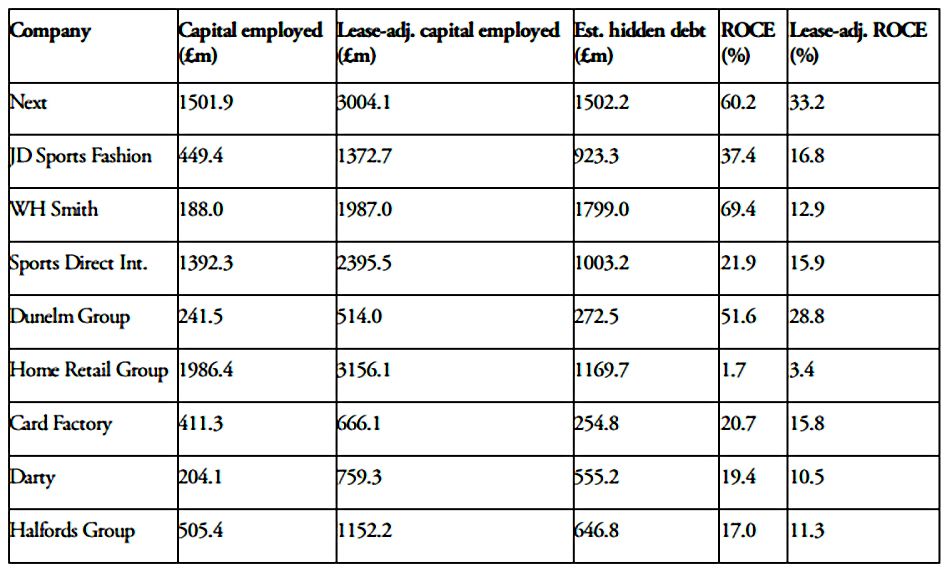
Next still looks good, but WH Smith has a big fall in ROCE.
Phil looks for:
- A minimum lease-adjusted ROCE of 15%.
- A minimum fixed charge cover of a 2.
Sale and leasebacks
Phil reminds us that the sale of properties to real estate funds – followed by renting the sold properties instead – was a big warning sign in the case of Tesco.
- Tesco used the cash this generated to pay dividends and invest in its stores.
- It didn’t have the underlying free cash flow to do this.
Pension fund deficits
We’ve written several times before about company pension deficits (start here) so I will attempt to keep this section as brief as possible.
Phil’s basic point is that shareholders are last in the queue for the profits and cashflows of a company.
- Not only are banks and bondholders in front of them, but so are pensioners (or to be precise, the company’s pension scheme).
For various reasons (poor returns, the effect of low interest rates on calculations of future liabilities, over-promising to previous employees) many defined benefit pension schemes are in deficit.
- They don’t have enough assets to be able to say they will meet their future liabilities, even though in many cases they were closed to new employees years ago.
So it’s likely that more assets will need to be transferred into the pension fund in the future.
- This could lead to future dividend cuts, or even to bankruptcy.
Effectively, a pension fund deficit is another debt, albeit one that is sensitive to several variables and can change from year to year.
- So you should try to avoid investing in companies with large (defined benefit) pension fund deficits.
Phil uses BT as an example.
- In March 2015, BT’s pension deficit was £7.6 bn, a significant proportion of the total balance sheet value of £19.5 bn.
- There is a tax break of £1.5 bn (20%) on future payments to make up that shortfall, so the net deficit is £6.1 bn.
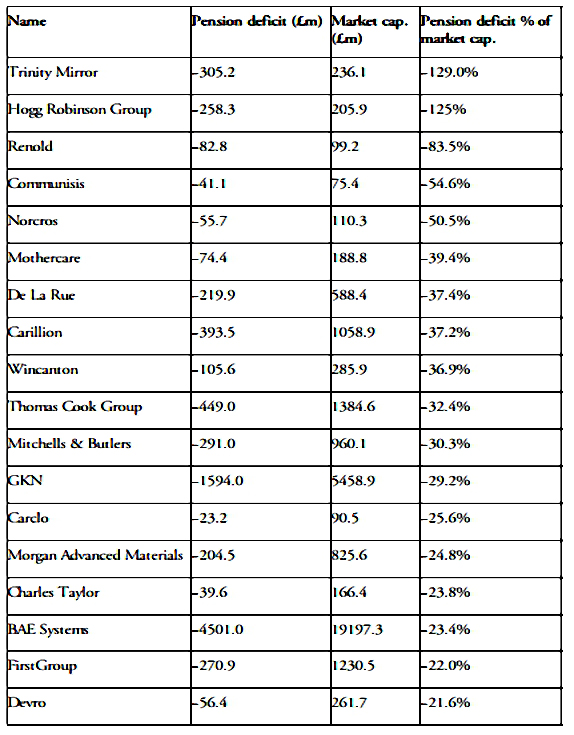
Phil would like to see the pension deficit be less than 10% of market cap.
Factors affecting deficits
To work out the present value of future liabilities, actuaries make assumptions about:
- The rate of increases in workers’ salaries between now and their retirement date.
- When the workers will retire.
- What proportion of their final salary they will be paid at that point.
- How long they will live (and receive the pension) after they retire.
- The rate of inflation (pensions are usually linked to RPI).
- A discount rate based on the yield of “good quality” bonds.
So falling interest rates (as per the last 30 years) are bad news for pension deficits.
- But when (if?) rates eventually rise, then pension deficits will shrink.
There can be effects from pension funds on the income statement and the cash flows, and Phil explains these in some detail, again using BT as the example.
- He also discusses recovery plans, which are future commitments from the company to close the gap between pension assets and liabilities.
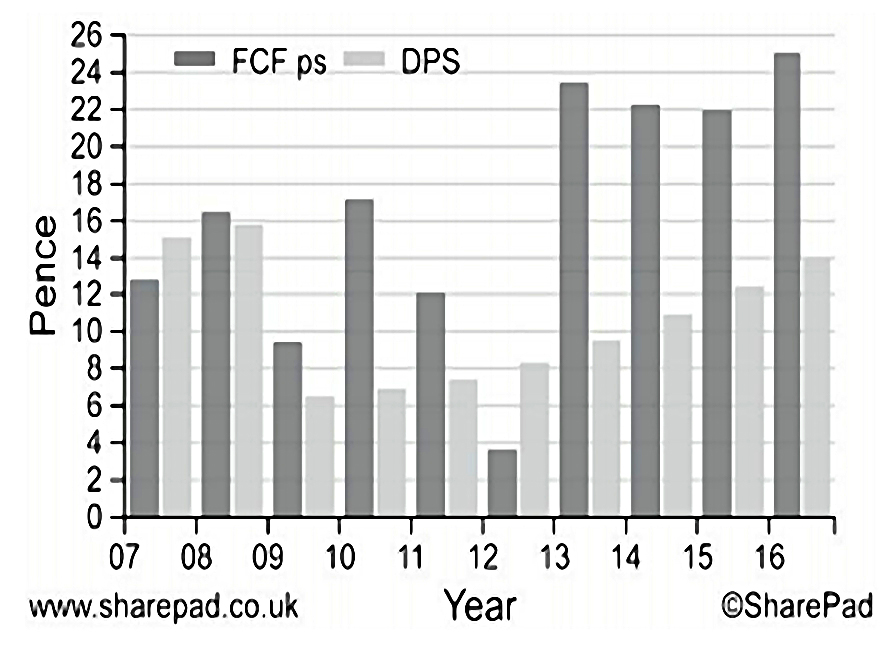
Phil likes to see that FCF per share remains significantly higher than dividends, despite any extra pension contributions.
- This has been the case with BT.
Pension fund questions
Phil suggests the following analysis:
- Is there enough free cash flow to plug the hole in the pension fund and still pay dividends?
- Divide the deficit by ten – this is the target annual top-up payment. Is the firm actually paying this much?
- If a company is paying less than this, remember to reduce free cash flow by the missing amount and compare what’s left with the dividend.
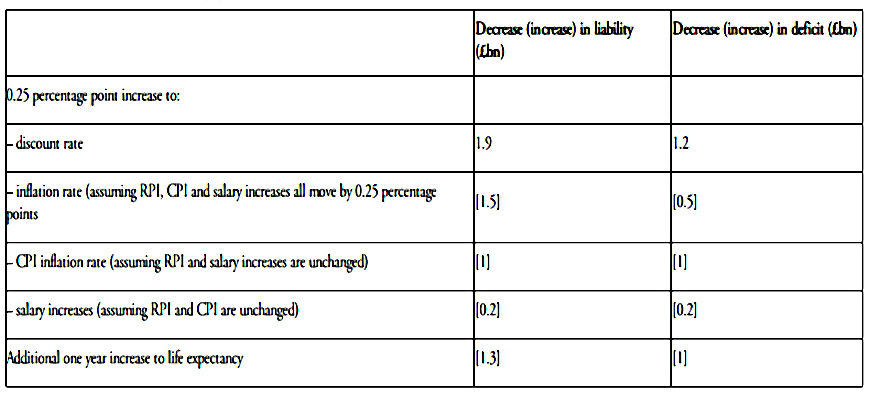
- Look at the sensitivities to interest rates, inflation and life expectancy
Conclusions
Phil closes Part 2 of the book with a list of things to look for so that you can avoid dangerous companies:
- Debt to net operating cash flow of less than 3 times.
- Debt to free cash flow of less than 10 times.
- Debt to total assets of less than 50%.
- Interest cover more than 5 times.
- Fixed charge cover more than 2 times.
- Pension fund deficit less than 10% of market capitalisation
- Interest rates on debts fixed rather than floating.
- Avoid large amounts of debt repayable in one year or less.
That’s it for today.
- We’re about three quarters of the way through the book now.
I’ll be back in a few weeks with the final section, which is on valuation.
Until next time.
Mike Rawson
Mike is the owner of 7 Circles, and a private investor living in London. He has been managing his own money for 40 years, with some success.