Stamps and Coins 2 — more detail on costs

Today we dig into the detail of the costs of operating a stamp and coin portfolio.
Contents
A recap from last week
Last week we looked at stamps and coins as an asset class, and at the product offerings from Stanley Gibbons (SG).
We concluded that:
- stamps and coins could be a viable asset class for the UK private investor
- a £25K or larger stamps and coins portfolio is needed for diversification
- this implies a minimum overall portfolio size of £250K to £500K (5% to 10% weighting)
- none of the SG products are really suitable for this size of investment
- costs are very high
I left myself with quite an action list to take forward, but the most important on that list was costs. Top down estimates of annual charges were in the 4% to 6% range, which is scary. So I decided to do a bit more digging.
SG products and charges
The SG charging mechanism is quite simple. There are no ongoing charges, and you share the profits when you sell. The proportion of profits that SG receive varies from 70% to 20% depending on the holding period and which of their products you are using.
The key to understanding the impact of this kind of charging is that what you pay depends greatly on the growth rates you achieve. In particular, if you do well, the charges can be very high.
SG have four products:
- Flexible Trading Portfolio (FTP), which we ruled out because it is stamps only, and SG choose the stamps
- Capital Growth Plan (CGP), which we ruled out because its has a fixed duration (5 or 10 years) which risks selling at a bad point in the market, and also because SG choose the stamps and coins
- Portfolio Builder (PB), which has a minimum investment of £13K over 10 years and a very high SG profit share of 50%
- Premium Portfolio Builder (PPB), which has a minimum investment of £70K over 10 years and a high SG profit share of 30%
We also came up with our own “ideal”product which we felt that SG ought to offer:
- stamps and coins in the portfolio, chosen by the investor
- phased investment over 5 years, minimum £5K per year
- investor chooses when to sell
- 1% annual charge on cost price to cover insurance and storage
- SG commission of only 10% on profits from sales
Today we’ll look at what the costs for PB, PPB and our ideal product look like in detail, and compare them to the holding costs of similar-sized ETF portfolios. ((There are obviously plenty of “black box” spreadsheet and financial calculator functions that will work out portfolio returns and the effect of charges upon them. I thought it might be more useful to build year-by-year spreadsheet models using only arithmetic.)) ((I should also point out that I had flu when I built the spreadsheets, and so it’s more than likely that they contain human errors. Please point them out if you spot any, and I hope they don’t materially affect the results of the analysis.))
The scenarios
We have 12 scenarios to examine:
- two sizes of portfolio (£25K for PB and £70K for PPB)
- two growth rates (5% pa and 10% pa)
- three product types (PB/PPB, “ideal” and ETF)
We’ll look at them in six pairs, using 5% and 10% growth rates at the same time.
£25K PB portfolio
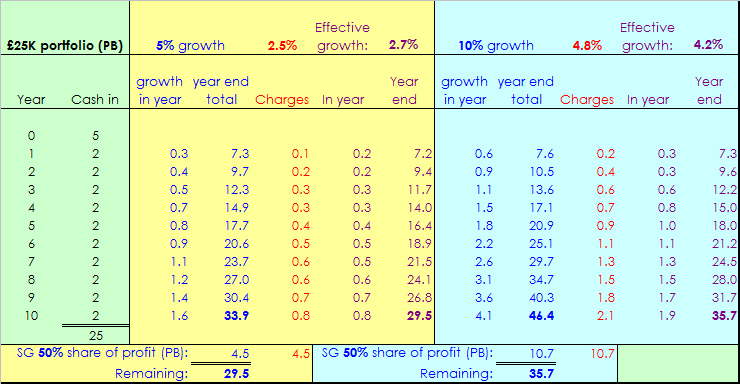
We’ll examine this one in detail, as all six spreadsheets are laid out in the same way:
- the first two columns with the green background show the cash that is added to the portfolio year by year
- the next five columns with the yellow background look at portfolio growth of 5% pa
- the two columns in blue “ink” show the growth of the portfolio; the SG share of the profits is deducted at the bottom
- the column in red ink shows the equivalent annual charges that total to the same amount as the SG deduction; the figure at the top of the column is the percentage deducted each year
- the two columns in purple ink work out what annual growth rate is needed to reach the portfolio value that is left to the investor after charges have been deducted; the figure at the top of the column is the growth rate needed each year
- the final five columns with the blue background simply repeat the analysis from the 5% pa growth scenario under 10% pa growth
For this portfolio, the results are:
- the £25K investment over 10 years grows to £33.9K at 5% growth
- SG fees of £4.5K are deducted
- this is the equivalent of an annual fee of 2.5% each year
- net proceeds to the investor are £29.5K
- annual growth of 2.7% would be needed to achieve this result with no charges
- the £25K investment over 10 years grows to £46.4K at 10% growth
- SG fees of £10.7K are deducted
- this is the equivalent of an annual fee of 4.8% each year
- net proceeds to the investor are £35.7K
- annual growth of 4.2% would be needed to achieve this result with no charges
The impact of fees on the effective growth rate is 46% under 5% pa growth, and 58% under 10% pa growth.
£70K PPB portfolio
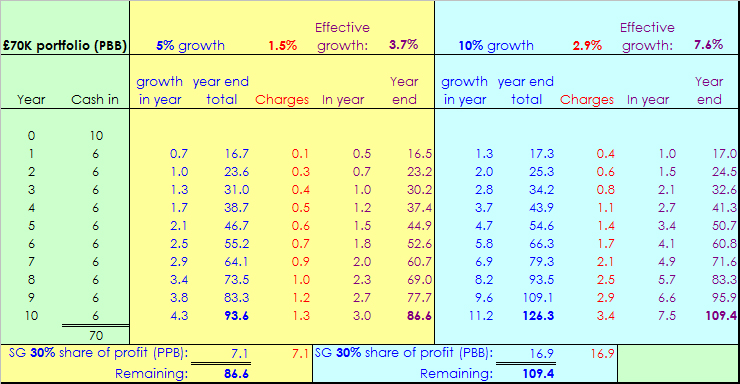
For this portfolio, the results are:
- the £70K investment over 10 years grows to £93.6K at 5% growth
- SG fees of £7.1K are deducted
- this is the equivalent of an annual fee of 1.5% each year
- net proceeds to the investor are £86.6K
- annual growth of 3.7% would be needed to achieve this result with no charges
- the £70K investment over 10 years grows to £126.3K at 10% growth
- SG fees of £16.9K are deducted
- this is the equivalent of an annual fee of 2.9% each year
- net proceeds to the investor are £109.4K
- annual growth of 7.6% would be needed to achieve this result with no charges
The impact of fees on the effective growth rate is 26% under 5% pa growth, and 24% under 10% pa growth.
£25K “ideal” portfolio
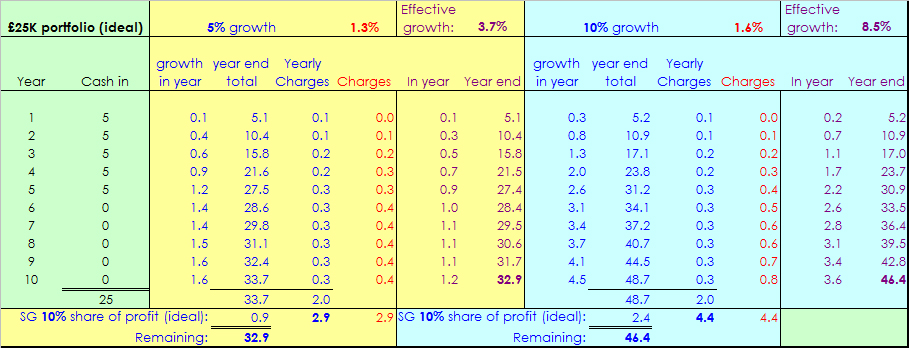
For this portfolio, the results are:
- the £25K investment over 10 years grows to £33.7K at 5% growth
- “SG” fees of £2.9K are deducted
- this is the equivalent of an annual fee of 1.3% each year
- net proceeds to the investor are £32.9K
- annual growth of 3.7% would be needed to achieve this result with no charges
- the £25K investment over 10 years grows to £48.7K at 10% growth
- “SG” fees of £4.4K are deducted
- this is the equivalent of an annual fee of 1.6% each year
- net proceeds to the investor are £46.4K
- annual growth of 8.5% would be needed to achieve this result with no charges
The impact of fees on the effective growth rate is 26%% under 5% pa growth, and 15% under 10% pa growth.
£70K “ideal” portfolio
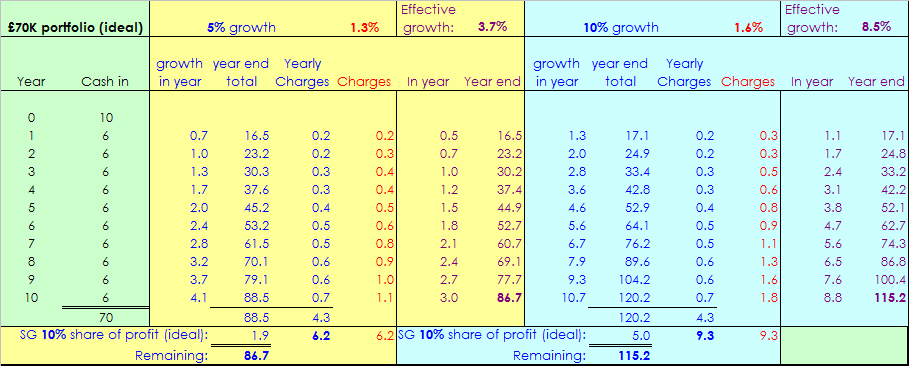
For this portfolio, the results are:
- the £70K investment over 10 years grows to £88.5K at 5% growth
- “SG” fees of £6.2K are deducted
- this is the equivalent of an annual fee of 1.3% each year
- net proceeds to the investor are £86.7K
- annual growth of 3.7% would be needed to achieve this result with no charges
- the £70K investment over 10 years grows to £120.2K at 10% growth
- “SG” fees of £9.3K are deducted
- this is the equivalent of an annual fee of 1.6% each year
- net proceeds to the investor are £115.2K
- annual growth of 8.5% would be needed to achieve this result with no charges
The impact of fees on the effective growth rate is 26% under 5% pa growth, and 15% under 10% pa growth.
£25K ETF portfolio
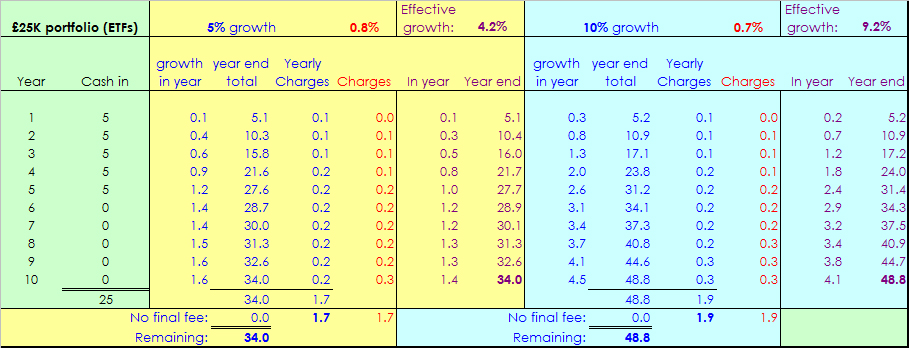
The ETF portfolios are modelled on a YouInvest SIPP, which charges £10 per deal and has annual charges as follows:
- £20 on portfolios under £10K
- £60 from £10 to £20K
- £100 over £20K
An iWeb ISA would be even cheaper, as trades are £5 and there is no annual charge. Average charges within the ETFs themselves have been set at 0.33% pa, as per our current 7 Circles ETF portfolio. Using UK stocks instead would avoid this charge, but not provide diversification.
For this portfolio, the results are:
- the £25K investment over 10 years grows to £34K at 5% growth
- fees of £1.7K are deducted
- this is the equivalent of an annual fee of 0.8% each year
- net proceeds to the investor are £34K
- annual growth of 4.2% would be needed to achieve this result with no charges
- the £25K investment over 10 years grows to £48.8K at 10% growth
- fees of £1.9K are deducted
- this is the equivalent of an annual fee of 0.7% each year
- net proceeds to the investor are £48.8K
- annual growth of 9.2% would be needed to achieve this result with no charges
The impact of fees on the effective growth rate is 16% under 5% pa growth, and 8% under 10% pa growth.
£70K ETF portfolio

For this portfolio, the results are:
- the £70K investment over 10 years grows to £90.1K at 5% growth
- fees of £3.0K are deducted
- this is the equivalent of an annual fee of 0.6% each year
- net proceeds to the investor are £90.1K
- annual growth of 4.3% would be needed to achieve this result with no charges
- the £70K investment over 10 years grows to £121.5K at 10% growth
- fees of £3.4K are deducted
- this is the equivalent of an annual fee of 0.6% each year
- net proceeds to the investor are £121.5K
- annual growth of 9.4% would be needed to achieve this result with no charges
The impact of fees on the effective growth rate is 14% under 5% pa growth, and 6% under 10% pa growth.
Summary and conclusions
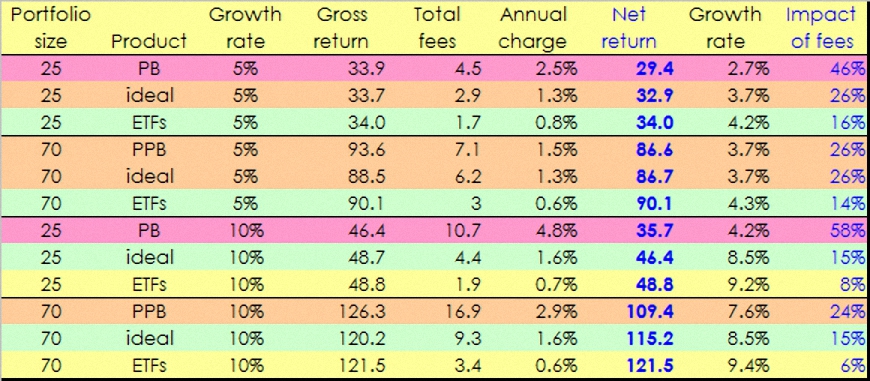
- 25K portfolio, 5% growth
- the SG product is prohibitively expensive (46% of growth lost in fees)
- the “ideal” stamp portfolio remains expensive (26%)
- ETFs are competitive (16%)
- 25K portfolio, 10% growth
- the SG product remain prohibitively expensive (58%)
- the “ideal” stamp portfolio is now competitive (15%)
- ETFs are cheap (8%)
- 70K portfolio, 5% growth
- the SG product is expensive (26%)
- the “ideal” stamp portfolio is expensive (26%)
- ETFs are competitive (14%)
- 70K portfolio, 10% growth
- the SG product remains expensive (24%)
- the “ideal” stamp portfolio is now competitive (15%)
- ETFs are cheap (6%)
As we suspected, the current offerings from SG are too expensive at both portfolio sizes, and at both growth rates. Our “ideal” stamp and coins portfolio – even if it existed – would remain too expensive when growth is low (5%) but would be reasonable to consider under 10% growth at both sizes of portfolio. Unfortunately, future growth is always unknown.
ETFs are competitive across the board for medium to long holding periods. At higher growth rates they become even more of a bargain.
I guess our investment in stamps and coins will have to wait until somebody comes out with an ETF. In the meantime Stanley Gibbons itself (LON:SGI) can be used as a proxy for the stamps and coins market, along with Avarae Global Coins (LON:AVR).
Until next time.
Mike Rawson
Mike is the owner of 7 Circles, and a private investor living in London. He has been managing his own money for 40 years, with some success.