The Bonkers Portfolio – Momentum made easy

Today we’re going to look at a strategy that I mentioned in a tweet a few months ago. It’s called the Bonkers Portfolio, for reasons that will become clear.
Contents
The Bonkers Portfolio
My plan for 2016 was to start two portfolios:
- a dividend /income portfolio (for which the research has begun) and
- a long / short momentum portfolio using multiple asset classes and spread-betting.
Getting the cash together to open the spread betting account is taking longer than I hoped.
- almost all of my money is already in tax-sheltered accounts (ISAs and SIPPs) and
- the final quarter of the tax year means that I also have to make sure that I use up this year’s allowances.
- so the spread betting will take a few more weeks to get going.
In the meantime, here’s another momentum portfolio that can be implemented without spread-betting.
Mad profits
The name isn’t mine – it comes from Fund Expert.
- The basic principle is that you buy the funds and stocks that have performed the best over a particular period in the past, on the basis that they are the most likely to perform well over the same period in the future.
There’s lots of evidence to support momentum as a factor in outperformance. and the guys over at Fund Expert are big fans.
- The Bonkers Portfolio takes their “Dynamic approach” to extremes.
It buys a single fund each period.
- The best-performing fund from all that are available (with a size greater than £50M), regardless of how esoteric, or how narrow its brief.
That’s why they call it the Bonkers portfolio.
Performance
Before we look at how we might implement our own version of the Bonkers Portfolio (BP), let’s see how the Fund Expert version has performed.
- They used a 6-month look-back period, and started their test in September 1995.
- They switched funds every 6 months.
Over 20 years, this strategy returned 3,084%.
- That’s 12 times the performance of the average UK All Companies fund (up 254%).
So an initial £10K would have turned into £318K, and £1K a month (£240K over the 20 years) would have become £1.69M.
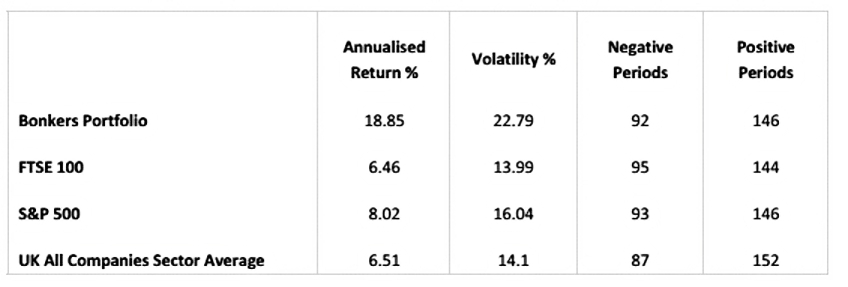
- The annualised return was 18.9%, compared to 6.5% for the average UK growth fund.
On the downside, the BP is more volatile, though the number of down periods (months) are roughly similar.
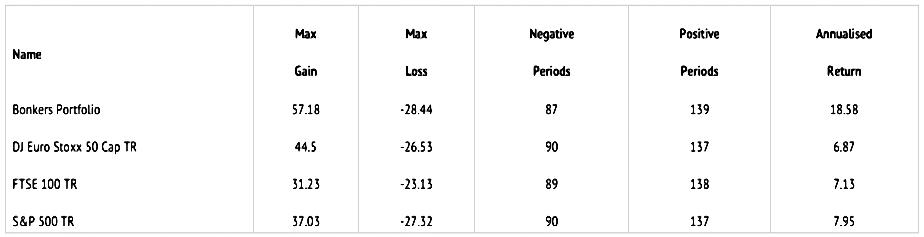
- The maximum monthly gain is higher for the BP than for any of the comparative indices, but the maximum monthly loss is similar to the indices.
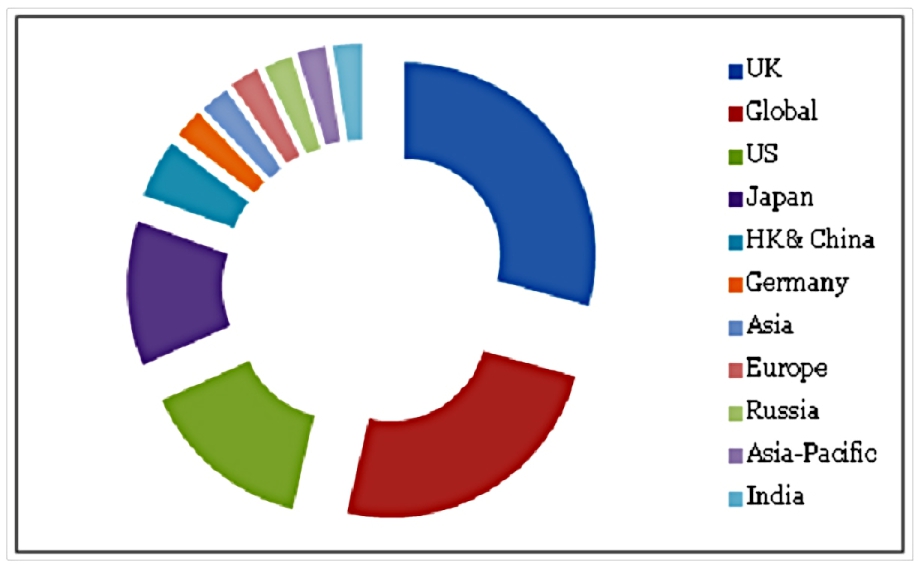
For most of the time (53%) the fund was invested in UK or Global funds.
- The US and Japan came next.
- UK smaller companies were the majority of the UK funds.
- Biotech and Gold were also over-represented.
- Single country funds such as Russia and India were also popular.
This is clearly a great result, and the guys at Fund Expert put it down to the discipline of applying a clear process at regular intervals.
- Despite the higher risk of the approach, the longer you stick with it, the higher your chance of outperformance.

Changes
So what might we change in order to implement something like this for ourselves?
There are four areas to look at:
- it’s just one fund, hence very volatile
- the six-month review period is too long to be very interesting for readers of a blog
- it also means that we might be stuck in a falling fund for quite a while
- examining the track record of several thousand funds in order to make our selections will not be easy
Holding period
A one-month holding period would work best for the purposes of the blog.
This has the advantage that it will get us out of losing positions quickly, but there are two disadvantages:
- volatility might well go up
- trading fees could be significant
So we need to look for products with no or low dealing costs, and we need to think about investing in more than one fund / stock to damp down the volatility a little.
Number of funds
My instinct is to use a pyramid structure.
- The fund with the best performance would be more heavily weighted than the second-best fund, and so on.
Four funds make a natural pyramid, with the best fund weighted at 40%, the second best at 30%, the third best at 20% and the fourth best at 10%.
- So let’s use four funds each month.
Fund universe
The cheapest way to implement this would be to use funds on a supermarket platform, where switches are free and executed at a mid-price.
- There is a delay in the execution, so we would need a spare cash pool to make them immediate.
- This will be simple enough when the portfolio is at trial size, but will be increasingly problematic as the fund grows (assuming the strategy is successful).
The other problem with using funds is tracking performance.
- we’ll need to investigate automatic performance tracking,
- but if this is not available we’ll need to restrict the universe of funds to make monthly performance analysis manageable.
Let’s aim for around 16 funds (since we will be selecting four), spread across assets and geographies.
FTSE-100
An alternative way of implementing this strategy would be to use the FTSE-100:
- automatic performance monitoring of a large number of stocks would be simple
- these stocks are liquid, with small spreads
But there are trading commissions, so perhaps it would be better to use a longer holding period in order to reduce them.
- So let’s start with a three-month period.
Absolute strength or relative strength
Normally when selecting momentum stocks, we would look at price performance relative to an index – that is, relative strength. ((Not to be confused with the RSI relative strength oscillator, which is a short-term indicator ))
But here, all the stocks would be compared to the same index – indeed, they are the index – so I would expect the results not to be affected by adding relative strength into the mix.
So we’ll stick regular price momentum for now.
AIM-100
We could also use the same approach as with the FTSE-100 on the largest AIM stocks, to take advantage of the greater volatility at this end of the market:
- automatic performance monitoring should again be straightforward
- these stocks are illiquid, with potentially large spreads
- this cost will be offset slightly by the lack of stamp duty on AIM stocks
We’ll use the same three-month holding period as for the FTSE-100.
ETFs
We could copy the funds strategy with ETFs, but this would add trading costs, so for now we’ll try to use funds.
There’s also a specialist momentum ETF – iShares MSCI World Momentum Factor – LSE:IWFM – that we can use as a watered-down version of this strategy.
- This tracks the MSCI World Momentum index – the 30% of stocks in the MSCI World with the strongest price momentum.
We won’t need a holding period here – we can use Warren Buffett’s favourite holding period of “forever”, and just carry out monthly and quarterly performance reviews. ((For value fans, there is also the iShares MSCI World Value Factor ETF LSE:IWFV ))
Conclusions
- Back-testing a simple momentum strategy has produced promising results.
- We’re going to try to adapt this to supermarket funds, FTSE-100 stocks, AIM-100 stocks and an ETF.
- This will give us a momentum portfolio of 13 stocks (including the ETF).
- We’ll use shorter holding periods (1 month for funds and 3 months for stocks) to make the results interesting to readers of the blog.
- We’ll use a four-fund pyramid structure (40% / 30% / 20% / 10% weightings) within each sub-section of the portfolio to damp down volatility
In the next post we’ll look at the practicalities of implementing these approaches.
Until next time.
Mike Rawson
Mike is the owner of 7 Circles, and a private investor living in London. He has been managing his own money for 40 years, with some success.


Interesting and indeed a bonkers strategy (but the performance results are shocking!).
Would be interested in seeing the original article as it seems behind a paywall now.
Sam