VCT Universe 1 – The Data

Today’s post is about the VCT Universe. What information is available, and how can we use it to work out which VCTs we should be interested in, and when?
VCTs
VCTs (venture capital trusts) are a subset of investment trusts – collective investment vehicles that are listed on the London stock market.
- In exchange for restrictions in the kind of investments they can make, and the amount of money they can invest, they are granted special tax treatment.
The idea is that investors are incentivised to put money into small growing companies in which they might not otherwise invest.
The growth of these small companies is good for the UK economy, and for taxpayers as a whole.
- The main tax relief at the moment is a 30% rebate on income tax for money invested in new shares.
- You have to hold the shares for five years to retain the rebate.
You can’t reclaim any tax that you haven’t paid that year.
- And the maximum annual investment is £200K (to reclaim £60K in tax).
Dividends and capital gains are also tax-free.
- Shares bought on the secondary market are free for gains and dividends but don’t attract the up front income tax rebate.
We’ve looked at them several times before:
Types of VCT
Most VCTs invest in unlisted companies, but some VCTs focus on AIM stocks.
- There are also specialist industry VCTs:
- Entertainment / Media
- Renewable Energy / Environmental
- Healthcare / Biotech
- Technology
- There also used to be asset-rich fixed life VCTs, but these have been killed off by new restrictions in the regulations.
Me and VCTs
My relationship with VCTs has been a chequered one:
- I was a big fan until 2006 when Gordon Brown relaxed the rules on how much you could pay into your pension (SIPP).
- Back then the income tax relief on VCTs was 40%, and the ISA limit was £7K.
- I used them once I had filled up my SIPP and ISA.
- From 2006 I could just put this money directly into my SIPP.
- I held on to the VCTs I had bought before 2006, but didn’t buy any more.
- Since 2010, the pension contribution allowance has been reduced from £255K pa down to £40K pa.
- This made VCTs of interest to anyone earning more than £85K pa, but by then I had stopped working full-time.
- When I stopped working completely, I sold down my remaining VCTs to raise cash.
- By 2017 my SIPP was full and I had started to draw money out of it.
- So I started using VCTs again to offset income tax.
Why use VCTs?
There are two situations where you might want to buy a VCT:
- To lower your income tax bill (as I do).
- To receive tax free dividends (eg. in retirement).
To work out whether a purchase is a good idea, we need in both cases to look at two features of the VCT’s historic performance:
- What has happened to its share price?
- In most cases, this will amount to “what has been the rate of decline?”, since VCTs usually trade at a discount to net asset value (as with most investment trusts).
- VCTs must pay out 85% of any income they receive as dividends.
- They also pay out the majority of their gains (growth in underlying assets) as dividends.
- And their annual costs are high (usually more than 2%).
- What level of dividends have been paid out?
There’s a third condition in order to attract the income tax relief:
- The VCT in question needs to be raising new cash to invest by issuing new shares.
We can’t control this one, so we’ll focus on making sure that the other two conditions hold true.
Data sources
Data on open (current) issues of VCT shares is fairly easy to get hold of.
We covered seven sources back in 2017:
- Club Finance
- Chelsea Financial Services
- Hargreaves Lansdown
- WealthClub
- Allenbridge
- Interactive Investor
- BestInvest
All of these sites hold similar data on the latest VCT issues.
- I ended up using Wealth Club for my 2017 applications, as they have a nice website and they let you make applications online (no paperwork).
Data on the existing VCT Universe is not so easy to come by.
I have five sources of data to try:
- FE Trustnet
- Morningstar
- Google Finance
- Stockopedia
- The AIC (Association of Investment Companies)
The VCT Universe
First stop is a master list of all the existing VCTs – the VCT Universe.
- FE Trustnet had a master list of 70-odd companies.
- Morningstar had a longer list, but split into the various sub-categories (generalist, AIM, the various industry specialisms etc).
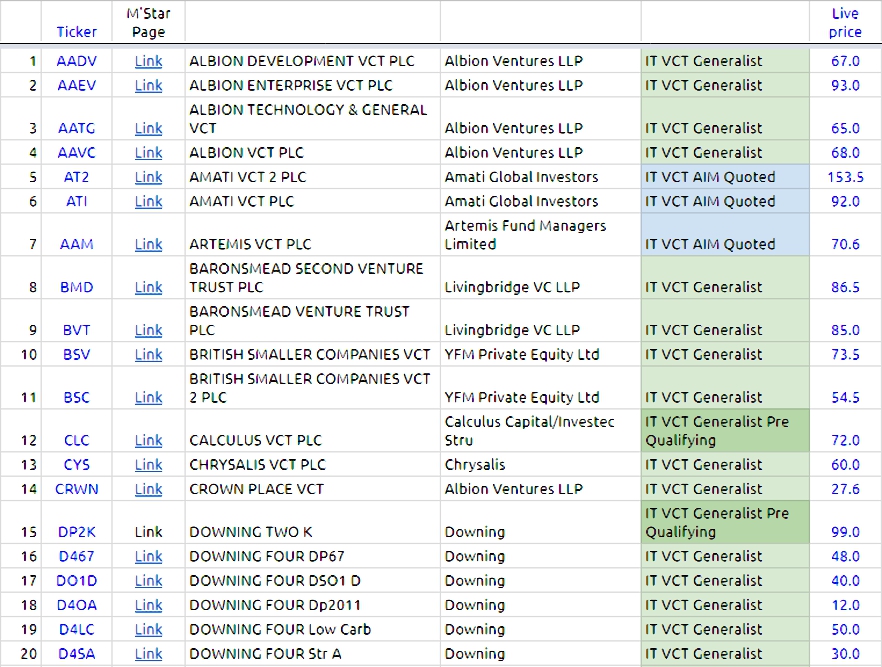
Combining the data from these two sites gave me a master list of 93 VCTs with LSE tickers.
- I used these to check for live prices using the GoogleFinance() data function.
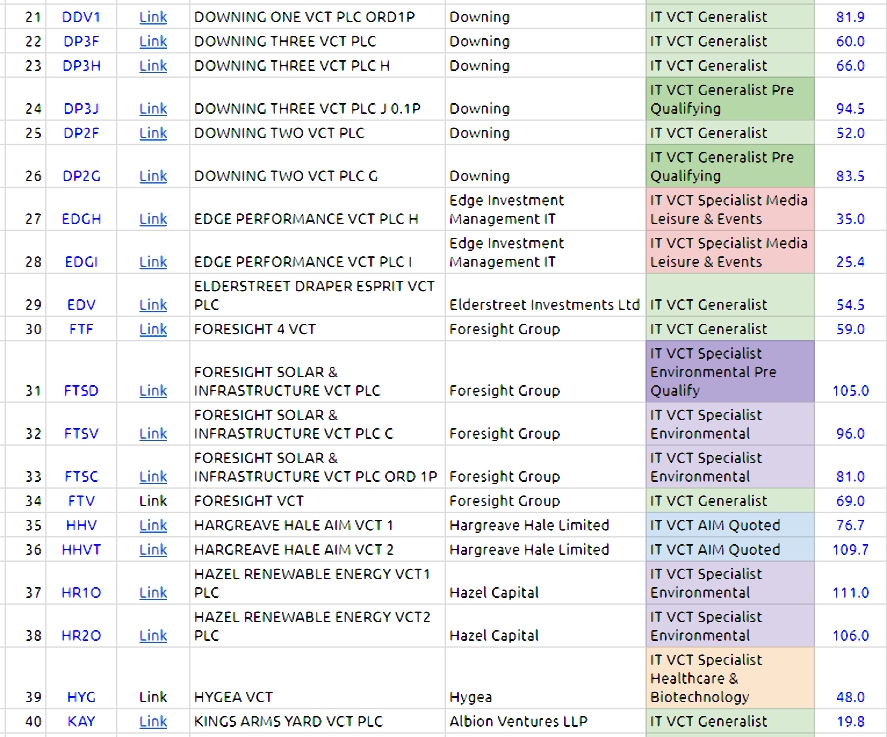
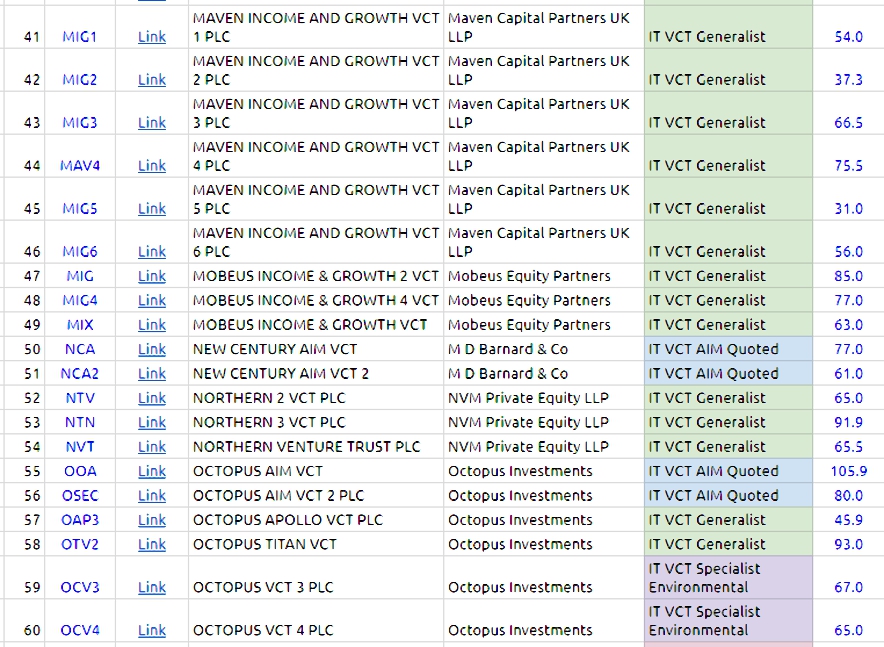
That gave me a list of 80 VCTs with live prices, which is presented below in four blocks of 20:

Next time
Let’s take a brief look ahead to what data is available for further analysis:
- Launch date (Morningstar)
- From this we can work out the age of the fund.
- If we assume a launch price of 100p, we can work out the loss (or sometimes the gain) since launch.
- We can can then work out an annual rate of loss (in the share price).
- Market cap (Google Finance)
- Not available for all stocks – what does this signify?
- Stockopedia organisation
- Stockopedia has no flag for VCT, so I’ll need to manually build a new portfolio of the 8- VCTs we found today.
- Stockopedia’s analysis tabs (sets of data points) are arranged around their core factors (Quaialty, Grow, Value, Momentum, Income etc), so I’ll need to replace one of the existing tabs with the set of relevant VCT data.
- There are no StockRank numbers available for VCTs (or other collective investments).
- Stockopedia data – the following potentially relevant items are available:
- last price
- market cap
- yield
- 5-year average yield
- dividend cover
- price to book
- beta
- price % vs 52 wk high
- price % vs 10 yr high
- 5-yr compound growth (in price)
- 1 yr price change (%)
- 3 yr price change (%)
- 5 yr price change (%)
I should be able to use these to verify our two purchase pre-requisites:
- What has happened to the share price (rate of decline)?
- What level of dividends have been paid out?
From this process, I’d like to identify:
- Perhaps 20 VCTs that would make a reasonable portfolio if they offer new shares.
- And maybe a dozen that reliably pay out a higher dividend than the FTSE All-Share without depleting their capital.
- These could be bought on the secondary market, without up-front income tax relief.
We’ll see how I got on in a couple of weeks.
Until next time.
Mike Rawson
Mike is the owner of 7 Circles, and a private investor living in London. He has been managing his own money for 40 years, with some success.