Weekly Roundup, 12th July 2016

We begin today’s Weekly roundup in the FT, with the Chart That Tells A Story. This week it was about student debt.
Contents
Student Debt
The papers are still full of Brexit and the Tory and Labour leadership elections, so this weekly bulletin is likely to be shorter than usual once more.

In the FT, Gemma Tetlow looked at student debt repayments.
- The institute for fiscal studies has modelled graduate repayments by age, based on earnings profiles.
Repayments are set at 9% of income over a certain threshold – currently £21K.
- Payments rise though a graduate’s twenties and thirties, peaking at around £1,600 at age 38.
- After 30 years (around age 52), any remaining debt is cancelled.
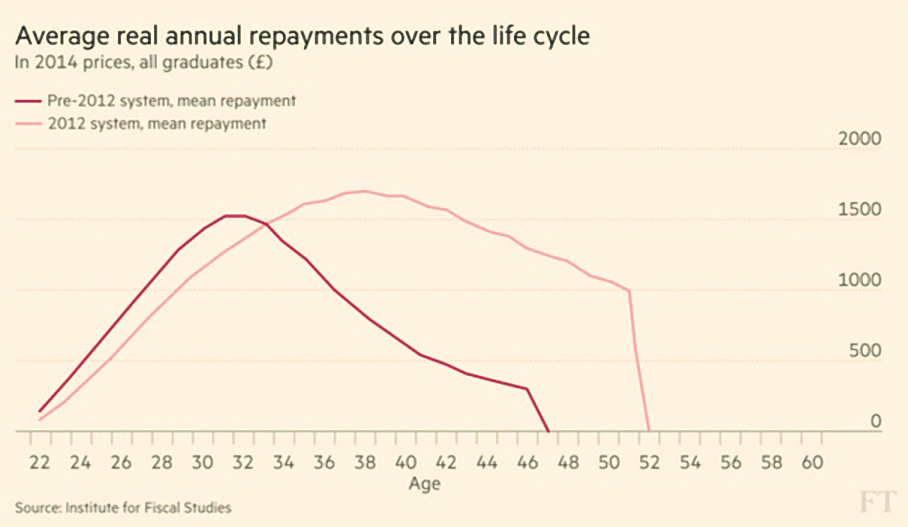
The system was reformed in 2012, when annual fees were increased from £3K to £9K.
- This meant that students graduated with a bigger debt, so the repayment threshold was increased to offset this.
- It’s clear from the chart however that graduates now pay more for longer – partly because the debt cancellation used to happen after 25 years.
- Payments are slightly lower for people in their twenties, but higher for those in their thirties and forties.
Around 70% of students will not finish their repayments, with the 9% charge acting instead as a graduate tax for 30 years.
- This in turn makes it harder for graduates to get a home loan.
Property fund redemptions
In The Economist, Buttonwood looked at the decision by nine open-ended property funds to either suspend redemptions or to apply a significant discount to them.
This shouldn’t come as a shock to anyone.
- There’s a clear mis-match between unlisted funds and illiquid underlying assets.
- When the outlook for property deteriorates, the asset manager can’t just sell an office block or a shopping centre each day to provide the cash needed for redemptions.
- Open-ended funds do hold some cash – and some liquid property shares – to help with redemptions, but with a serious inflection point in the market, as with Brexit, these are quickly over-run.
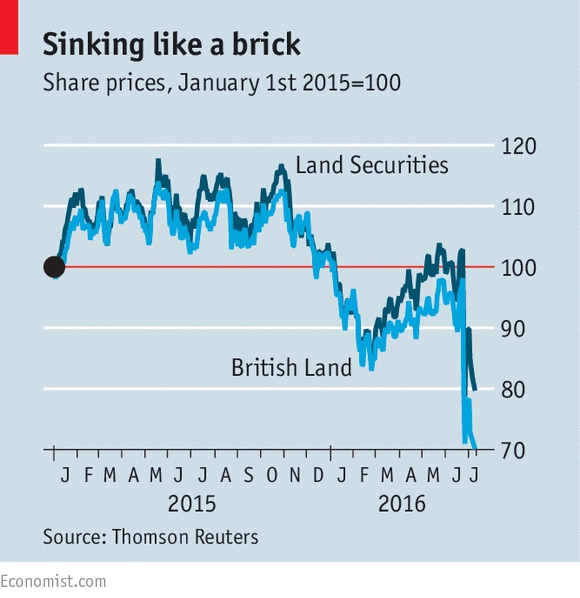
The “superior” alternative is to hold investment trusts – which in the case of property funds are called REITs.
But in that case the market applies its own haircut if you want to get out.
- See the chart of UK REIT share prices below as evidence.
- This in turn impacts the effectiveness of such shares in providing liquidity to the open-ended funds.
It looks as though the current crisis was caused in part by European investors walking away from part-completed deals.
SIPP Safety

In the wake of the collapse of European Pensions Management (EPML) – a regular attendee at the London investor shows – Natalie Stanton in Money Week looked at how safe your money is within a SIPP wrapper.
EMPL had six thousand SIPP clients, who will most likely be passed on to another SIPP provider.
- Those investors who don’t like the new provider chosen by the administrator (Smith & Williamson in this case) can transfer to another of their own choosing, though this will inevitably lead to delay.
Generally, investors are protected when their provider collapses.
- Pension assets need to be kept separate from the provider’s funds, so that they can’t be taken by creditors if the provider goes bust.
If the firm has broken the rules and mixed the money together, then the first £50K of your cash should be protected under the standard Financial Services Compensation Scheme (FSCS).
- This £50K of protection is standard for investment products – note that this is a lower limit than the £75K protected in a savings account.
- If your pension provider is an insurance company, then the pension is fully protected with no limit.
- Note however that such pensions are often less flexible and more expensive.
Non-cash assets in your pension (stocks, funds, trusts etc.) are likely to be registered in your name (via a nominee account) and should normally remain your property.
- But since things can go wrong, you might feel safer with a big-name provider, or with several pensions if you have a larger pot.
AIM stocks for Inheritance tax planning

Also in Money Week, Richard Beddard – whose day job is working as an analyst at iii – looked at using AIM stocks to avoid paying inheritance tax.
- You may remember that we did the same thing a couple of months ago – our series of four articles is here: 1, 2, 3 and 4.
Unlike our portfolio of 50 stocks, Richard chose just five:
- Brainjuicer
- Dewhurst
- FW Thorpe
- James Halstead and
- Solid State.
Of those five, only two – FW Thorpe and James Halstead – were in our list of fifty.
- Richard’s article is well worth a read, but I think I prefer our more diversified approach.
P2P default rates rise

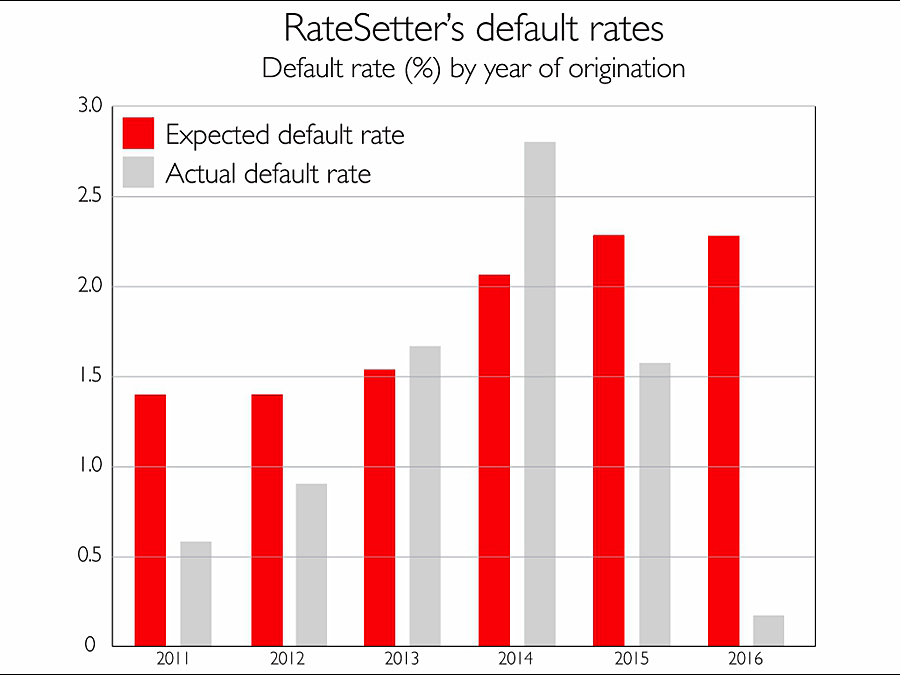
Our third article from MoneyWeek comes from Matthew Partridge, who looked at rising default rates at P2P lender RateSetter.
- Defaults have risen from 0.6% on loans made in 2011 to 2.8% on those made in 2014.
- That compares with expected default rates of 1.4% (2011) and 2.1% (2014).
- Loans last for up to five years, so defaults from 2011 onwards are likely to increase further before the loans are repaid.
Like Zopa, RateSetter puts aside a proportion of interest repayments into a “Provision Fund” to act as a buffer against defaults.
- This protection is set at 0.5% higher than the expected default rate, so for 2014 it would have been set at 2.6%.
RateSetter days that the Provision fund will cover defaults from 2014, although the calculation above suggests that it will not.
- The firm may be carrying forward unused provisions from earlier years when it states this.
The firm also claims that most defaults happen in the first year of a loan, so the 2014 rate should not increase much from here.
- Given the benign economic conditions of recent years, the worrying possibility is that the increase in defaults reflects a reduction in the quality of borrowers during a period of rapid expansion for the industry.
Taxes by city
And finally, the chart below was grabbed from my Twitter feed. ((I think it’s from the FT ))
- It shows the proportion of UK tax take provided by each city in the country.
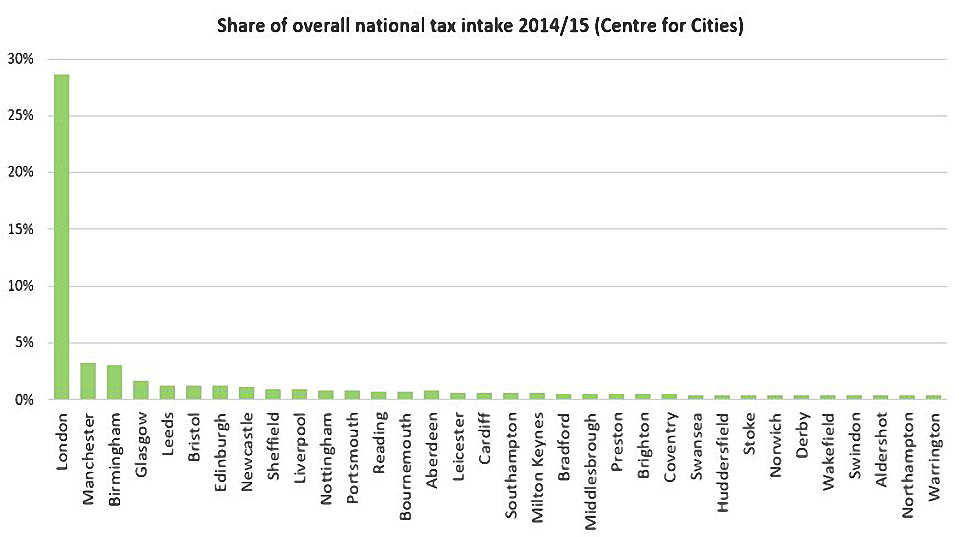
Not surprisingly, London leads the way, but the margin of the lead may be less expected.
- London contributes 29% of national tax.
- Manchester comes second, with 3%.
Even adding Leeds, Liverpool, Sheffield, Bradford and Huddersfield to the proposed “Northern Powerhouse” only gets us to around 7% – still less that a quarter of London.
- It’s quite hard to know how to interpret a chart like this, but it’s clear that there’s a lot of work to be done.
Until next time.
Mike Rawson
Mike is the owner of 7 Circles, and a private investor living in London. He has been managing his own money for 40 years, with some success.