Weekly Roundup, 17th April 2018

We begin today’s Weekly Roundup in the FT, with the Chart That Tells A Story. This week it was about build-to-rent.
Build to rent

Actually, this week the Chart didn’t Tell Much of a Story.
- It’s just a plot of build-to-rent by stage of construction, split between London and the regions.
- There’s to time series, or comparison to other forms of construction.
All we can say is that London has more build-to-rent than the rest of the country, and will still have more (as well as five times as much) when the current build cycle is complete.
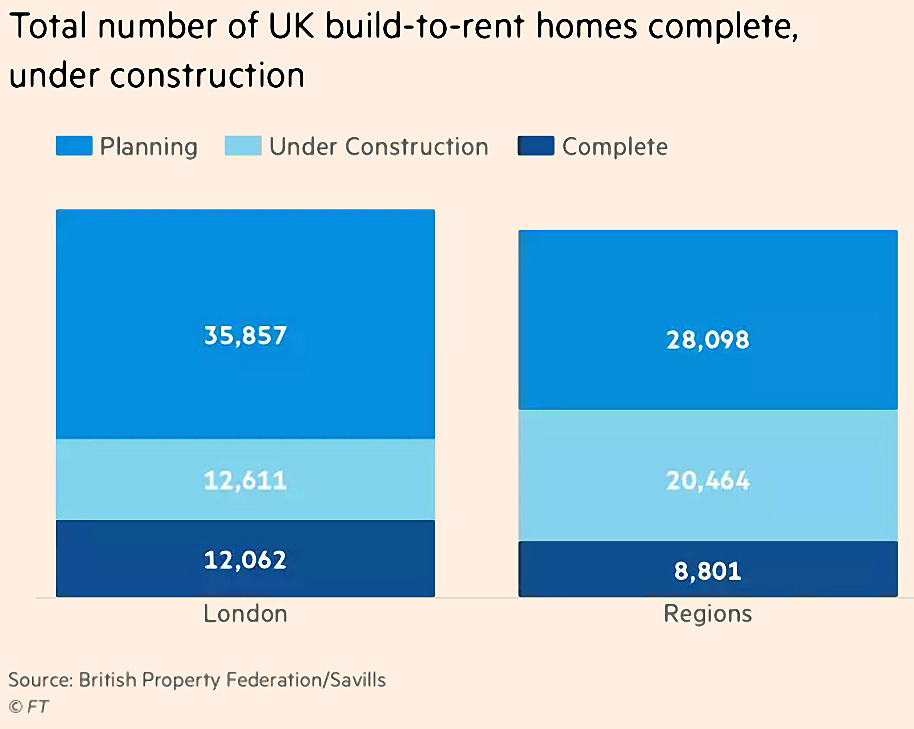
James Pickford explained that this is new data that will now be published annually.
- The number of planned homes in this sector has gone up by 30% over the last year.
- The pipeline is expected to double over the next two years.
Completions are up 45% and the number under construction is up 47%
- Note that there is an element of triple-counting here each property will move through the “planned”, “under construction” and “completed” categories.
- Eventually completed properties will dominate the stats and this will be less of a problem.
The government is backing build-to-rent, and the long-term income streams are attractive to pension providers (insurance groups) and to local authorities.
- One criticism to date is that the sector has focused on building (lucrative) flats, when what is needed are more family homes.
- 17% of current planned properties are houses.
Impressions

Tim Harford’s column was about impressions.
- He was talking about how a personal visit to the new concrete cities of China made more of an impact on him than the statistics about the recent growth of the country.
More widely, he was referring to Kahneman’s fast (1) and slow (2) systems for thinking.
- In the case of China, the system 1 and system 2 results agreed, but this isn’t always the case.
Tim used the example of empty buses.
- On average, there are only 17 people on each London bus (capacity 80).
- Yet most people think that they are packed.
That’s because there are more people on the busy buses, and so more impressions that they are busy.
- If you asked a driver (who sees mostly empty buses) you would get a different answer.
Sometimes personal experience is no use in setting policy.
Earnings season

John Authers worried that monster US earnings forecasts might not be achieved.
- Usually, companies talk down earnings and then “surprise” by beating them (by an average of 3%).
But this year – because of the Trump tax cut at the end of 2017 – earnings forecasts have gone up as the dates approach.
- The dollar is also weakening, flattering foreign earnings, and oil prices rises are boosting energy producers.
This optimism about earnings is preventing the market from crashing.
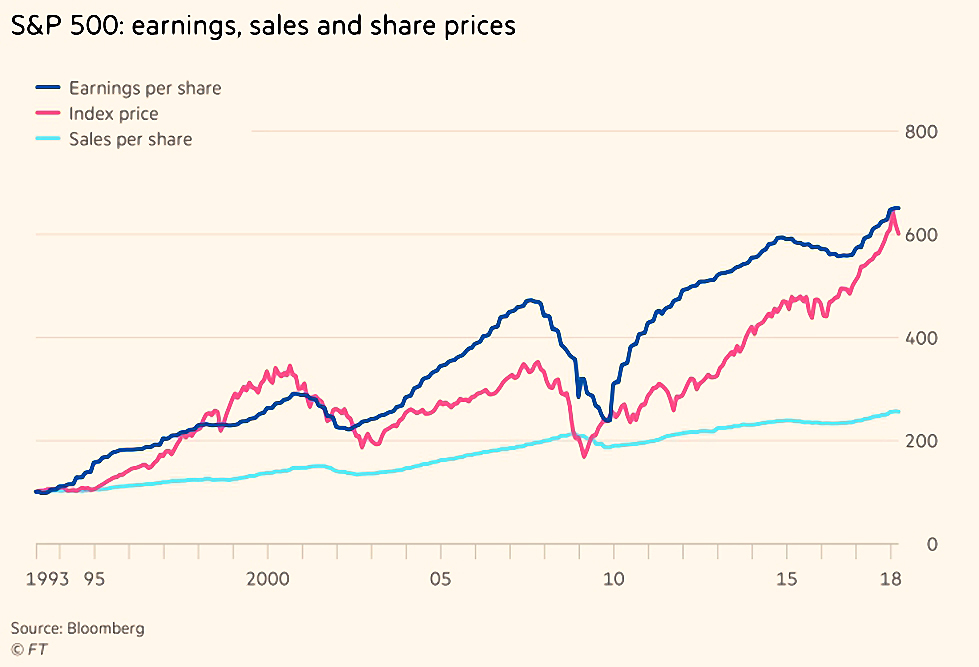
For John, the big question is whether profit margins will return to the (lower) long-run average.
- But any earnings disappointments in the coming weeks (real surprises for a change) could also cause problems.
Crypto

David Stevenson took a contrarian look at crypto.
- David’s only experience in the space was losing money via an Ethereum tracker a few months ago.
He points out that Bitcoin is slow and expensive to use.
- Only three of the top 500 US retailers accept it.
- And cryptocurrencies consume an enormous amount of power – more than the smallest 159 countries in the world (put together).
At the same time, this is a new asset class, and:
Sensible investors are talking about having some (minimal) long-term exposure to the various systems – 56% of financial professionals said they would be looking to buy more digital currencies this year.
David doesn’t recommend online wallets (and their offline, physical backups).
- Nor is he a fan of ICOs.
The easiest way to get exposure is via spread bets (IG, CMC) or CFDs (eToro, which also offers a “copy fund” to track the most successful traders on the platform).
- Of course, these come with leverage, which is not for everyone.
Even safer (relatively speaking) are tracker funds (exchange traded notes) from XBT.
- I suspect these are the ones that Hargreaves Lansdown offers.
- Note that annual charges are more than 2% (ignoring the HL platform charge).
David also mentions a forthcoming ETF:
First Trust is just about to launch a UK version of a US product called the Indxx Innovative Transaction and Process ETF.
- This is the “picks and shovels” approach to crypto.
Finally there are the incubators and accelerators, though none are listed on AIM or the UK main market.
I’m not active in crypto at the moment, but until a sensible ETF comes along, spread bets look like the best option for those who want some exposure.
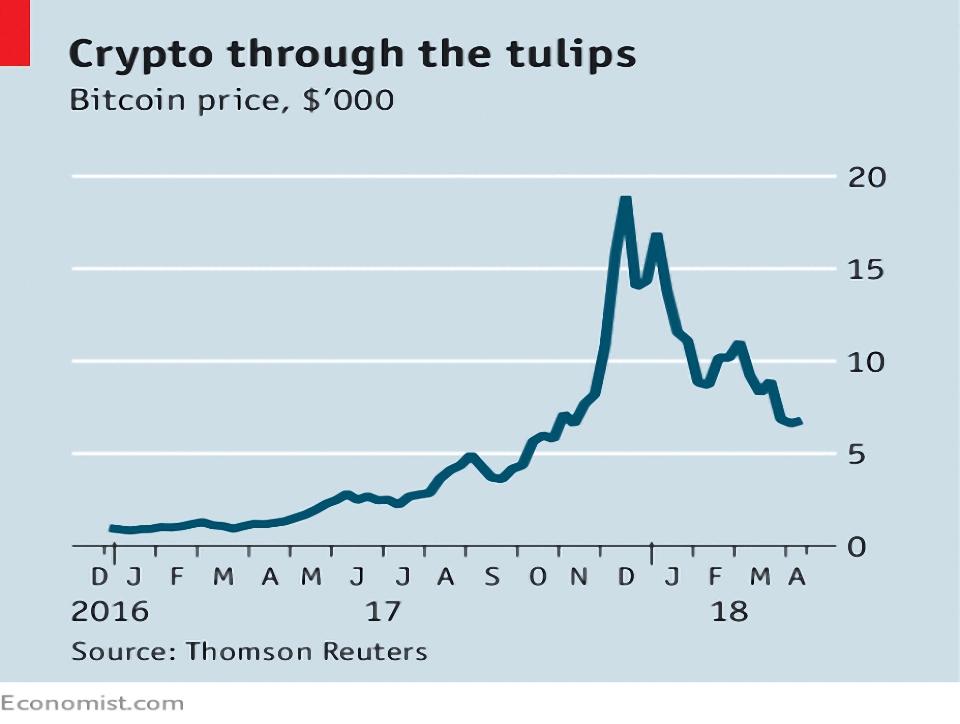
The Economist also looked at Bitcoin.
- Despite the massive crash of recent months, prices are only back to where they were in mid-2017.
The article looked at a section in the Barclays Equity Gilt Study 2018 which describes crypto as a “solution still seeking a problem”.
There are four issues:
- Trust – decentralised currencies lack government backing
- Sovereignty – tax avoidance and loss of control mean that governments are not keen
- Privacy – crypto is anonymous to an extent, but not as much as cash
- Reversibility – it’s hard to fix a mistake, or the impact of fraud
On top of this is the fact that the current system works well for most people, especially when you account for recent innovations like contactless cards an payments from phones.
So crypto has better prospects where people don’t trust the government, or its currency.
- Which basically means emerging markets (or collapsing ones like Venezuela).
- It’s possible that criminals could also be interested, though they seem to like cash.
Barclays estimates that the crypto could reach a fair value similar to that seen at the start of this year.
- But most buyers are speculators, so fair value could be hard to find.
So far crypto looks like a classic bubble.
- Which means that lots of people got in fairly recently, and are nursing losses.
Which means that the long-term prospects are bleak.
CAPE

In MoneyWeek, John Stepek argued that we shouldn’t dismiss the CAPE ratio.
- I personally like it as a long-term indicator, but it doesn’t seem to have much short-term predictive power.
Another problem is that it constantly seems to be flashing a sell signal.
- It’s been above the long-run average for most of the past 25 years.
- The last time it was at fair value was immediately after the 2008 crash, and that only lasted for a few months.

Critics point to three reasons:
- changes in accounting standards
- historically low interest rates
- monopolistically dominant technology companies (and their high margins).
John stresses the long-term predictive powers of the ratio, supported by a recent paper than looked at 12 international markets.
- He suggests that you use the CAPE for relative asset allocation, rather than market-timing.
Which sounds reasonable to me.
- So the US is expensive, and Russia is cheap.
But perhaps it’s cheap for a good reason (or nine).
QE was good

On the Adam Smith blog, Sam Bowman argued that QE was a good thing, even if it led to greater inequality.
- QE inflated asset prices, and since the rich own more assets than the poor, they got proportionally richer.
But the alternative (no QE) was a depression like the 1930s.
- When everyone is broke, inequality comes down, but it’s not better for anyone.
I’d like to see more people use counterfactuals as comparisons.
- And I’d like to see more people look at absolutes rather than relatives.
So two thumbs up for Sam.
Corbyn watch
The Evening Standard reported on the latest crazy scheme from Momentum – a local income tax, levied on London borough-by-borough basis.
- It sounds like a recipe for lots of rich people holed up under a low tax council, and lots of poor people paying rates they can’t afford.
Just look at the way multinationals play off jurisdictions against one another.
- Local income tax turns us all into mini multinationals.
Twitter pics
I have seven for you this week:
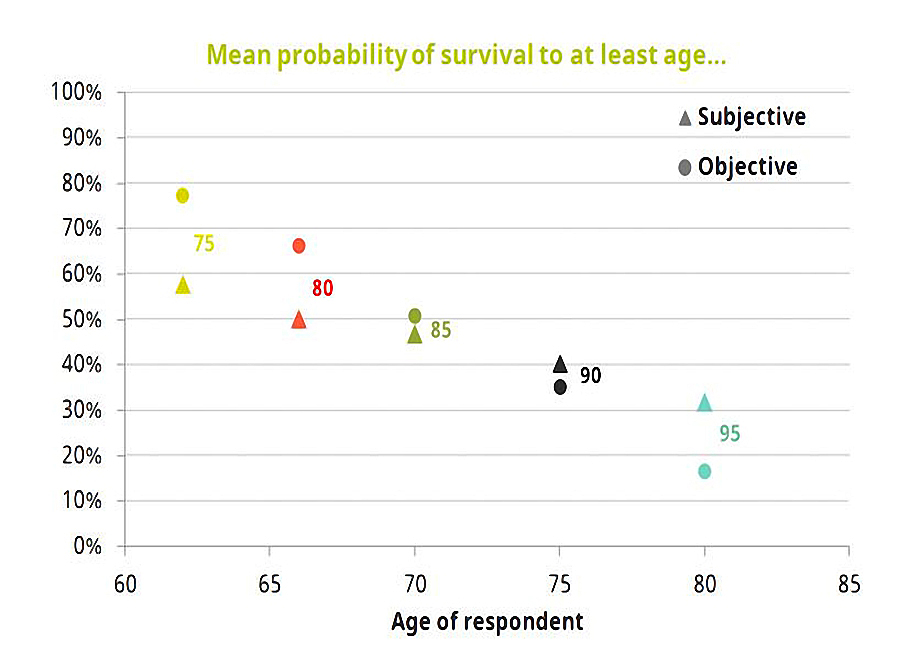
The first chart shows that people in their sixties underestimate their chances of living to 75 or 80.
- Conversely, those over 70 overestimate their chances of living to 90 or more.
It’s the first part of the chart that’s important.
- This lack of confidence leads to under-saving for retirement.
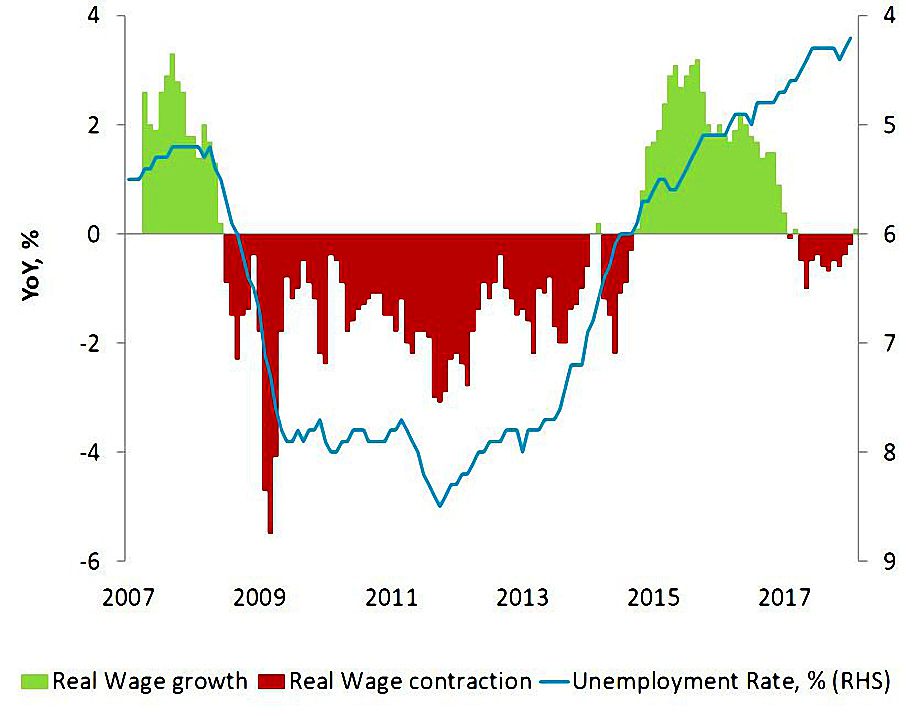
The second chart shows real UK wage growth plotted against unemployment / employment.
- The normal relationship (low unemployment = higher wages) holds for most of the chart, but not for the last couple of years.
Wages are now turning up again, but the increase in workplace pensions contributions means that for many, take home pay won’t.

Chart number three shows that the effect of these contributions can be exaggerated:
- There are exclusions for income at the top and bottom of the wage spectrum. so effective rates can be as little as half of the headline rate.
- Note that the chart uses 2019/20 contribution rates (8%) rather than the 5% for this tax year – but the principle remains the same.
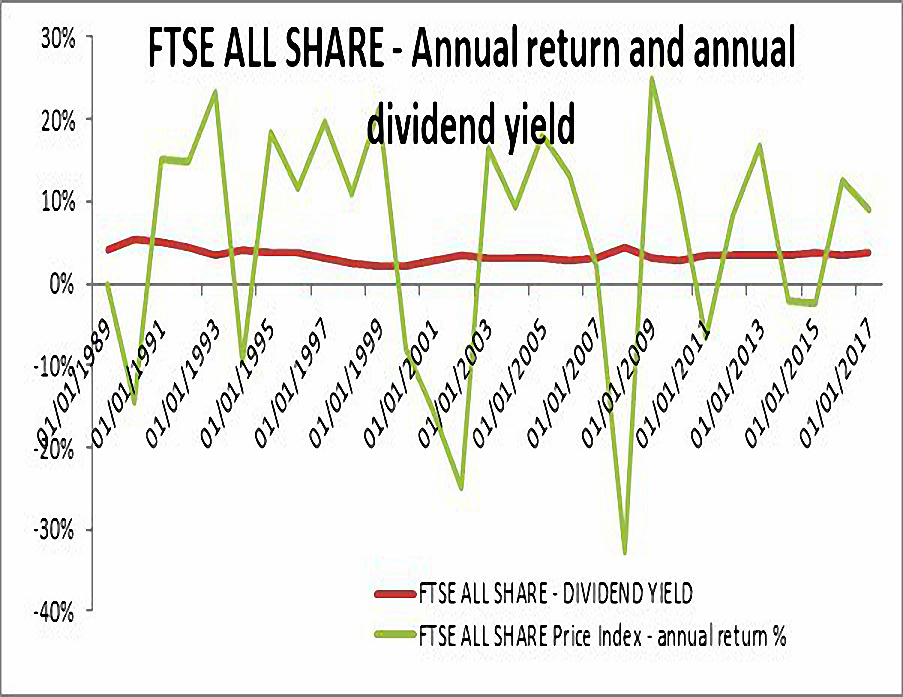
The next chart shows how consistent the FTSE All Share’s dividend yield has been, compared to capital gains (and losses).
- It would be interesting to show dividend cover on this chart as well – presumably there have been times when paying out so much in dividends was not sensible.
I’m not a big fan of dividend investing, though I agree that you should try to re-invest them.
- Dividends are just a highly visible (and weaker) version of value investing, and chasing yield can lead you into trouble.
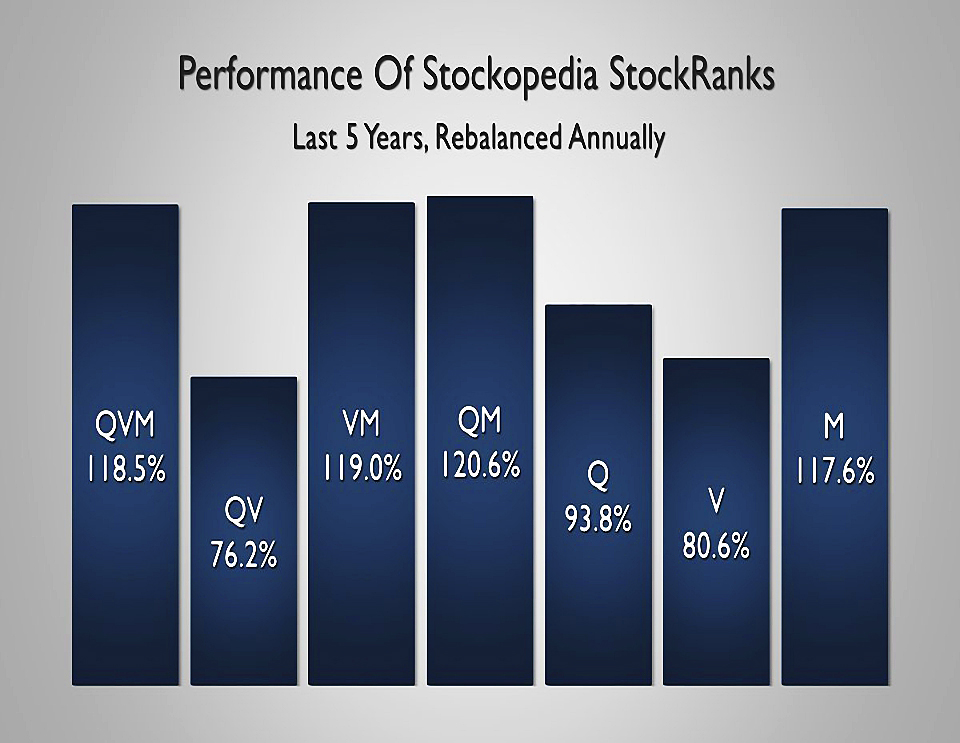
Chart number five shows that value has been the weakest factor over the last five years.
- It shows returns from portfolios selected using Stockopedia’s Stock Ranks, and rebalanced one a year.
Momentum is the strongest single factor (as it so often is), followed by quality.
- QM and VM are even better, as is QVM.

The sixth chart shows how US investors would use $10K, by generation.
- Paying down debt (mostly credit card debt) is popular with everyone.
Not surprisingly, crypto and personal education are popular with millenials, boomers like savings accounts and tax shelters – and Gen X-ers want to invest in their children’s education.
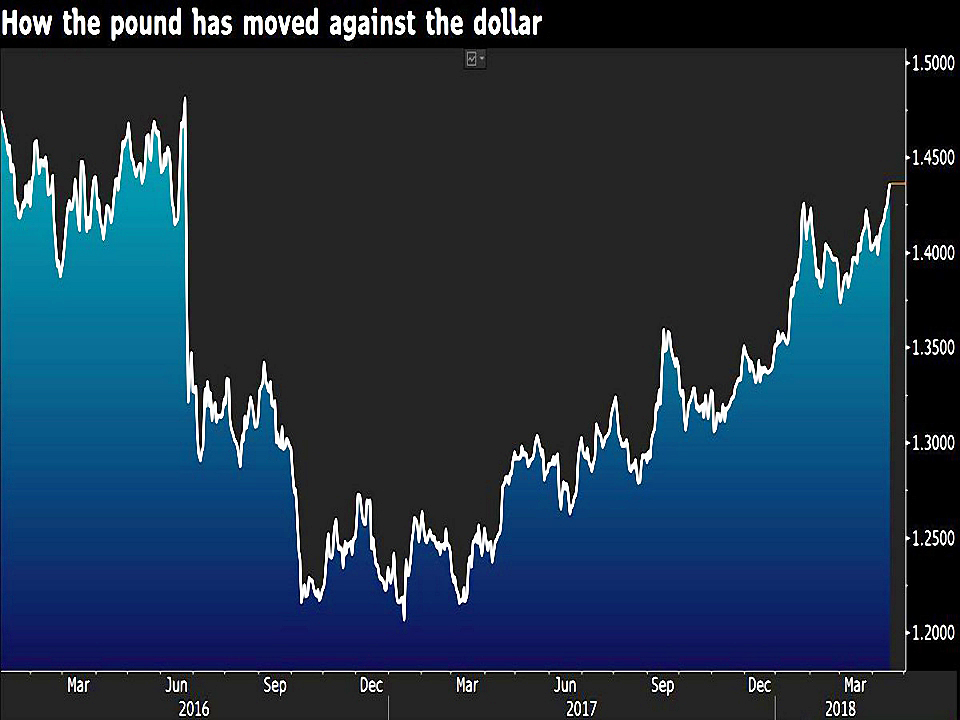
The final chart gives me particular satisfaction – it shows the recovery in the pound against the dollar since the Brexit vote.
- I had a lot of discussions with people in late 2016 about the future direction of cable.
- Very few agreed with me that it was likely headed back above $1.40.
Until next time.
Mike Rawson
Mike is the owner of 7 Circles, and a private investor living in London. He has been managing his own money for 40 years, with some success.