Weekly Roundup, 23rd January 2018

We begin today’s Weekly Roundup in the FT, with the Chart That Tells A Story. This week it was about the effect of Brexit on UK stocks.
Contents
High Brexit, Low Brexit

Ed Bowsher looked at the BATS Brexit indices, which divide the FTSE-100 into two:
- The Bats Brexit High 50 – UK-focused companies – and,
- The Bats Brexit Low 50 – UK companies that operate more globally.
The split is made on the basis of where revenue is generated.
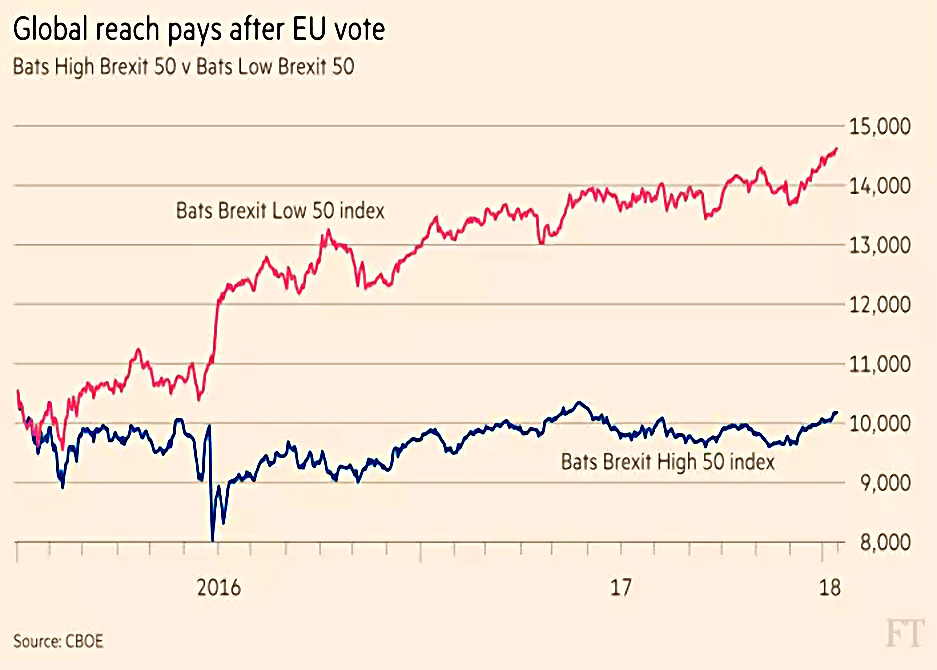
As you might imagine, the Low Brexit stocks have done better since the vote.
- Sterling fell sharply, boosting the value of overseas earnings.
- And the fall in the pound boosted UK inflation, hitting consumer-facing stocks.
It’s also likely that UK companies have reduced investment, with knock-on effects to their domestic suppliers.
The pound is back on the way up now, but this isn’t hitting the Low Brexit stocks as much as you might expect.
- This could be down to the rising oil price, and a pick up in the commodities sector, which is well-represented in the FTSE-100.
It’s a nice chart, and I can see that the two indices could be useful over the next couple of years.
- But I’m not aware of any way to trade them – there don’t seem to be any ETFs that follow these indices, and they don’t appear on the IG spread betting platform.
If you know of a way, please tell us in the comments.
Where are we now?
On to the first of our regular features – for now at least. The FT had two articles on the progress of the bull market.
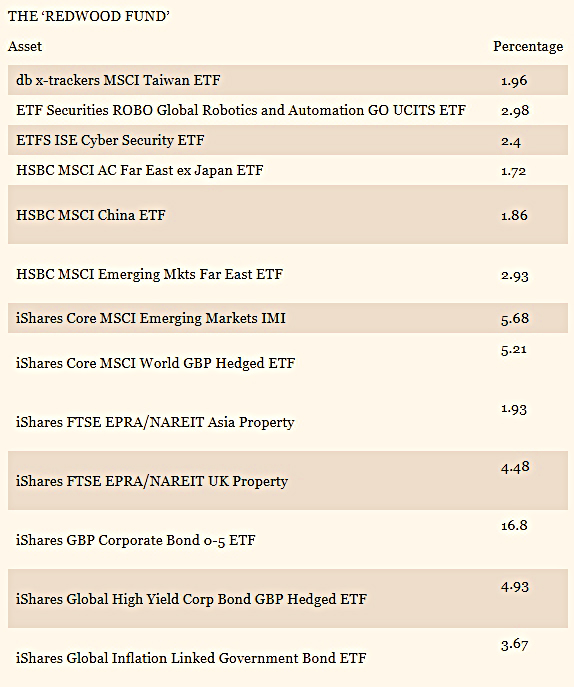
John Redwood advised against selling stocks while the bull continues.
- The portfolio of index funds that he runs for the paper is at its maximum allocation to shares, and its minimum to bonds.

John Authers also argued that the stock bull can resist the bond bear.

As far as the markets go, Trump has had a good first year as president:
- he’s done the things they like, including the tax cuts
- he hasn’t left NAFTA, declared China a currency manipulator or introduced the “border tax adjustment”
And the gradual loss in value of the dollar has made Americans feel richer:
- the MSCI world index is up 23.1% in a year – in dollars
- in euros, the index is only up 7.5%
John still worries that rising bond yields will eventually force down stock prices.
- The tipping point could be when the cyclically adjusted earnings yield (the inverse of the CAPE) is lower than bond yields.
- The US 10-year yield is currently 2.64%, and would need to go above 3% to hit this trigger.
It could take another year to reach that point, and in the meantime there should be more to come from equities.
Crypto
On to our second temporarily recurring feature – cryptocurrencies.

Merryn wrote about this week’s Bitcoin crash – from $20K to $9K.
- All of the other cryptos fell, too.
- The founder of Ripple lost around $40bn (yes, billion) in one day.
She compares crypto unfavourably with gold in terms of scarcity, utility, central bank acceptance and as a long-term store of value.
- But also says that it’s not a bad idea to keep an eye out for anything that might become the next big thing.

She quotes a study from Hendrik Bessembinder which found that:
- 58% of US stocks return less than T-bills over their lilfetime
- the gain in the US stock market since 1926 is attributable to the best-performing 4% of stocks.
I’ve long been of the opinion that avoiding the worst stocks is the key to success with active investing.
- But the degree of concentration of gains surprises me.
- It will both encourage stockpickers, and at the same time remind them of the poor odds they face.
I’d be interested to see a similar analysis of the UK market.
- If we exclude investment trusts and take the number of UK stocks to be around 1,500 (( this is a pure guesstimate on my part, based on 1,810 stocks in the Stockopedia UK universe, minus around 300 investment trusts )) then we only have around 60 good stocks to aim for.
Merryn closes the article by reminding us that small stocks outperform.
- The Numis Smaller Companies Index (NSC) which covers the bottom 10% of the UK market has returned 15.2% pa since 1955, 3.4% pa more than the FTSE All-share.
She recommends four funds:
- Independent Investment Trust
- Miton Micro cap IT
- Jupiter UK Smaller Companies fund
- Amati Smaller companies fund.
The first two of these appear on our Master List of Investment Trusts.
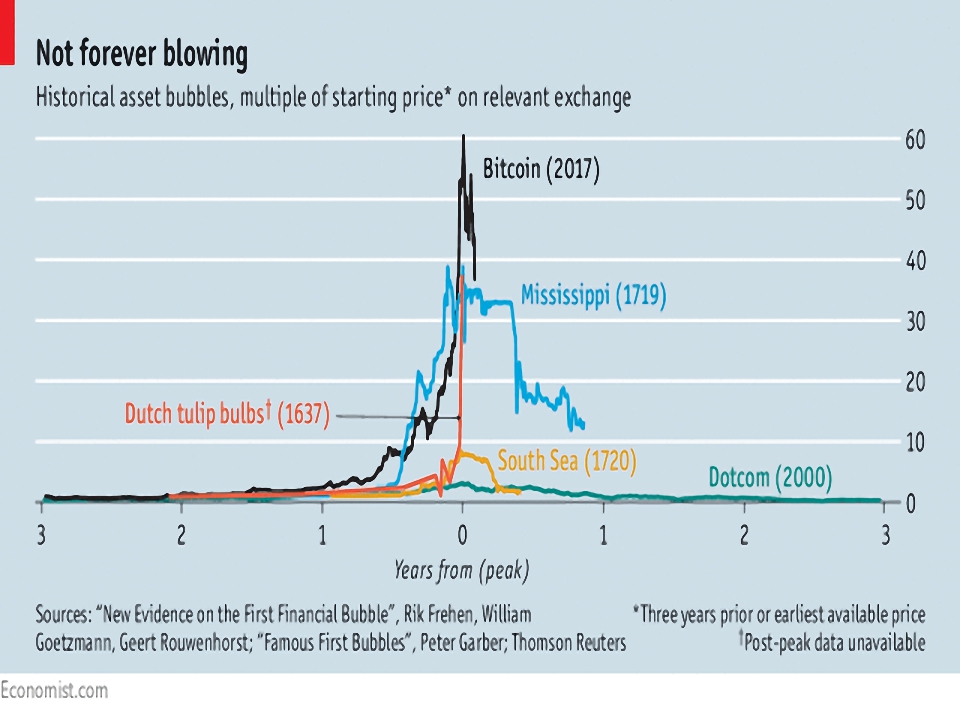
In an article which compared crypto to historical asset bubbles, the Economist put the Bitcoin crash down to the threat of a ban in South Korea.
- They point out that elsewhere in Asia, Japan has embraced crypto, while China has pretty much banned it.
China used to host 90% of trading until the ban, and now Japan is the largest market.
- South Korea’s share is 10%, compared to its 2% share of GDP.
The newspaper puts crypto’s popularity in Asia down to a high-tech culture and capital controls, plus an enthusiasm for gambling.
In a second article on crypto, Buttonwood looked at investor psychology through the bubble.
The classic model has five stages: displacement, boom, euphoria, financial distress and revulsion.
In the euphoria stage, people buy because others are buying and because they anticipate being able to sell quickly at a higher price. At some stage, doubts set in; some people take their profits. Bad news occurs.
Once the price starts to fall, the psychology changes. People who bought early see a dent in their wealth. Bargain hunters jump in and temporarily drive the price higher but it doesn’t last.
He concludes that we aren’t at the distress stage yet, but it could be close.
- And because Bitcoin has no income stream, it has no floor price (beyond the marginal cost of production).
The dollar

Sticking with currencies (after a fashion), the Economist noted that the dollar reached a peak against a trade-weighted basket of currencies a year ago.
- They expect another year of decline in 2018.
The fall is more down to economic health elsewhere – European stock markets, the oil price (see below) – than a decline in the US.
- And other countries are starting to raise rates and / or reduce their bond buying programmes.
The third factor is relative currency prices to begin with, as shown by the newspaper’s Big Mac index.
Big Mac index
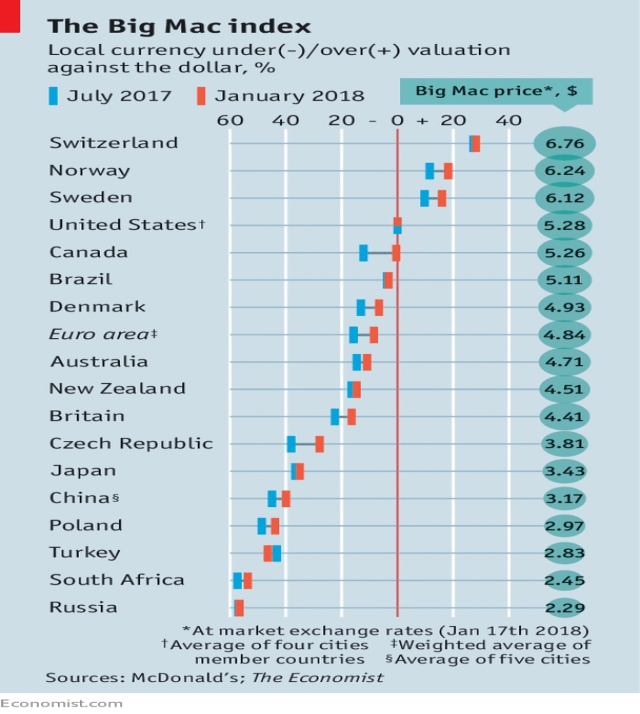
The latest version of the index – which applies purchasing power parity (PPP) to burger prices – puts the US behind only Switzerland, Norway and Sweden in terms of currency strength.
- Back in 2008, only two currencies were cheaper than the dollar.
The euro has already jumped against the dollar (from $1.11 to $1.20), but remains 8.4% undervalued.
- The Polish zloty and Czech koruna might be better ways to play this trade.
The Canadian dollar has done the same as the euro, and the Economist expects the yen to follow suit.
- Emerging market currencies (other than Brazil’s real) are also undervalued – particularly the Russian rouble and the South African rand.
And so is the pound, but Brexit (( And, I would argue, Corbyn )) hang heavy over the British currency.
Oil price
The Economist is not worried by the higher oil price, seeing it as a reflection of a healthy global economy, and not a threat to it.
- The slump two years ago reflected weak demand and abundant supply.
Saudi Arabia was not expected to cut output, since low prices would hurt the shale-oil industry in the US and also Iran.
Then Chinese demand increased and commodity prices in general surged.
- And OPEC proved able to curb production.
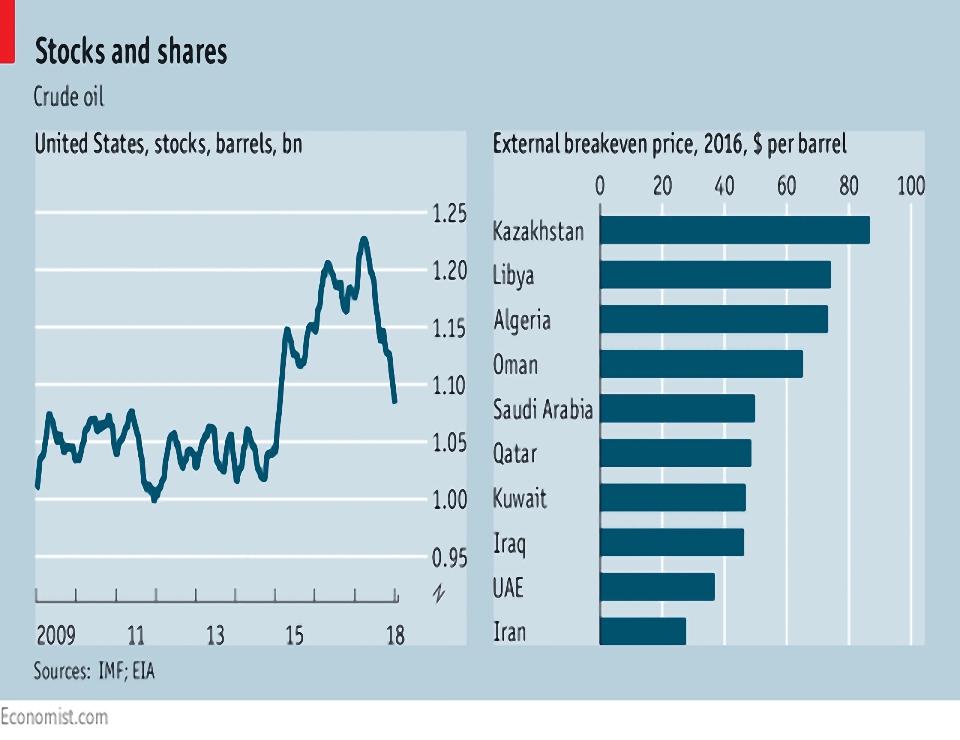
- Stocks have fallen, particularly in the US.
The surprise is that prices have risen so far, and that’s down to restraint from small shale producers, whose financiers want profits rather than output.
- The second surprise is that higher oil prices haven’t had the traditional negative impact on stock prices.
In theory, since production matches consumption, the oil price should be neutral at the global level.
- In practice, (Middle Eastern) producers save some of their windfall gains, so higher prices reduce global demand.
But the world is now less reliant on oil, and exporters are more dependent on high prices – more than $40 a barrel, compared with the current price of close to $70 – to fund bloated domestic spending.
The shale oil industry means that some of the profits are recycled into the USA GDP.
- And many observers take a rising oil price as a sign of healthy Chinese growth.
The logic of the market has also changed, in that oil is no longer considered scarce.
- Keeping in it in the ground as an asset for the future does’t make sense today.
So producers want to turn it into money in the bank before it is no longer needed.
- Which means that low cost producers like Saudi Arabia, UAE, Iran, Iraq and Kuwait have an incentive to undercut everyone else.
Some of these producers have production costs close to $10 per barrel, but their “social costs” (funding government spending) mean that the oil price is more likely to stay around $60.
Bank offers

In the Times, Ali Hussain wrote about high street banks trying to upsell their current account customers to their investments services.
- Mostly they are pushing ready-made portfolios.
The problem is that they charge too much – from 0.65% pa up to 1.06% pa.

Ali’s article recommends Nutmeg, Fidelity and Vanguard instead.
- But with the exception of Vanguard, I think that you can do even better.
You can find our list of Robo Advisors, ready-made portfolios and DIY platforms – and links to our many articles on the topic – here.
Twitter pics
I only have three for you this week.

The first is a variation on the familiar chart that shows the annual performance of various asset classes.
- This one shows mainly stock sectors, but the common message – the importance of diversification and asset allocation – remains clear.
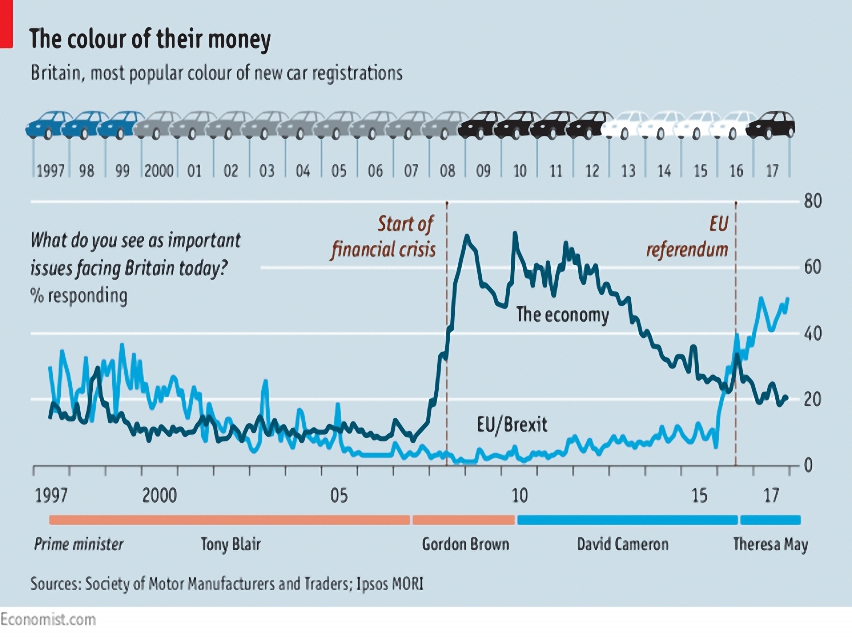
The second is from the Economist, and looks at the dominant colour of new cars in the UK, which the newspaper thinks reflects the national mood.
- In the late 1990s primary colours were popular, apparently mirroring optimism under Tony Blair.
- Later on, drivers switched to “sensible” greys and silvers.
- After the financial crisis, black cars became popular.
- Then under the coalition, white cars pulled ahead, which the Economist sees as a way of not making a firm choice.
- Now we are back to black – because of Brexit, apparently.
I’m not sure I buy this (not least because Corybn is a lot scarier than Brexit).
Personally, I started with a red car in the late 80s (I was a late learner), then switched though grey to black, all long before Tony Blair took charge.
- Then I went back to silver under Blair, before giving up cars altogether.
And size matters, too – big red cars look as stupid as tiny silver ones.
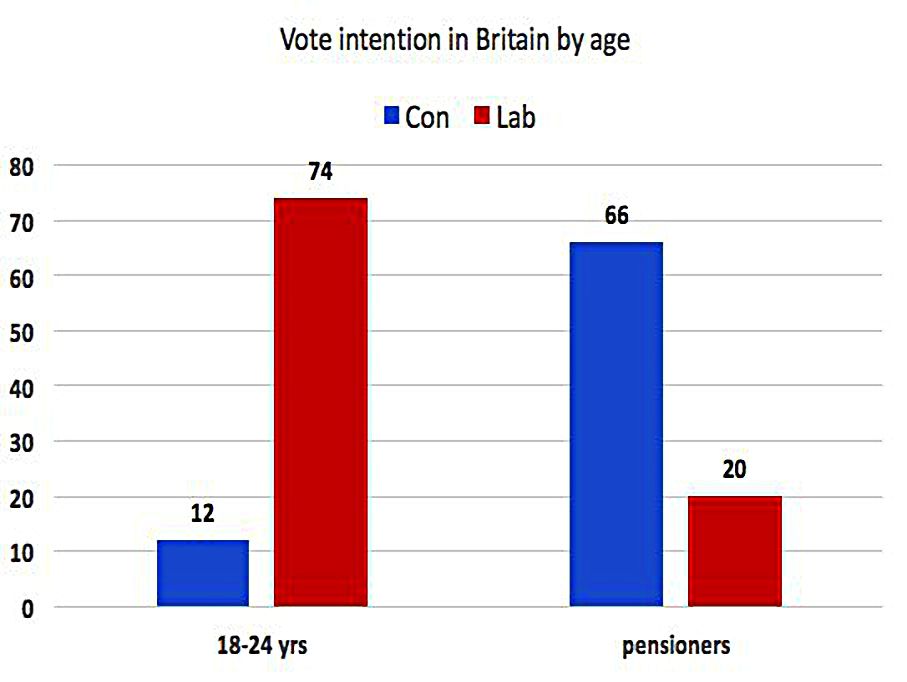
And finally, the saddest chart of the week – voting intention by age.
- I realise that young people are frequently taken in by leftist idealism.
- And I’m not sure that the generations ever had many interests in common.
But I don’t think that things have ever been as bad as this.
Until next time.
Mike Rawson
Mike is the owner of 7 Circles, and a private investor living in London. He has been managing his own money for 40 years, with some success.