Weekly Roundup, 26th July 2016

We begin today’s Weekly Roundup in the FT, with the Chart That Tells a Story. This week it was about inflation and wages.
Contents
UK inflation and wages

Emily Cadman took a look at forecasts for wages and inflation, and their recent history.
- Until the 2008 crisis, wages grew faster than inflation.
- But in the years following, inflation spiked up above 4% pa, and wages rises fell below 2% pa.
- Since 2012, inflation has come down again, and in the past couple of years people have on average enjoyed real wage increases.

The Brexit vote and subsequent collapse in Sterling means that inflation is likely to head up to 3% by the end of next year.
- With unemployment low, workers should have some bargaining power, but increasing wages without increasing unemployment would require productivity gains, which have been absent for some time.
Emily points out that the official inflation figures (the chart shows CPI) exclude housing costs, which have increased faster than earnings over the last five years, particularly for young people.
Pension changes

Failed company pension schemes remained in the news thanks to the BHS saga, ((I’ll be writing in more detail about these in the weeks to come )) and Josephine Cumbo reported on delays to the introduction of a better pension protection scheme.
- Under the current system, those with more than 20 years of service lose out.
- Plans to fix this have been delayed by the changes to the Tory government.
The new scheme will increase the compensation cap for each year of service by 3%, with an overall cap of double the standard cap (ie. £74K).
- The new payments will not be back-dated, so the delays are material to those affected.
Under the protection scheme, those with high pensions normally receive 90% of what they were promised by the original scheme.
Metropolitan myths

Tim Harford looked at what he described as four myths from the “trendy centre-left“:
- soaring inequality means that ordinary people haven’t shared in the benefits of economic growth
- rich people and big companies don’t pay taxes
- GDP is a statistic that misses what really counts
- economists are reliably wrong
I would argue that one and three in particular are not left-wing views ((Since I hold them myself )), but it nonetheless would be interesting to discover they are myths.
On point one, Tim says that although the top 1% pulled away during the 1980s and 90s, the gap between the 10th percentile and the 90th percentile actually fell from 1990 to 2014.
- That’s interesting, but I’d really like to see a comparison between GDP today and in 1980, and the average quintile incomes at those dates.
- I would expect to see that the bottom two and perhaps even three quintiles haven’t maintained their share of GDP over the period.
Tim thinks that inequality hasn’t got much worse in recent years and that the problem is a lack of growth.
- I think that tax reforms since 2010 have helped low-paid workers and penalised those on £50K+ and in particular those on £100K+ pa.
- This makes post-tax inequality look less of a problem than trends in pre-tax income might show.
- Lack of growth is definitely a problem though.
On the second point, the top 1% pay 28% of income tax, and around 9% of VAT.
- London alone generated 29% of tax last year.
- So the rich individuals do pay their share.
Corporate taxation is more complicated, especially where multi-nationals are concerned, but Tim offers no evidence.
Tim agrees that GDP is flawed, but his point is that it remains a good indicator of what is important to people.
- An alternative is the Social Progress Index, which uses 50 measures – including access to nutrition, health care and schools – but no financial measures.
- The correlation between SPI and GDP is 0.88 on a log scale, which is very high.
As for the usefulness of economists, Tim thinks that the often levelled charge of not spotting the 2008 crisis is unfair.
- The economists who looked at Brexit are experts on tax, household income and globalisation.
- They were unlikely to spot the collapse of Lehmann Brothers.
Stop losses

Over in MoneyWeek, Matthew Partridge looked at how you should treat your winners and losers, and at stop losses.
- There’s lots of evidence for the momentum effect, which means that shares that are rising in price are likely to keep rising, and vice versa.
- So you should run your winners and cut your losses, but this is psychologically difficult.
Stop losses are an attempt to automate your exit in order to overcome this psychological difficulty.
But do they work, and where should you set your stops?
We’ve looked previously at evidence that you should use stops, and that remains our view.
Matthew finds the evidence mixed.
- Stock performance generally improves, with lower volatility.
- Commodities and gold don’t respond so well.
Another study looked at how tight the stops should be:
- 10% is too tight (lots of shares recover from here).
- On the other hand, almost no shares recover after a 40% drop.
The other problem is that over time, momentum changes into reverse momentum – those stocks that have fallen start to become more likely to rise.
- This effect starts to become noticeable over time-frames of around 12 months.
Matthew recommends a 25% stop-loss, which is a little looser than our preference of 20%.
- We also like trailing stop losses so that you know when to cut a winner as well as a loser.
Milllenials

MoneyWeek also had a round-up by Chris Carter of articles on the prospects for millennials (workers currently aged under 35).
- The Resolution Foundation has reported that they are earning £8K pa less than their parents at age 27, and this finding was used by Theresa May in her PM acceptance speech.
- The impact of the 2008 crisis, and anticipated fallout from Brexit mean their prospects are poor.
- Millenials are also paying more in rent than previous generations.
Tim Worstall pointed out on the Adam Smith Institute blog that the key factor was actually that more milennials were going to university rather than getting jobs – this reduces earnings at first.
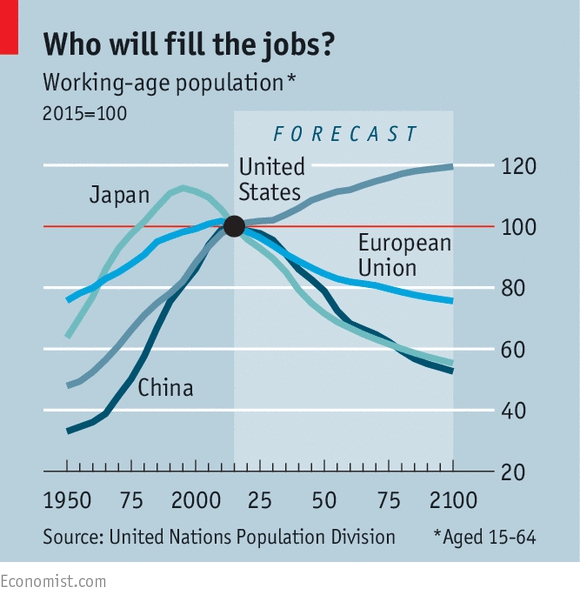
Demographics
Over in the Economist, Buttonwood looked at the likely effects of ageing populations on “debt-fuelled growth”.
- Not since the Black Death in the 14th century have there been so many countries whose populations are getting smaller (25 already, more than 100 by 2075).
- The Black Death lead to labour shortage and wage increases, which would make a change today.
A new report from Berenberg looks at the dependency ratio – the number of children plus elderly compared to those of working age (15-64).
- This ratio rose after World War 2 because of the baby boom.
- It then fell in the 1960s as the boomers went to work.
- And it is now rising again as they retire (and live longer).
There are some obvious effects from comparing the ratio over time within 10 rich economies:
- a growing workforce pushes up real house prices by 2.7% pa; a shrinking workforce makes prices go down by 0.2% pa
- GDP also rises faster (2.6% pa vs 1.9% pa)
- inflation is higher (4.1% pa vs 2.7% pa)
- and real interest rates are higher
All of these trends are now likely to reverse, and Buttonwood is concerned about the implications for rising debt to GDP ratios in the developed world.
- Borrowing can be used to pay for consumption, or to buy an asset (eg. a home).
- In the latter case, the expectation is that incomes and asset prices will hold up so that the loan can be repaid successfully.
- With low growth, low inflation and stagnant house prices, debts tend to hang around.
This has been the case since 2008, with a transfer of debt from the private sector to the government, but not much reduction).
- Only low interest rates have kept borrowers out of trouble.
- But demographics suggest low rates will continue.
The problem is that an ageing population will not want to borrow, and so low rates won’t stimulate growth the way they are meant to.
- With low forecast consumption, neither will companies need to borrow to invest.
To generate real growth, either more of the elderly need to work, or we need a productivity breakthrough.
Neither seems to be on the horizon.
ARM and industrial strategy
The Economist also had four articles (1, 2, 3 and 4) on the possible emergence of an industrial strategy under the new UK PM, and the effects of foreign takeovers of UK firms (spoiler alert – they usually improve the firms).
- The current focus is the takeover of micro-chip designer ARM by SoftBank of Japan – the largest ever Asian investment in Britain.
- The firm whose chip designs power 95% of smartphones sold in 2015 had been looking cheaper than usual (the sale price was still at a forward PE of 40) after the fall in sterling.
- SoftBank promised to keep ARM’s HQ in Cambridge and to double the number of jobs there in the next five years.
- The new government in turn said that the deal showed that the UK is “open for business”.
The newspaper welcomed the deal but worried that the government’s more interventionist approach may lead to fewer deals in the future, and that Brexit might mean that there were fewer British firms worth buying.
Theresa May has been critical of past takeovers, and has set up a ministry of “industrial strategy”.
- At the moment, only takeovers in defence, financial services and media can be prevented if they fail a “public-interest” test.
- This list may be extended.
Loss of fin-tech “passporting” and potentially stricter migration rules could mean there are fewer UK tech startups in future.
- I would argue that control over migration rules will make it easier to higher non-EU techies.
The Economist thinks that worrying about foreign firms buying your successful firms is a nice problem to have – takeovers should be encouraged, and access to labour loosened.
Big Mac index
And finally, the Economist provided its latest regular update to the Big Mac index.
- For those not familiar with the index, it takes the price of the burger in 59 countries (accounting for 94% of global GDP), converting all the prices back to dollars.
- Since the labour and food inputs of the burgers are relatively standardised, much of the difference in price is down to exchange rates.
For example, in the US the burger costs $5.04, while in Hong Kong is costs only $2.50.
- This suggests that Hong Kong’s currency is undervalued relative to the dollar, by more than 50%.
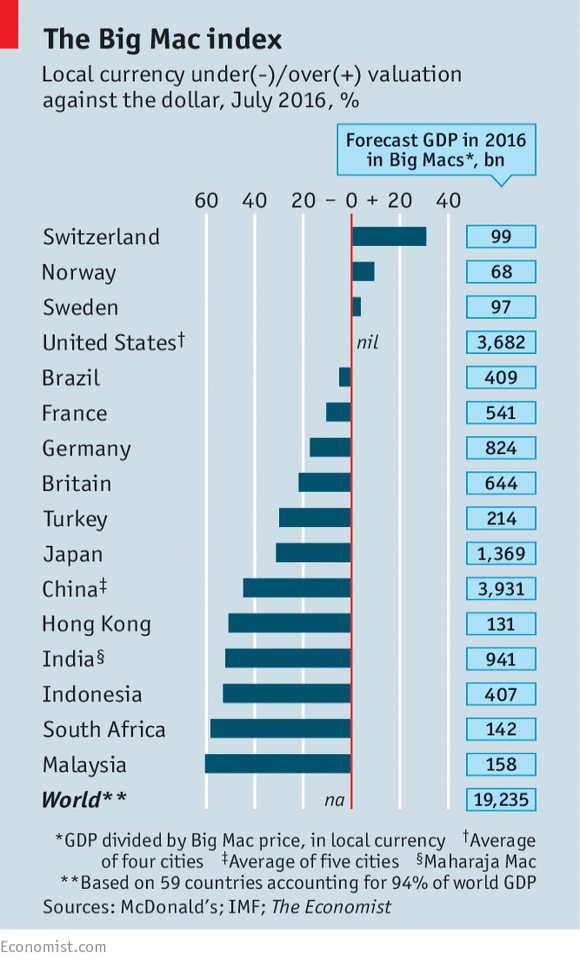
Most currencies are currently undervalued relative to the dollar.
- Only Sweden, Norway and Switzerland are overvalued.
- This suggests that it is the dollar itself that is overvalued, by 56% on a trade-weighted basis.
The Economist has now introduced a more sophisticated version of the index, which takes into account poor productivity in emerging economies.
- On this measure the dollar is only 11% overvalued on a trade-weighted basis.
Interestingly, using the local price for the burger as a measuring unit (a form of purchasing-power parity), the Chinese economy is now larger than that of America.
Until next time.
Mike Rawson
Mike is the owner of 7 Circles, and a private investor living in London. He has been managing his own money for 40 years, with some success.