Weekly Roundup, 9th May 2016

We start today’s Weekly Roundup in the FT, with the Chart That Tells A Story.
Contents
Mortgages

James Pickford looked at the growth in mortgages with terms longer than the standard 25 years.
- First-time buyers in particular, but also movers and re-mortgagors are taking out more of these loans.
- The median term length for first-time buyers is now 30 years.
At the same time, Halifax raised its maximum age for mortgage repayments to 80, and then Nationwide raised their limit to age 85.
And remember, these longer terms have been adopted during a period of record low interest rates, underlining how unaffordable houses now are in the UK.
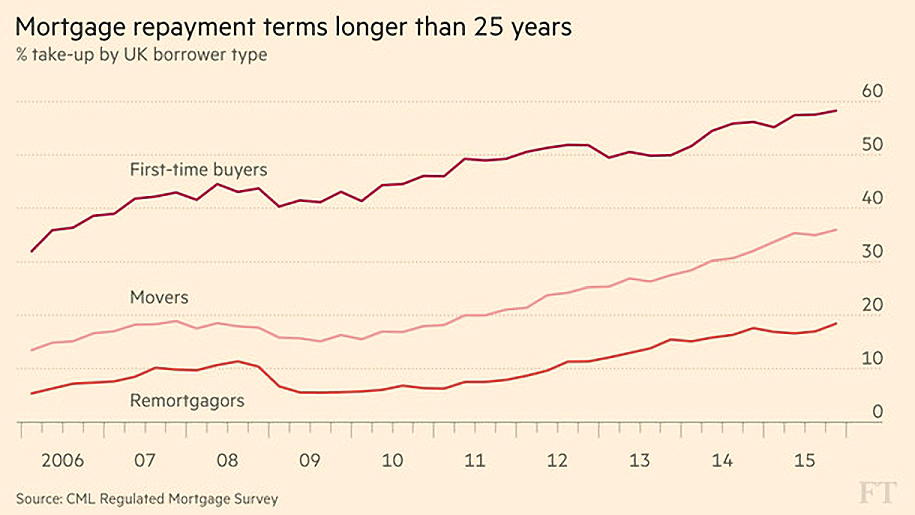
Stretching out repayments over 30 or 40 years means that more people can satisfy new affordability regulations, but it also increases the risk of a change in financial circumstances (eg. retirement) that make repayment more difficult.
- 40% of mortgages now extend into retirement, up from 10% a decade ago

Merryn also looked at mortgages, and in particular at a product from Barclays called the Family Springboard.
- This has been described in the papers as the return of the 100% mortgage, but in fact it is an inter-generational offset mortgage.
- It’s designed to help parents to get their kids a house.
It offers a 3-year fix at 2.99% on up to £500K (so not much use in London).
- The kids need to earn £50K plus, and can borrow five and a half times their income.
- The parents have to open a “Helpful Start Account” for 10% of the mortgage value. This pays base rate plus 1.5%.
- If the kids don’t keep up repayments, the parents’ interest, and then capital, are at risk.
Merryn’s not a fan.
- She thinks that it’s more evidence that the old have too much money relative to the young.
I’m not sure how you can define “too much” in that context.
- Short of forcing old people to sell their houses on the cheap, what can be done to fix it?
As always when we discuss the UK’s crazy house prices, I’m going to say that it’s mostly about supply and demand.
For house prices to become more sensible, we need to build more houses, or we need interest rates to rise, or we need some inflation (so that real prices can fall while nominal ones remain flat).
- None of the three look very likely at the moment.
St Ives
Sticking with property, the FT also reported on the vote in St Ives that we mentioned a few weeks ago.
- More than 83% of locals who voted in a 43% turnout ballot were in favour of a ban on property developers selling new homes to people who don’t / won’t live in St Ives.
The idea is to cap house prices so that young locals can afford them.
- average prices there are £400K, 18 times local earnings – more than double the national average
- 25% of houses there are second homes
- in the town centre, 48% of houses are second homes or holiday lets
I spend a week in St Ives each summer, and have been planning to buy a cottage there for more than a decade.
- But this vote won’t affect my plans (apart from making me feel slightly less welcome) since I don’t want to buy a new house, but rather something either Victorian or 18th Century.
What it will probably do is the opposite of what is intended.
- Developers won’t build anything in St Ives, and constrained supply will push prices higher.
I’ll be down there again later this year.
- But I will be on the lookout for any signs that big-spending tourists are no longer appreciated.
US household incomes
Some data on how well old people are doing compared to the young came from the Economist, which looked at demographic distortions to household income statistics.
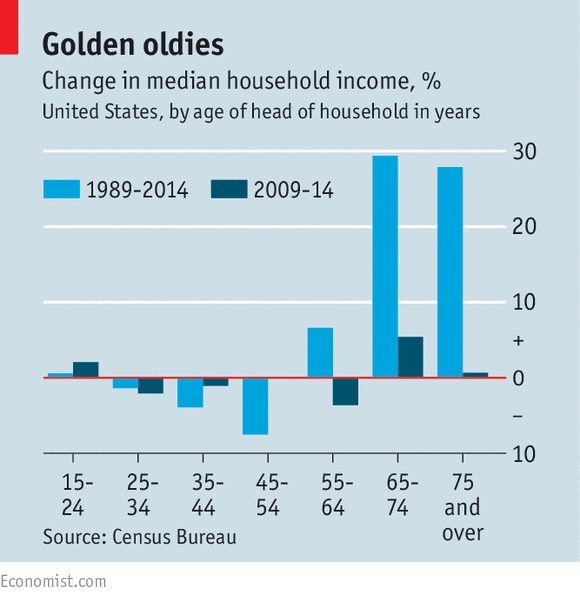
Real median household income in the US is only up 0.7% since 1989, but things aren’t as bad as they seem:
- households are 3.4% smaller (2.54 vs 2.63 people) so they need less income
- higher earners are much more likely to marry one another, which increases inequality between households, but not individuals
- real median earnings for an individual are up 13% since 1989
The bad news is earnings are flat since 2000.
The less bad news is that this is partly down to ageing.
- Since earnings peak in middle age, an older population will have lower average earnings.
- Households headed by someone aged 45 to 54 earned $71K in 2014
- Those headed by someone aged 65-74 earned only $45K
From 2010 to 2014, headline household income went up 0.3%.
- Using an age-weighted profile (tied to 2010 weights) gave an increase of 1.9%.
Despite this, today’s oldsters (65-74) have real incomes 30% higher than their 1989 equivalents.
There’s also a gender factor:
- women’s real median earnings are up 32% since 1989, while men’s are up only 4.5%.
So it’s likely that more women entering the workforce also reduced average rates.
When to quit

Tim Harford looked at knowing when to quit.
- Persistence is generally held in high regard, but sometimes knowing when to quit can be an advantage.
He quotes the example of game show Deal or No Deal, where players are made offers to stop playing by “the Banker”.
- When a large offer is turned down early, players refuse later and lower offers that are in fact fair.
- They have anchored to the initial high number, and developed a form of loss aversion to earning less than it.
People don’t like to quit when they are behind.
- This is why people sell their winners and run their losers, instead of doing the opposite.
- It’s also why nominal house prices are so sticky and refuse to go down.
And is also explains why people cash out bets while they are ahead, but stick with losing bets that get worse.
Tim also quotes an article by Daniel Davies, who showed that a losing portfolio of expert stock tips could be fixed by simply adding a 10% stop-loss rule.
Tim has three suggestions for identifying when to quit:
- ignore sunk costs and look only at future prospects
- persevere flexibly rather than stubbornly – quit a “hard thing” only at a natural break, and when you have another “hard thing” ready to replace it
- look at decisions as experiments – what have you learnt, and are you still learning? If so, it’s probably worth persevering.
Emerging markets
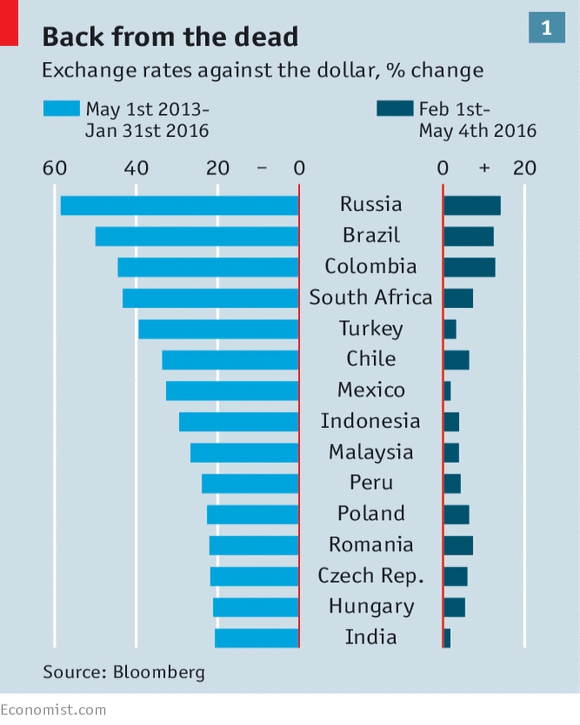
The Economist looked at the mostly fragile recovery in emerging markets (EMs) since February.
- The rouble, real and rand have risen most, having fallen most since May 2013.
Fears for China’s economy and the possible devaluation of the yuan have receded since the G20 meeting in February.
- The Chinese authorities introduced stimulus policies and capital controls.
- The Fed also backed away from its December suggestion that there would be four rate hikes in 2016.
- But eventually China will have to deal with its debt pile, and the Fed will raise rates again.
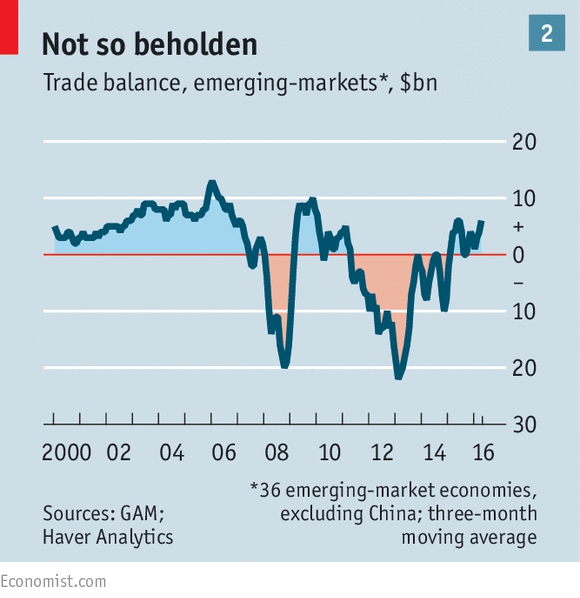
The last time EMs crashed (in 2013) the focus was on those economies with the biggest trade deficits and largest reliance on foreign capital.
- Now EMs are running a trade surplus, even after excluding China’s large surplus.
- The is mostly because imports have fallen rather than exports have risen, but that is the usual sequence.
Some observers worry that the countries that have rallied have little in common, and the rises have occurred across the board.
The greatest risks probably lie in those fairly rich EMs that supply China with part-finished goods (Singapore, South Korea and Taiwan). They would be hit by any further Chinese slowdown.
- Further Fed rate hikes would affect those with big current account deficits (Colombia, South Africa, Turkey) lots of dollar debt (Chile, Turkey again).
- Malaysia, Thailand and South Korea share China’s problem with rapid credit growth.
India, Indonesia and Mexico look best placed, or as the newspaper puts it, least worst.
China’s debt
Another article in the Economist provided more detail on the coming Chinese debt bust.
- Debt to GDP is up from 150% to 260% in a decade.
- This is usually followed by a bust or a slowdown.
- Problem loans are officially 5.5% of total lending, but actually much higher.
- 40% of new debt is used to pay interest on old loans
- in 2014, 16% of the 1,000 largest firms owed more interest than their pre-tax earnings
- the ratio of new debt to GDP growth is up to almost 4:1 from close to 1:1 back in 2007
It’s true that China’s problems are domestic rather than international, and the state owns both the big banks and the biggest debtors, but state control seems to have lost its way over the past year or two.
The Economist would like to see China plan for the looming turmoil.
- It should set a lower growth target than 6.5% pa and reserve its fiscal and monetary firepower for the crash.
But most of all, it needs to stop the increase in debts.
Hedge funds
The newspaper also looked at the declining returns on hedge funds, which lost 0.8% after fees in 1Q2016.
In 2015 they lost 1.1% and in 2014 gained 3%.
- So while clients have made 1% in nine quarters, management are up 4-5%.
These are tricky times for hedge fund strategies, with central bank policy and macroeconomic factors having a much larger than usual effect on markets.
- The constant switching between “risk-on” and “risk-off” that has been a feature of the last eight years is hard to time.

The paper mentioned the bet that Warren Buffett made in 2007 with Protege Partners that the S&P 500 would beat a hedge fund portfolio over ten years.
- Berkshire Hathaway’s annual meeting was last week, and Buffett brought up the bet which he looks certain to win.
There’s been far, far, far more money made by people in Wall Street through salesmanship abilities than through investment abilities. – Warren Buffett
Some would argue that hedge funds are designed to be less volatile than the 100% equity approach of the S&P 500.
- Unfortunately, a 60-40 equity / bond portfolio is also well ahead of the hedge funds.
In an era of low returns, low yields and low interest rates, 2% a year is too big a hurdle to overcome.
The hedge fund industry currently comprises 10,000 funds and $2.9 trn of assets.
- But probably not for long.
Brexit
This week’s Brexit briefing was about the potential impact on the City. ((This was the subject of my MBA dissertation more than 20 years ago – some things never change ))
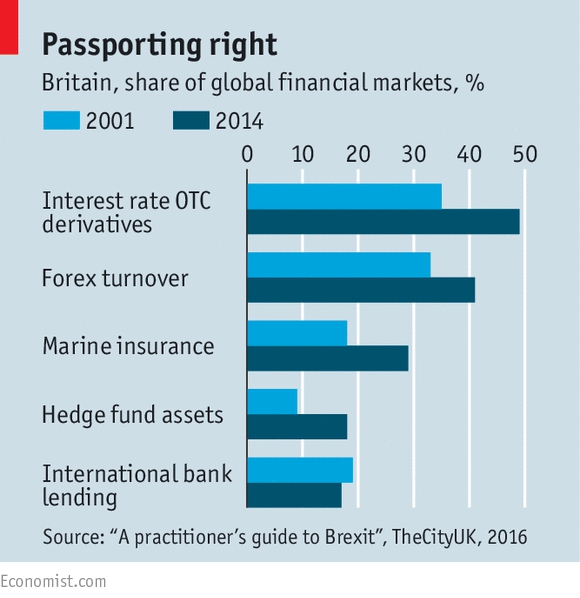
The UK has an outsize share of most financial markets, despite the lack of a single market in services within the EU.
- Financial services (plus related accounting and law) employs 2.2M people in the UK.
- There are 250 foreign banks in London.
- 12% of GDP, 11% of tax receipts and a trade surplus of £72 bn are down to finance.
London’s dominance has increased over the last 20 years, and Paris and Frankfurt would love to take away some of its business post-Brexit.
- A PwC study found that value-add post Brexit would shrink by 6% to 10% and 70K to 100K jobs would be lost.
Similar arguments were raised when the UK did not join the Euro.
- But this time “passporting” rights – which allow UK firms to operate throughout the EU without a local subsidiary – are at stake, and might prove more significant.
- The EU would also have legal grounds to move clearing and settlement of euro trades to within the EU.
Crony capitalism
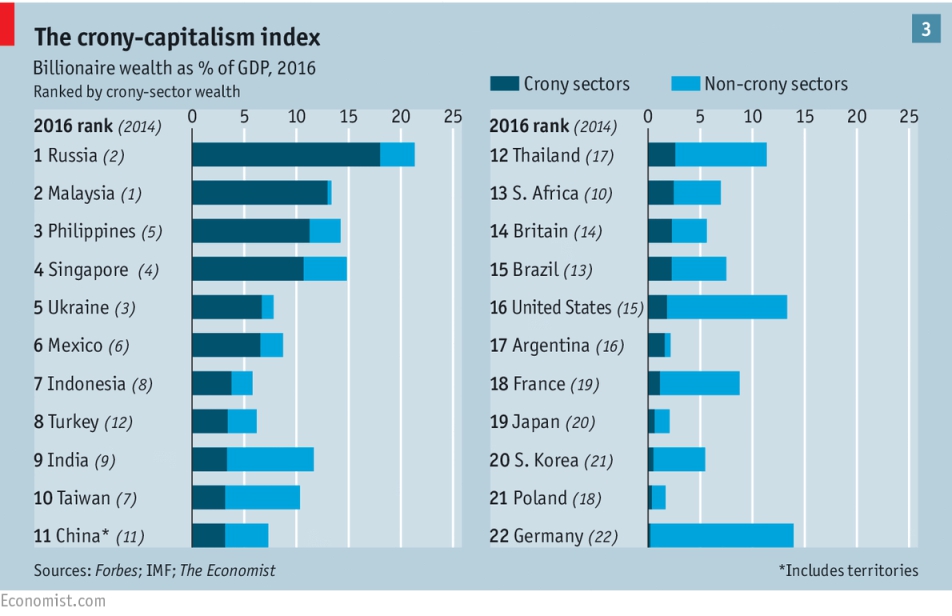
The Economist published a revised version of its crony capitalism index.
- Two years ago they found a surge in billionaire wealth in industries involving cosy relations with government (casinos, oil, construction etc).
- Globalisation since the 1990s appeared to have created crony fortunes relative to GDP, and to total billionaire wealth.

Now it seems that in general cronyism is on the decline.
- Commodity prices have tanked and emerging market currencies, shares and property are weak.
- But developing countries still account for 65% of crony wealth (yet only 43% of global GDP).
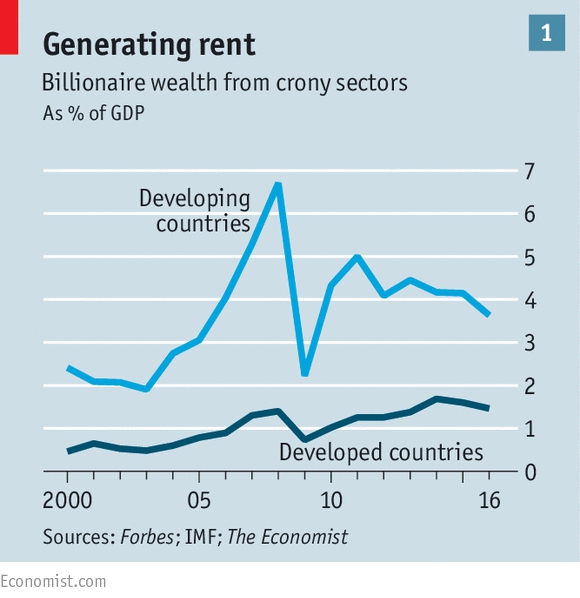
The top five countries for billionaire wealth as a percentage of GDP were Russia, Malaysia, the Philippines, Singapore and Ukraine.
- India is the main country to have cleaned up its act.
- Britain comes in at number fourteen, two places worse than the US.
- Germany was last, at number 22.
Oil companies
The Economist also looked at the future changes to the business model of oil majors.
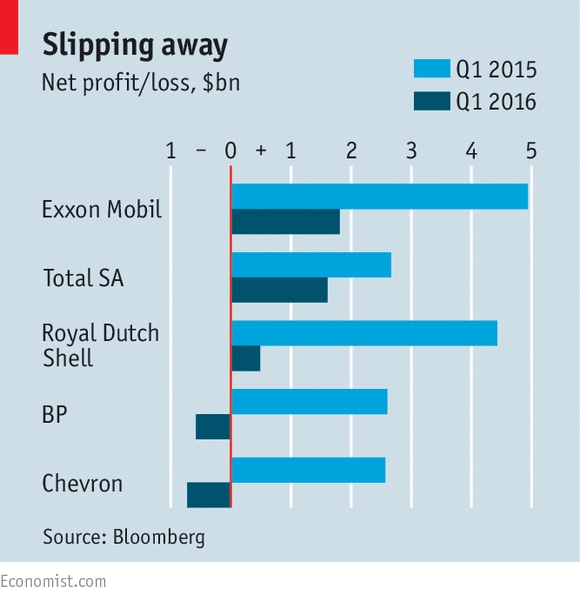
With the oil price having bounced from $30 a barrel to $45, many of the majors are now back in profit and their share prices are up.
- But climate change, resistance to pollution and alternative energy sources mean that future demand is uncertain.
Returns at the moment are very low – 3.8% on average capital employed for Shell in results out last week.
- This was below the firm’s cost of capital.
- Shell also has net debt of $69 bn.
Cost-cutting is becoming a feature of the industry, and investment products now have to work with a low oil price rather than the $100 a barrel used until recently.
- Relentlessly pursuing new reserves that are too expensive to develop is no longer an option.
- Low costs wells and renewables are the future.
Until next time.
Mike Rawson
Mike is the owner of 7 Circles, and a private investor living in London. He has been managing his own money for 40 years, with some success.