Winning Spread Betting Strategies – The Spread Betting Investor

Today’s post is our first visit to a new book – Winning Spread Betting Strategies by Malcolm Pryor.
Contents
Malcolm Pryor

Malcolm Pryor is an active spread bettor and investor, a trading coach (he runs seminars), and the author of several books on spread betting.
- He also has a couple of websites: www.spreadbettingcentral.co.uk and www.sparkdales.co.uk
- He is a member of the Society of Technical Analysts and the International Federation of Technical Analysts.

Winning Spread Betting Strategies
There are 7 strategies covered in the book:
- two are for bull markets
- two are for bear markets
- two are for sideways markets
- and one is for all markets.
Target audience
The book is aimed at investors with some familiarity with spread betting and trading in general, but before presenting the strategies in detail, Malcolm provides some introductory information.
Key concepts that you need to be aware of include:
- getting trading ideas from charts
- going short as well as long
- trading currencies, commodities and indices as well as stocks
- pre-determining exit points before a trade is taken
- limiting risk per trade to a percentage of trading capital.
Rather than day traders, the book is aimed at someone that Malcolm calls the “spread betting investor”
Investors and traders
The book covers spread betting trading strategies designed to take advantage of price moves that last from a couple of weeks to a few months.
- Because of this, the charts in the book (which all come from ShareScope) are mostly weekly charts.
For Malcolm, the only difference between investors and traders is timescales.
- I would argue that (short-term) traders are also much more likely to use technical analysis and leverage than are (long-term) investors.
Indeed, Malcolm only uses technical analysis:
Technical analysis is the foundation for every trade. I trained as an accountant and and know how to look at balance sheets, but technical analysis is all I need – it incorporates all relevant fundamental information.
So spread-betting is mostly used by traders.
- But it has tax advantages for investors who have used up their SIPP and ISA allowances (since betting gains are free from capital gains tax).
- And it allows you to go short easily.
Malcolm uses the terms investor, trader and spread-bettor interchangeably in the book, but I’ll try to stick to investor.
Three strategies
Malcolm highlights the usefulness of spread betting strategies by comparing three investors.
They each invest in the FTSE All-share Index over 10 years:
- they begin on 19 October 1998 with £20K, and stop on 17 October 2008
- transaction costs are ignored
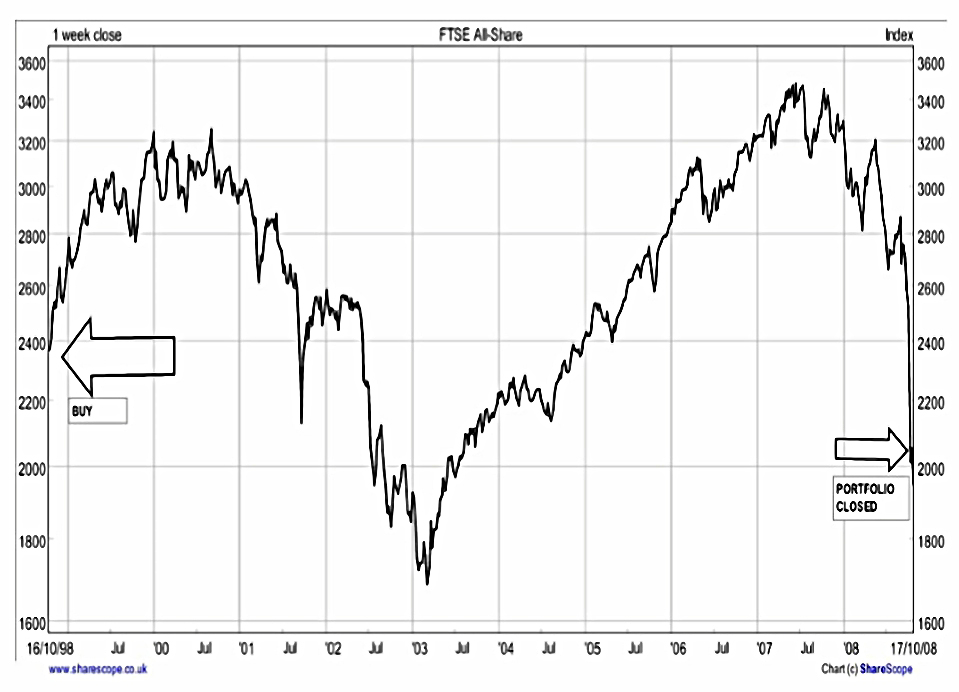
The first investor uses buy and hold.
- He buys at 2348 and sells at 2051, losing 13%, to end up with £17.5K.
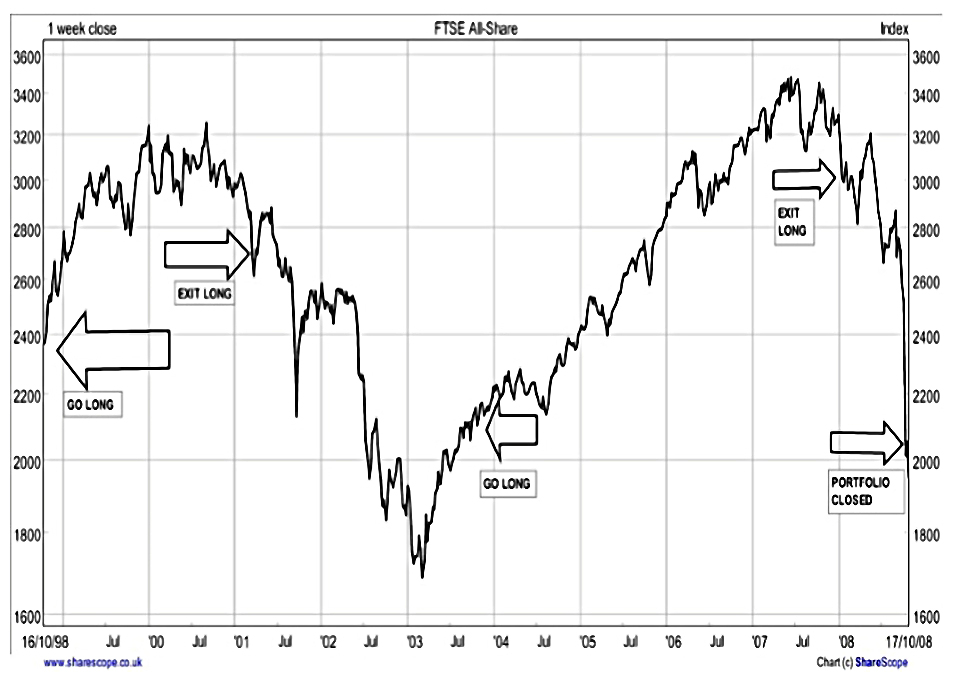
The second investor sits out the down-trends.
- Malcolm doesn’t supply a definition for when a downtrend begins at this stage.
- 1 – Bought at 2348, sold at 2696, gain 15%, ending capital £23.0k.
- 2 – Bought at 2095, sold at 3003, gain 43%, ending capital £32.9k.
- His overall increase in capital was 65%.
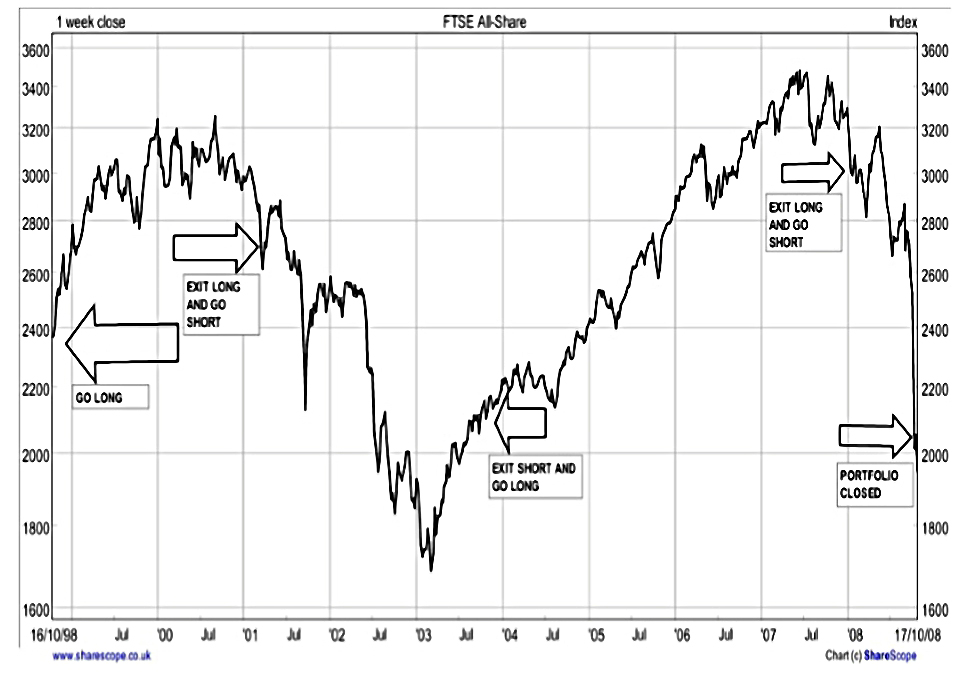
The third investor is long in bull markets and short in down markets.
- 1 – Went long at 2348, exited long at 2696, gain 15%, ending capital £23.0k.
- 2 – Went short at 2696, exited short at 2095, gain 22%, ending capital £28.1k.
- 3 – Went long at 2095, exited long at 3003, gain 43%, ending capital £40.3k.
- 4 – Went short at 3003, portfolio closed at 2051, gain 32%, ending capital £53.0k.
- His overall increase in capital 165%.
The Spread Betting Investor
Malcolm’s “spread betting investor” – the subject of the book – uses spread bets for trades that last from several weeks to several months.
- He has a £20K account, and
- He will only risk 1% (£200) per trade.
- An attractive reward to risk ratio is needed to place a trade (the ratio is not defined at this stage).
- He bets long and short, in bull and bear markets respectively.
- He bets on stocks, indices and the major currency pairs (no commodities are mentioned).
- Trading decisions are made at the weekend – when the market is closed – from weekly charts.
- Most entries and exits are made either via stop orders or at the open on Monday morning.
Trading rules
- we don’t need to be long all the time
- we can be in cash, or short if that’s what our market analysis says
- we don’t need every trade to be a winner
- 50% winners is fine, so long as the winners are bigger than the losers
- short is no more dangerous than long
- it’s risk management that’s important
- you must use stops when spread-betting
- investing is a business not a pleasure or a thrill
- only the best investors can afford not to have a system (a methodology)
The process
Malcolm describes his nine-step process for trading:
- Find an edge.
- You need a methodology, like the seven strategies in this book
- Assess market conditions.
- Go long in bull markets and short in bear ones.
- In sideways markets, do both
- Work out your maximum loss on before you invest.
- 1% is a good starting point
- Work out how you will know when you are wrong.
- This is usually where your stop loss will be, and so it defines your maximum loss.
- Work out your minimum profit target
- Technical analysis will normally give you a target price.
- Make sure this potential profit is at least twice as big as your maximum loss.
- You might decide that you want to use a bigger ratio than that.
- Have a time rule for exiting (optional)
- If the bet doesn’t reach either your profit target or your stop loss, you might want to reallocate your capital after a given length of time.
- You could also use trailing stops which rise with the stock price.
- Check your progress regularly, and adapt
- Unlike regular, long-old stock investing, you shouldn’t ignore your spread bets.
- You need to check how your “portfolio” is doing.
- But you also need to check which of your strategies are proving profitable.
- Malcolm recommends checking the latter at least once a quarter. (( In practice, every time you place a new bet you will also be checking the performance of your portfolio ))
- Have a written plan
- For the short term, this will be like a trade diary.
- For the longer term, it will cover your “systems”, and their target win/loss ratios, average win and loss, profitability and maximum drawdown.
- You might also have contingency plans for extraordinary market movements, loss of internet, or illness.
- Accept it is down to you and no one else
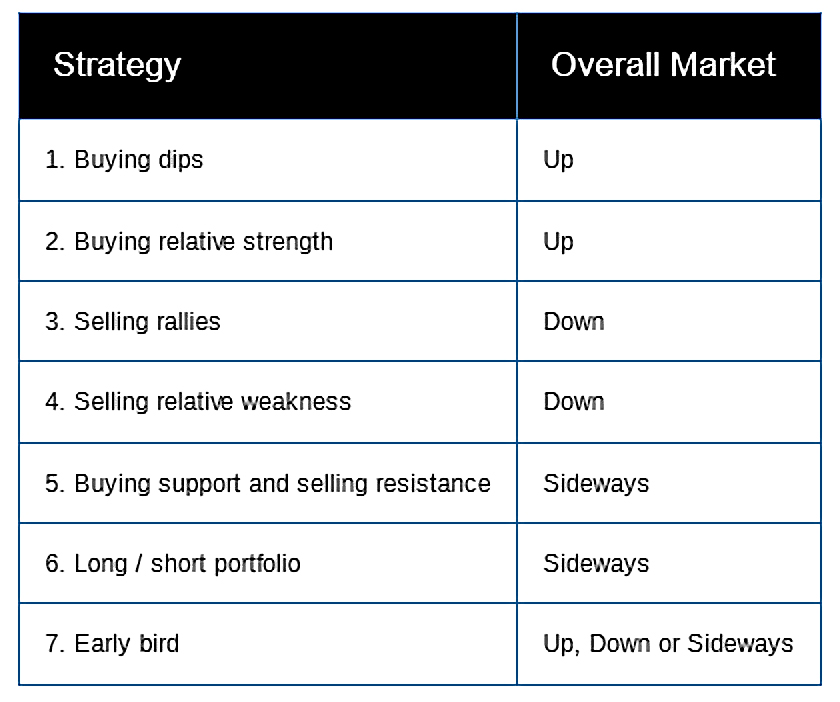
Seven strategies
Here once again are the seven strategies that we will meet later in the book:
- Buying dips (Up)
- Buying relative strength (Up)
- Selling rallies (Down)
- Selling relative weakness (Down)
- Buying support and selling resistance (Sideways)
- Long / short portfolio (Sideways)
- Early bird (Up, Down or Sideways)
Up, down and sideways
Malcolm describes how to tell what kind of market we are in:
- Visual inspection
- Sometimes it is obvious whether a price has been going up, down or sideways.
- Most technical analysis indicators are just derivatives of open/high/low/close/volume data.
- ADX (Average Directional Index)
- This is normally set at 14 periods, but Malcolm uses an 8 week ADX.
- Moving averages
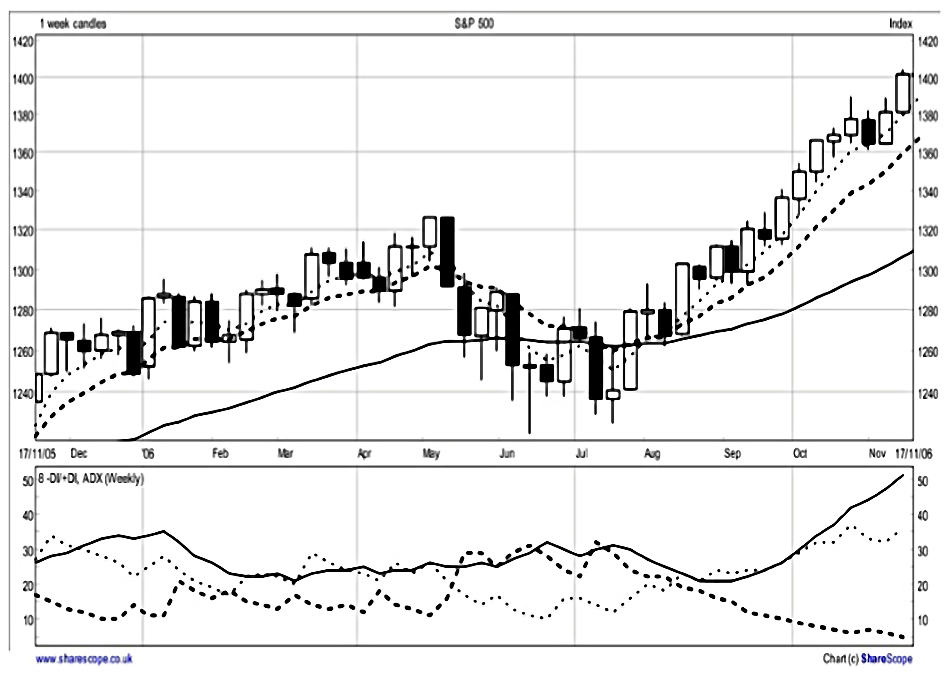
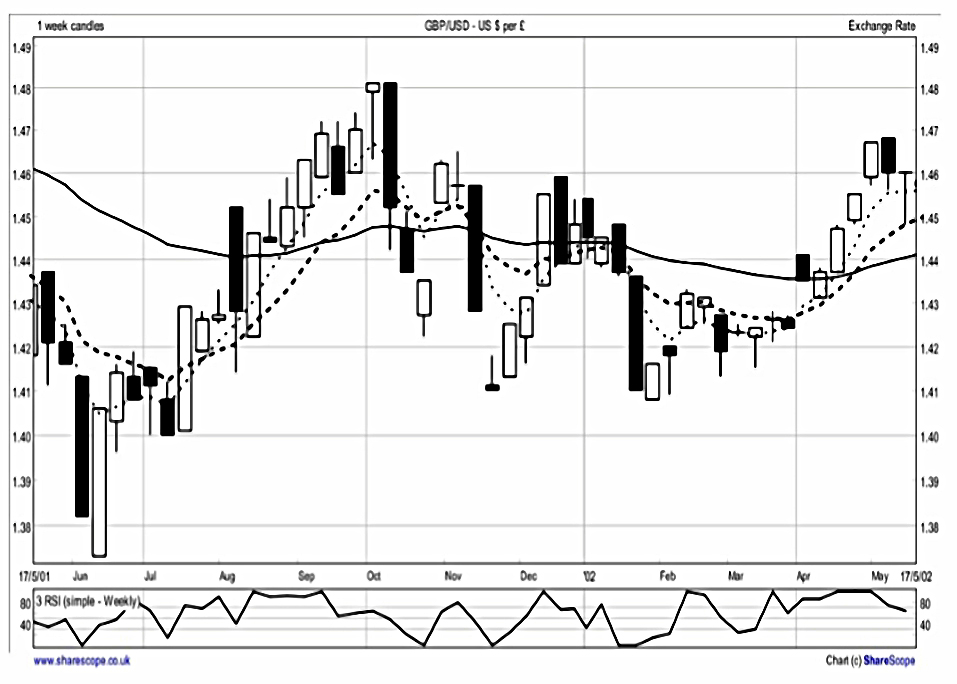
ADX
ADX is new to me, so we’ll go through Malcolm’s definition.
ADX has three components:
- +DI (dots) tracks how much price action has been above the high of the previous period, so it is high in bulls and low in bears
- -DI (dashes) tracks how much price action has been below the low of the previous period, so it’s high in bears and low in bulls
- ADX (solid line) is the difference between +DI and -DI
Malcolm uses the tool in an easy-to-understand way:
- +DI higher than -DI = bull
- -DI higher than +DI = bear
- the two lines crisscross each other = sideways
When ADX is above 25, it’s a significant (real) bull or bear. (( Note that ADX is positive regardless of the direction of the trend ))
- above 25 and rising = continuing trend
- above 25 and falling = consolidating / stalling / reversing trend
Moving averages
Malcolm uses exponential rather than simple moving averages.
- Exponential MAs have a greater weighting to more recent prices.
He uses MAs on weekly closing prices.
- He uses a 4 week, a 10 week and a 40 week MA.
- These are broadly the same as 20-day, 50-day and 200-day MAs.
Malcolm uses MAs to define five market types:
- Up-trend, flowing: 4W > 10W > 40W, all three averages pointing up
- Up-trend, stalling: 4W > 10W > 40W, fewer than three averages pointing up
- Down-trend, flowing: 4W < 10W < 40W, all three averages pointing down
- Down-trend, stalling: 4W < 10W < 40W, fewer than three averages pointing down
- Sideways: everything else
Stalling trends can be used as a buy or a sell signal, depending on the strategy.
Example charts
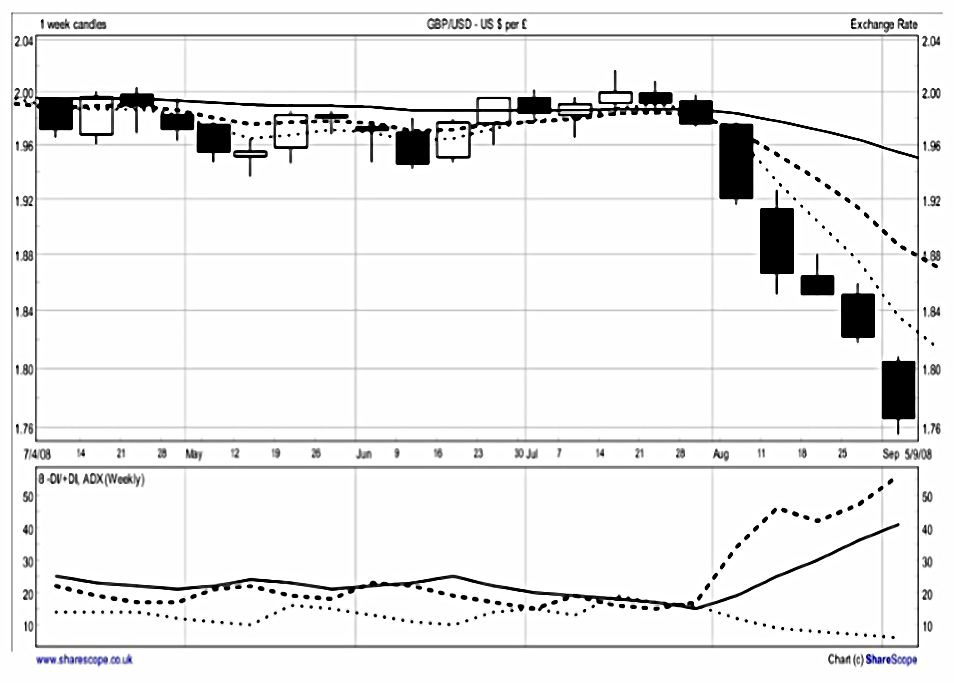
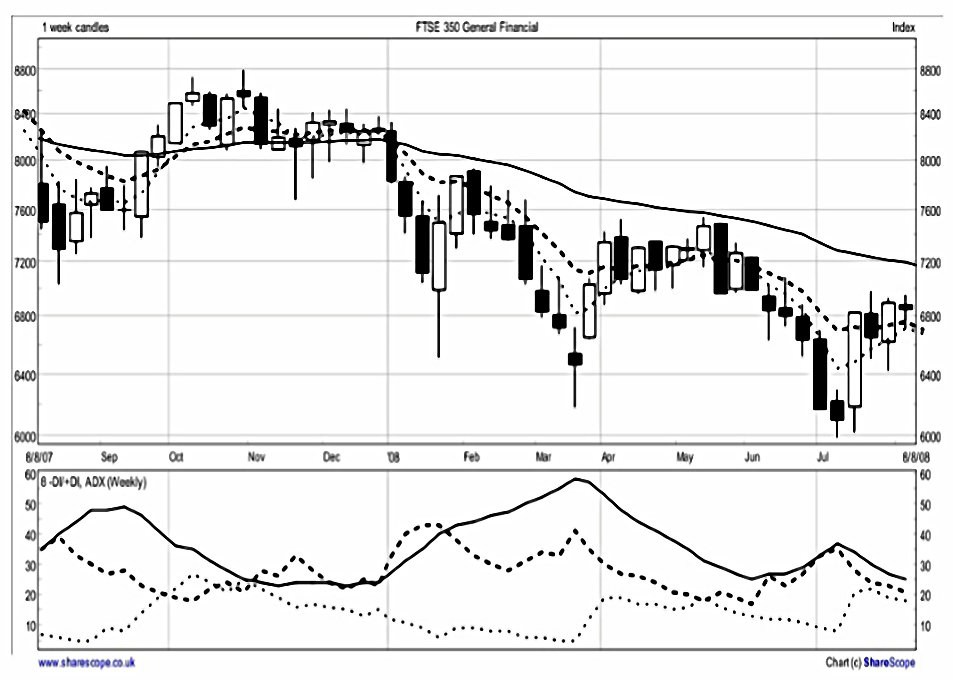
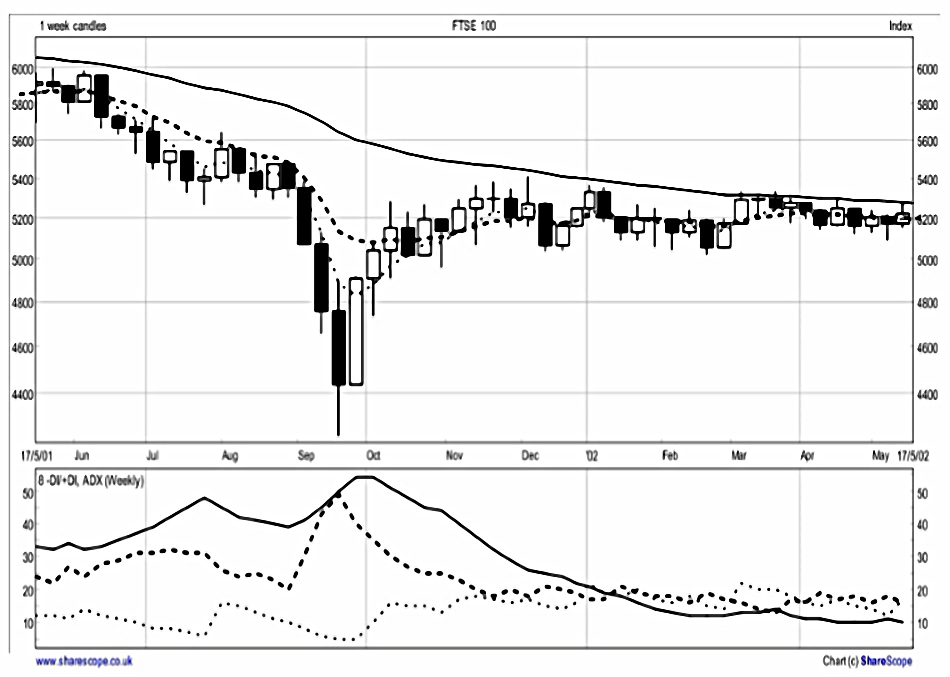
Here are example charts for the five markets, showing the MA and and ASK conditions:
Flowing up-trend
Stalled up-trend

Flowing down-trend
Stalled down-trend
Sideways market
RSI for the short term
Malcolm likes RSI (Relative Strength Index) as a short-term indicator.
- In a sideways market it can be used to trade in and out (sell when RSI is high levels and buy when it is low).
- In trending markets high / low readings can persist, and RSI is better used to corrections to the trend (which are opportunities to get on board)
- A high RSI is 70 to 100, a RIS is 0 to 30.
- The normal settings are 14 and 9 periods, but Malcolm uses a 3 period simple weekly RSI.
Other tools
- Malcolm often uses a break of the previous week’s high or low as a signal to enter a trade.
- He also looks for outperformance or underperformance compared to a stock’s sector or the overall market (Relative Strength, not to be confused with RSI).
- He also uses support and resistance
- support is a price level where in the past price has stopped going down
- resistance is a price level or area where in the past price has stopped going up.
- Weekly pivots (either a weekly low with two higher lows either side, or a weekly high with two lower highs either side) provide significant support / resistance.
- Momentum measures the rate of change in a trend.
- The theory is that changes in momentum precede changes in price direction.
- Malcolm uses the weekly close with the close from 6 weeks before (as a percentage).
- Malcolm also uses divergence, where an indicator moves in the opposite way to the price.
- For example, if the price makes a new low but the indicator doesn’t, this can be a sign that the down-trend may be about to end.
Trading concepts
At the end of the preliminary section of the book, Malcolm covers a few more concepts that you should be familiar with before you start trading:
- Stops, including trailing stops
- Malcolm likes to use the low or high of the previous two weeks
- an alternative is to use a multiple of Average True Range (ATR) (( This is what I normally use ))
- Cost of carry
- this interest charge is excluded from the examples in the book
- it will reduce profit on long trades and add to profit on short trades.
- Pyramiding (adding to winning positions – never to losing positions)
- for example, sell (buy) 2 units initially- add a further unit after the price has moved the same distance as from entry to initial stop (additions should always be smaller than the initial position)
- move the stop to the original entry
- the first 2 units can do no worse than break even, and the risk on the extra unit is half the initial risk.
- Bet size
- Malcolm recommends 1% of (betting) capital.
- Shorting
- This can be tricky in stock dealing accounts, but it’s as easy as going long in a spread betting account.
- Diversification
- Drawdown (size of losses)
- This is measured from peak to trough, as a percentage (therefore in hindsight only).
Conclusions
We’ll leave it there for today.
- We’ve covered just over a quarter of the book.
- We should be done in three more articles, or maybe two if the strategies have elements in common.
It all looks quite promising, but the proof is in the pudding.
- I’ll be back in a few weeks with the first of Malcolm’s strategies.
Until next time.
Mike Rawson
Mike is the owner of 7 Circles, and a private investor living in London. He has been managing his own money for 40 years, with some success.


I have had this book for some time but have been too occupied with other things to apply it. It takes a while to methodically check strategies. At the outset I am not impressed with the three versions of results from FTSE over 10 years where the source of the signals is not specified. Suppose you used the 20MA or EMA on the monthly chart, then you would get similar results over the period, and it looks impressive. Try applying the same method to the next nine years up until the present and there are problems. Pryor concludes this exercise with “Some cynics may say that it is always easy to pick entry and exit points with hindsight!” Too right. It is possible to time the markets but only with robust methods and his does not appear to be such. He has selected a period when the market comprised a series of extended trends. If we knew that markets from today will spend the next ten years in a similar series of trends it would be most helpful.
I am always grumpy about profit calculations which exclude trading costs. It is not difficult, especially with spread betting to build in pretty accurate costs. Those who give advice on trading almost without exception emphasise the need for stops. My experience and that of traders I know is that they can be helpful when used judiciously but that particularly in spread betting can lose you money because of spikes, some of which occur without confirmation from other sources, i.e. they can be peculiar to the spread betting company. On the whole I use mental stops, only placing real ones in about a third of trades.
There may be much of value in this book. I should like to see more reference to the things that can go wrong on the unknown hard right edge. I suppose it would be harder to sell books that did that.
For once, the post is up to date with where I’ve got with the book. I am currently planning to apply it to real trades, but realistically not until 2018.
I’ve seen several people recommend his books, so I thought that I’d give it a go.