
Trade like Mulvaney

Today’s post looks at a couple of articles from Concretum Research on how to trade (almost) like Paul Mulvaney.
Contents
Concretum Research
Concretum Research (CR) is the research division of Concretum Group, a quant-driven proprietary trading firm based in Lugano, Switzerland. I came across them quite recently via a recommendation on Substack.
The starting point for the replication exercise is the famous quote from Richard Dennis (of the Turtle Traders fame):
You could publish trading rules in the newspaper, and no one would follow them. The key is consistency and discipline.
Mulvaney
Paul Mulvaney’s name didn’t immediately ring a bell with me, but it turns out he was interviewed by Michael Covel in a book I reviewed back in 2019.
He is the CIO of Mulvaney Capital Management (MCM), a London-based CTA that he founded in 1999.
- Net of fees, the fund has increased 100 times since then.
The firm says that it has used the same systematic approach throughout, based around the idea that markets adjust gradually to changes in fundamentals, and those adjustments drive trends.
Covel (who has written several books on trend following) is a big fan of Mulvaney, and also of the reverse-engineering process that Concretum attempts in these articles.
Prior assumptions
CR have looked at interviews, institutional presentations and MCM’s monthly commentaries to come up with five clues as to how MCM operates:
The Mulvaney Capital Global Diversified Program trades a universe of 45 futures markets, spanning equities, interest rates, currencies, energy, metals, softs, and agricultural and livestock contracts.
CR notes that MCM trades beyond the most liquid contracts, citing a famous cocoa trade of 2023.
- They will use around 40 futures markets for the experiment.

Mulvaney’s buy-sell engine is likely a canonical Donchian channel breakout: new N-day highs generate long entries, new N-day lows generate short entries.
CR has a chart from MCM showing this.
- It also states that stops are widened as winning trades progress and no price/profit targets are used.

Mulvaney himself has said (in an interview with Covel):
There is no profit taking per se. We only exit on stop-losses, because profit taking would interfere with the unlimited upside potential we have, in theory, on every position.
Positions are held for six months on average, so the Donchian lookback will not be a short period.
Mulvaney does not seem to deploy his full position at the initial breakout. Instead, exposure is built up in stages as the trend develops, with additional contracts added at what seem to be predefined profit thresholds.
Exits appear to be dictated by a [volatility-based] trailing stop that moves only in the direction of the trade. The mechanics of the stop itself seem quite sophisticated.
Here’s another quote from Mulvaney:
Our trailing stops are initially placed at levels which the system estimates have certain probabilities of being penetrated over various periods of time into the future. On reaching full position size, our stop losses continue to be repositioned daily in accordance with a volatility analysis.
CR uses the midline of the Donchian channel as the trailing stop/exit.
As the trend develops and the channel range expands, the midline moves progressively further from the channel extremes, accommodating rising volatility without any additional scaling parameter.
CR also uses a fixed initial stop, closer than the midline.
This is intended to capture the possibility that Mulvaney opens positions with a tighter initial risk threshold.
Mulvaney suggests he commits only “a small percentage of equity” per trade, which is consistent with a canonical equal-loss sizing methodology: define a maximum acceptable loss at the portfolio level and size each trade such that, if every position hits its stop simultaneously, the total portfolio loss does not exceed that pre-determined threshold.
Questions to answer
CR lists a few “degrees of freedom” for the experiment:
- Is risk split equally across all markets, or first split by sector and then by underlying markets?
- What is the Donchian look-back period?
- What is the initial fixed stop?
- How does the pyramiding into winning trades work?
- Are shorts and longs scaled equally?
- Are trades executed on the same day a signal fires, or the next day?
Methodology

CR creates a grid of 4,320 different trend programs, using every combination of reasonable values for the degrees of freedom.
- These programs then generate monthly AUM values after volatility scaling to match the MCM fund volatility.
These numbers are then regressed against Mulvaney’s monthly returns using least squares. A higher R² is a better fit.
The best-fit synthetic CTAs achieve R² values in the range of 0.71 to 0.73, representing a ~45% improvement in explanatory power over the SG Trend Index, with correlations sitting tightly between 0.84 and 0.85.
Here are the top 10 best-fitting strategies:

And here are the results (pre-fee) against Mulvaney (post-fee):

Conclusions
- The Donchian lookback appears to be six months (126 days)
- Shorts are evenly matched to longs
- Execution is within 1 to 2 days of the signal
- Risk is allocated equally across all markets
- The initial stop is offset by one-third of the Donchian channel range from the entry signal
There is no comment on the pyramiding strategy.

CR also noted that Mulvaney has outperformed the replication (even after fees) in the most recent four years.
- The famous cocoa trade may be partly responsible for this.
- Differences in the market universe and the pyramiding strategy are also likely to be partially responsible.
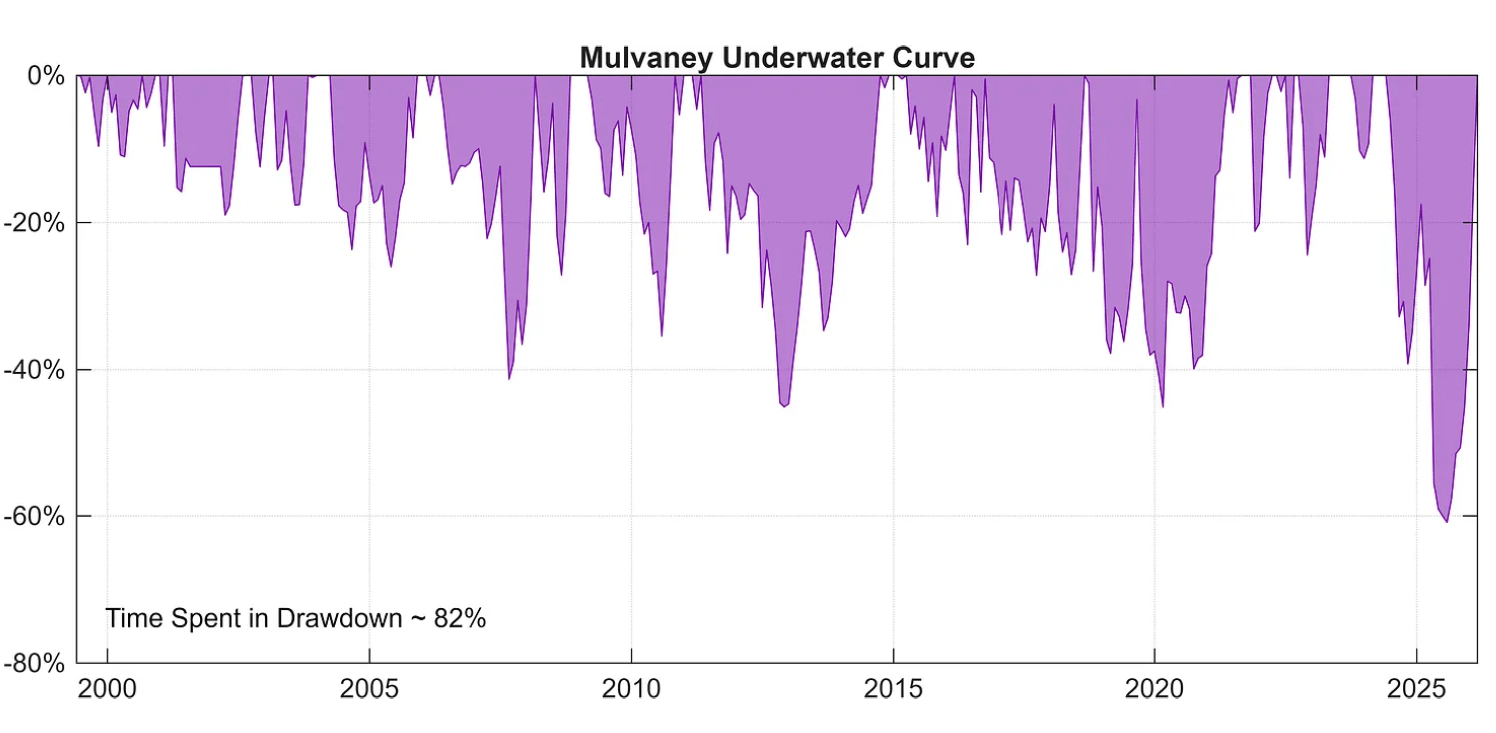
CR also notes that Mulvaney spends 82% of months in drawdown, at an average of 15% down, but with some very serious setbacks.
Mulvaney has faced that pressure for a quarter of a century and never acted on it. Such discipline is not a footnote to his track record: we believe it is a core ingredient of it.
Follow-up
After receiving feedback from their readers, CR published a second post in May 2026.
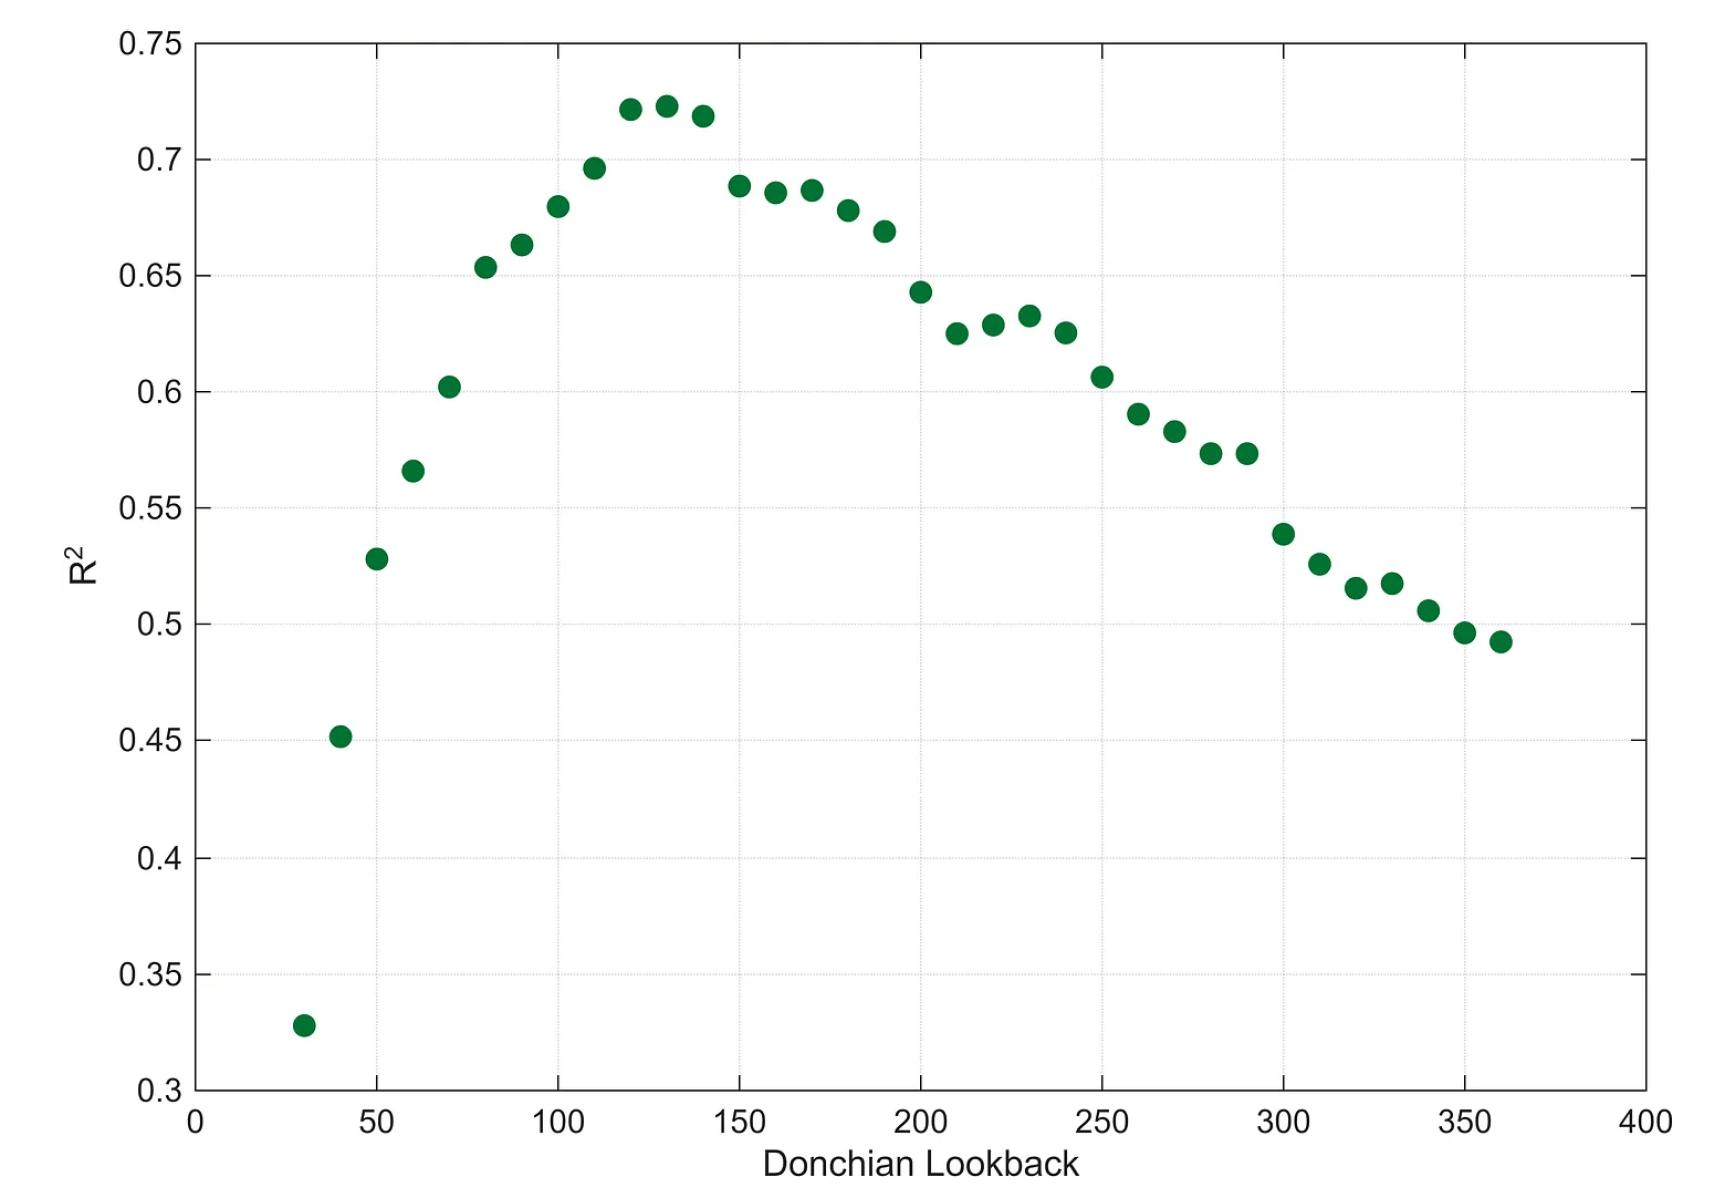
Using their most successful replication, they analysed different lookback periods.
- The optimum of 126 from the previous work was their shortest option, so it was possible that shorter periods might be more effective.
But in fact:
The best goodness of fit is clearly achieved for lookback periods between 120 and 140 days, with a peak at 130 days. Mulvaney does not engage in short-term trend following.
People also asked for trade-level stats:

CR has a higher win rate (35% vs 25%) and a shorter holding period (80 days vs 180 days). There are two explanations:
- CR treat pyramiding trades as discrete rather than part of the original trade
- CR uses a simpler Donchian stop-loss rather than the probabilistic method used by Mulvaney
CR also notes that the way Mulvaney talks about trades suggests he uses discrete rather than continuous signals.
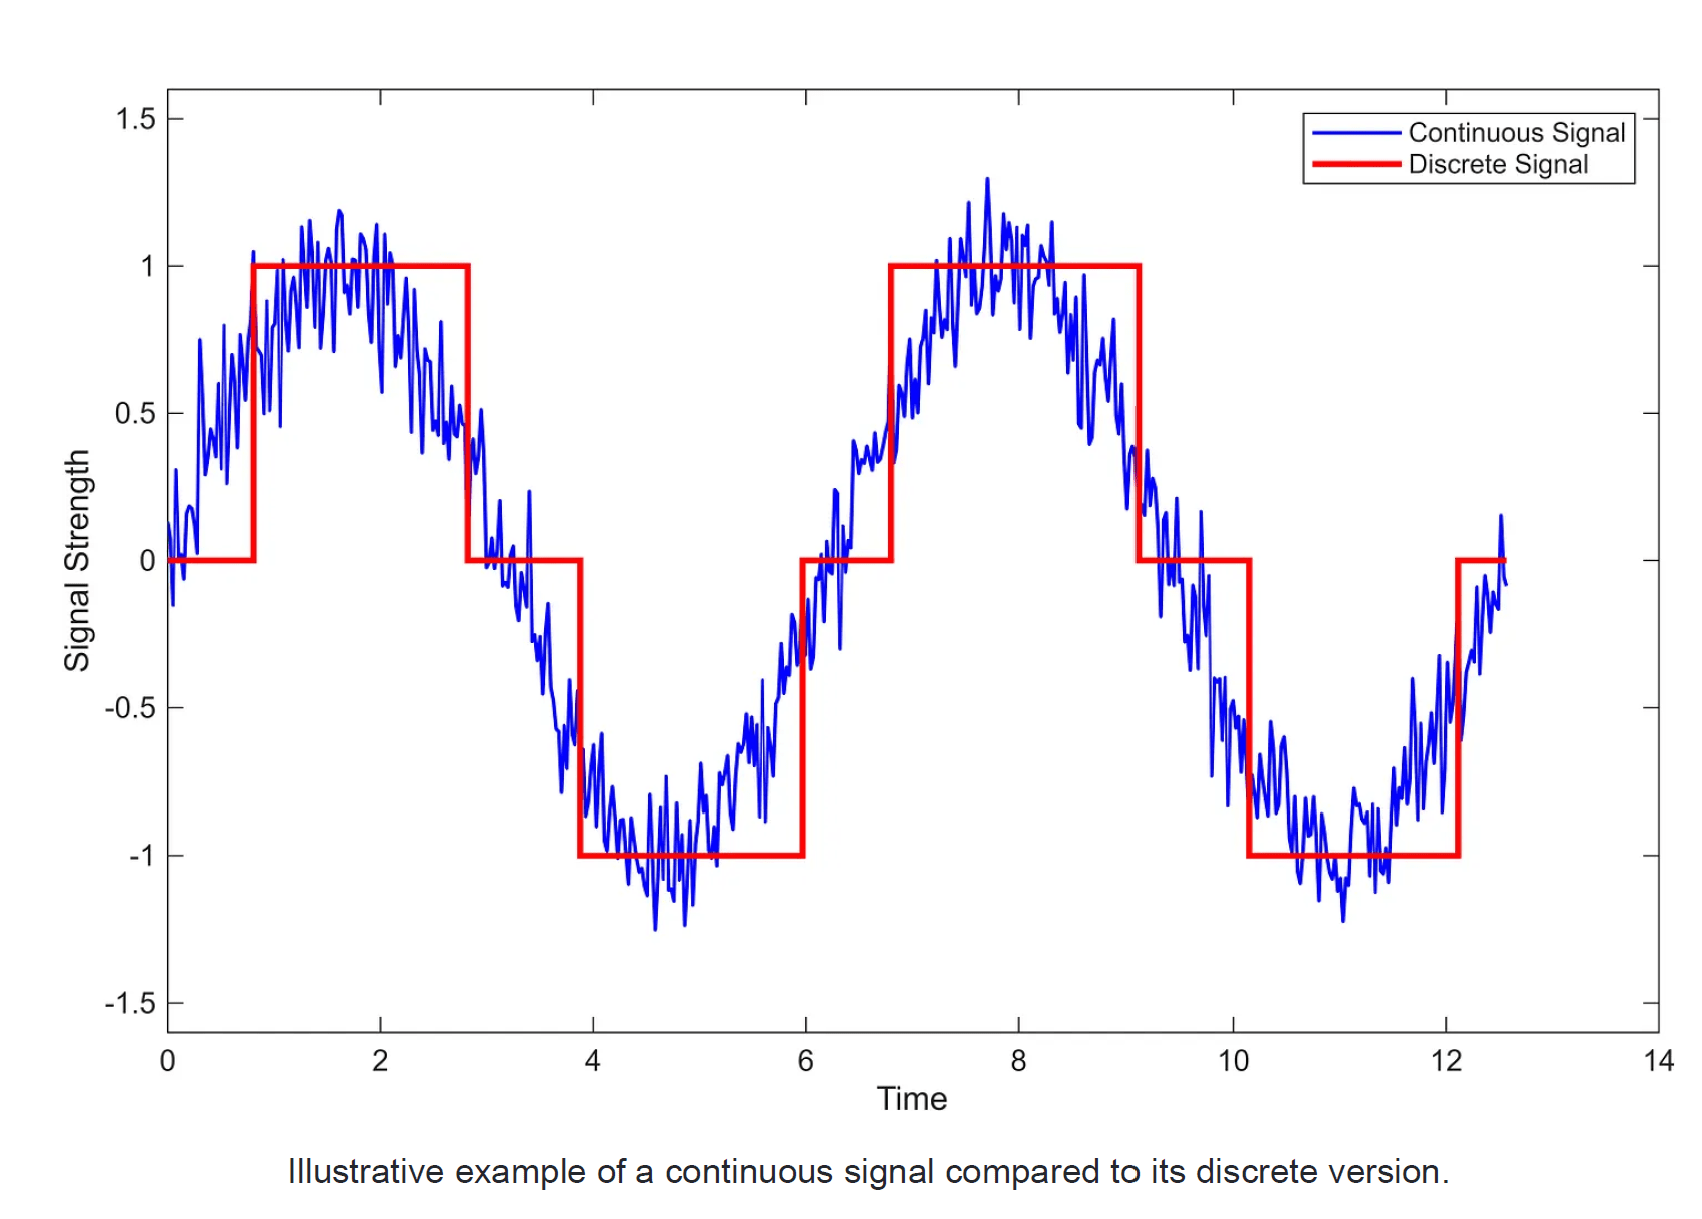
This distinction has long been debated in the trend-following space, with thoughtful practitioners on both sides.
Conclusions #2
This has been great fun, and actually looks like a usable method (if you have the stomach for the drawdowns).
- I’ll be on the lookout for more posts of similar quality from CR.
That’s it for today.
- Until next time.
Mike Rawson

Mike is the owner of 7 Circles, and a private investor living in London. He has been managing his own money for 40 years, with some success.