Stan Weinstein’s Stage System 1 – Charts and Buying
Today’s post is our first visit to a new book – “Secrets for Profiting in Bull and Bear Markets.” Welcome to Stan Weinstein’s Stage System.
Stan Weinstein
Stan Weinstein wrote a single text book way back in 1988, and until this weekend I’d never read a page of it.
- I’ve read a lot of investment books over the past thirty-plus years, and to have missed one that’s been around for so long is a surprise to me.
- Even more so given that the book has lasted – people still sing its praises.
Then when I started reading, I understood a little more.
- Stan’s book doesn’t have a catchy title – it’s called Secrets for Profiting in Bull and Bear Markets.

The “secrets” revolve around identifying the Four Stages of stock price movement.
- So whenever you hear a trader talking about Stages, he’s probably read Stan’s book.
Stage 1 is called “forming a base” and Stage 2 is where the price takes off.
- So those traders talking about “trading bases” and “looking for Stage 2” have also read Stan’s book.
Although his book is going strong, Stan himself seems to have disappeared.
- He used to run a service called The Professional Tape Reader, and later on he ran Global Trend Alert.
- But he doesn’t appear to have been active over the past decade
There’s a lot on the web about his system – and even a fan site or two – but Google finds no trace of him personally.
- And he doesn’t have a Wikipedia entry.

I did manage to find a more recent photo than the one on the cover of the book.
Charts
It’s not a short book – 350 pages – but it is quite breezy, and it includes a lot of charts.
- So I hope to cover it in four or five articles – let’s see how we get on.
Stan is pretty much a 100% technical trader – for him everything is in the price (and volume).
- The motto of his Professional Tape Reader service was “The Tape Tells All”. (( For younger readers, in the days before computers, stock prices used to be printed on a constantly spooling tape, known as the ticker ))
Having said that, his thinking is very much at the “discipline, consistency and hard work” end of the spectrum.
- This is not a “get rich quick” book.
Here’s a quick summary of his philosophy:
- Never buy or sell without checking the chart.
- Never buy on good news, especially if the price has already risen.
- Never buy a stock that seems cheap after getting smashed. (Don’t catch a falling knife.)
- Never buy a stock in a downtrend.
- Never hold a stock in a downtrend, regardless of how low the PE is. (Cut your losses.)
- Be consistent – if you are buying and selling in similar situations, there’s something wrong with your discipline.
The first section of the book is all about introducing the reader to chart patterns and to the language of technical trading.
- We’ve covered a lot of this in our introductory series on Technical Analysis, so today I’ll concentrate on things that aren’t included there.
I will include some of the more useful diagrams to summarise what Stan is covering.
Here’s a good one to get started with:
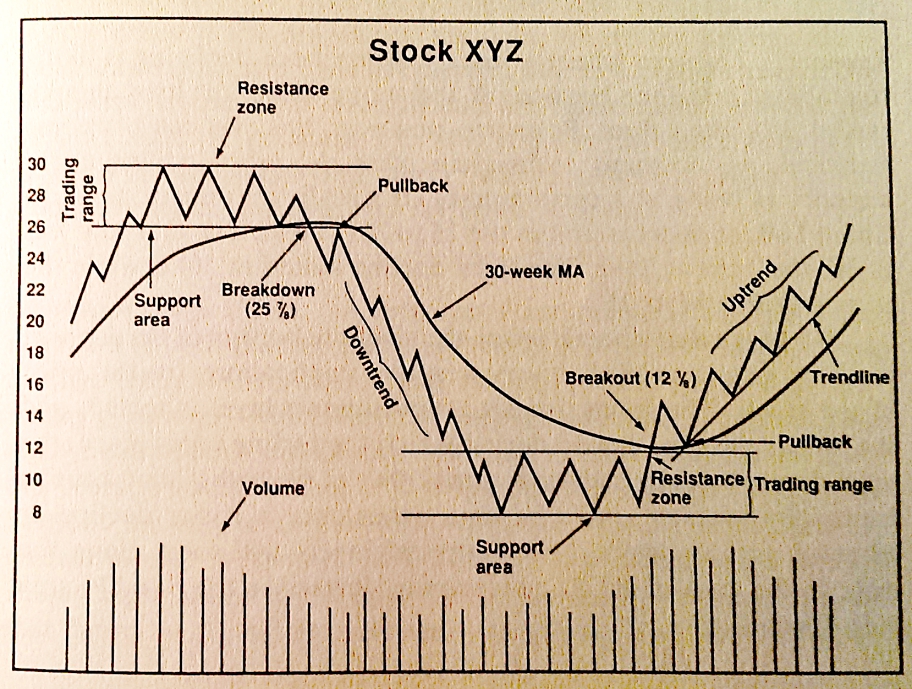
You need to make sure that you understand the following terms:
- Support and Resistance (Stan also calls this Supply)
- Trading Range
- Volume (number of shares traded)
- Moving Average (MA)
- Stan likes the 10-week MA for short-term trading, and the 30-week for “investing”.
- Note that Stan uses MAs based only on Friday night closes, not all the trading days.
- So his 10-week is not the traditional 50-day MA, and his 30-week is not the 150-day.
- Stocks below their 30-week MA should never be bought, especially if the MA is rising.
- Similarly, stocks above their 30-week MA should never be shorted.
- Buy stocks that break out through resistance and move above a 30-week MA that is rising (and ideally have increasing volume).
- Breakout and Breakdown
- Pullback
- Trendline
- Uptrend and Downtrend
- Trader (someone who wants to catch two- to four-moth moves) and Investor (someone who invests for up to a year)
- Short term (one to six weeks), Intermediate term (two to four months) and Long term (four to twelve months)
- Relative strength
- The price movement of a stock relative to the index (the market)
- Note this is not the RSI oscillator
- Short selling (shorting)
Chart types
In the next section, Stan talks about chart types, and describes some key features.
- He likes simple bar charts, which show the high, low and close, along with volume.
- Most charts today also show the open (hence the OHLCV notation) but Stan doesn’t seem too interested in this.

He also likes point and figure charts which were popular when I started trading, but which you don’t see much anymore.
- These record only prices changes, ignoring time and volume.
- Because of this they are very compact, easily recording years of data.
- They are particularly useful for identifying support and resistance, but should never be used in isolation.
Stan refers regularly to Mansfield charts.
- Mansfield was his favourite chart service – at the time Stan wrote his book, most people subscribed for charts, rather than plot their own.
- Computer charting was fairly rudimentary at this point.
Mansfield charts use a weighted MA (presumably an exponential MA) where the recent weeks carry more weight.
- These are more sensitive than standard MAs and change direction more quickly.
- The downside of this is they produce more whipsaws (short-term moves that come to nothing).
Mansfield charts also included a relative strength line, which is probably why Stan liked them.
- Don’t buy stocks where relative strength is negative.
- Don’t short stocks where relative strength is positive.

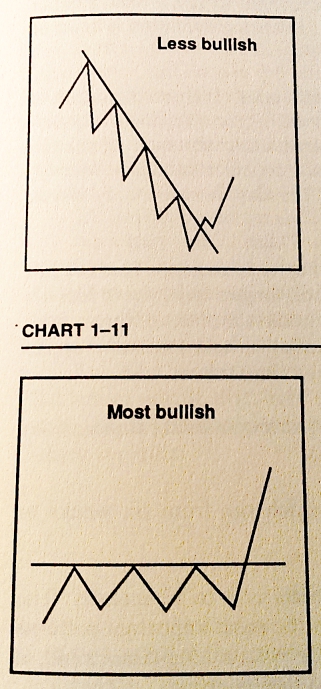
Stan also takes notice of the yearly range. (( As do I ))
- When a stock makes a year high, there are likely to be no sellers above the price looking to “get out even”.
- Similarly, a new low for the year is very dangerous, as there is no support.
Four Stages
We now come to Stan’s big idea – the Stage Chart.

Every stock is in one of the four stages of a major cycle:
- The basing stage
- This can last months, or even years
- The advancing stage
- This starts with a breakout above the 30-week MA on “impressive volume”
- At this point the fundamentals may not be positive
- The 30-week MA should now move up sharply
- After some months, the progress of the MA will slow, and the price will approach the MA
- Don’t chase a stock that you’ve missed – buy early in Stage 2, or wait for the next stock.
- The top, where the stock trends sideways
- Stage 3 is the mirror image of stage 1
- Improving fundamentals or a story will draw in buyers, allowing others to leave
- Traders should get out here
- Investors should bank half their position and place a stop below support
- The declining stage
- Here the price breaks below support
- Get out, whatever the fundamentals are saying
For me, what’s missing from that chart is a volume line.
- Early in stage 1, volume should dry up.
- Then late in stage 1, volume should increase again, without the price changing.
- This is the capitulation of the disgruntled owners.
- Volume is usually heavy in stage 3, at the top.
- Stage 4 doesn’t need to be confirmed by heavy volume.
When to buy

There are three good times:
- when the stock moves out of stage 1 and into stage 2
- it can be even safer to wait for the initial stage 1 buying frenzy to die out, and buy on the first pullback
- this lets you confirm that volume picked up and then contracted on the pullback
- but you will miss some big winners by waiting – the ones that never pullback
- you can also buy a starter position on the initial breakout, and double up on the pullback
- traders would probably buy the breakout, sell the pullback and then buy again
- traders can also wait for a consolidation during stage 2, followed by a new breakout above resistance
- this is called a continuation buy
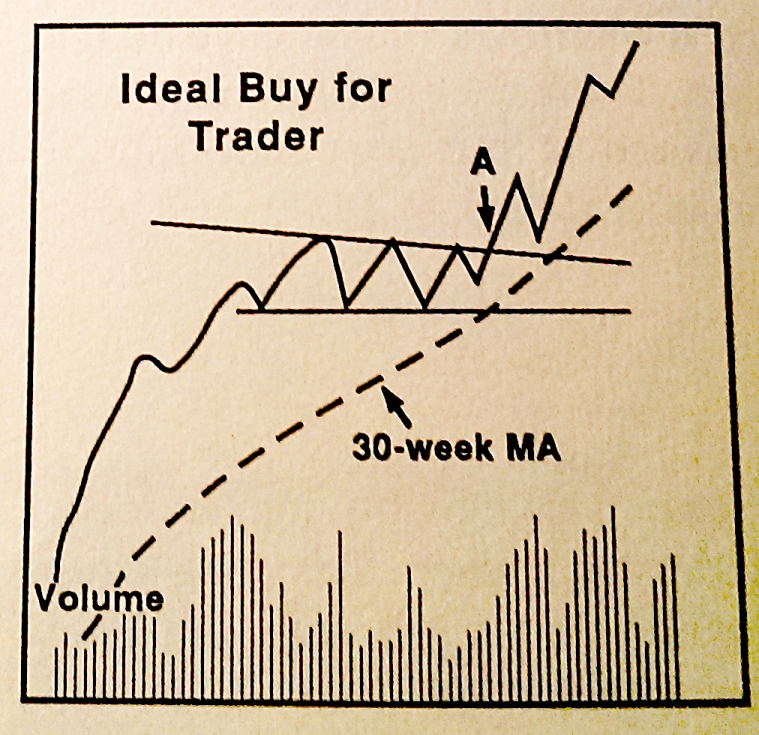
Stan also recommends that you use a buy-stop order.
- This is the reverse of a stop-loss – you want to buy only if the price goes above a particular level.
- Ideally you would use this order on a “good-’til-cancelled” basis – you don’t want to have to re-enter it every day.
The more mechanical I’ve made my system and the less subject to judgements and emotions, the more profitable it has become.
Buying patterns
Stan believes in a few buying patterns from history:
- The presidential cycle
- Stocks go up in an election year, then down for two years, bottoming half-way through year two; then they up in the third year
- Monthly patterns
- December is the best month, and November and January are good too
- July and August are good in the US
- May and June are bad, as are February and September
- Daily patterns
- Friday is the best day and Monday is the worst
What to buy
First, don’t buy a stock breaking out from its base when the price is still below a declining 30-week MA.
Deciding what to buy is a three-stage process:
- what is the market doing? (wait for positive trends)
- what are the best sectors?
- which are the best stocks in the best sectors?
How to implement this three-stage process is covered in more detail later in the book.
- In his Professional Tape Reader service, Stan used 50 indicators to make up what he called the “Weight of the Evidence” for the market.
- The only one he mentions at this point is the proportion of stocks on the NYSE that are in stages 1 or 2.
When choosing the best sectors, ignore fundamentals.
- Instead, apply the stage chart rules to the chart for the sector index.
- We’re ideally looking for sectors that are breaking from Stage 1 into Stage 2.
- But even when a sector is well into Stage 2, there will still be stocks in that sector that are just starting their move from Stage 1 into Stage 2.
Conclusions
We’re going to leave it there for today – we’re already a quarter of the way into the book.
So far, I like Stan’s system.
- It’s easy to understand, and there are clear rules for how to implement it.
- No doubt there will be obstacles to overcome in terms of data and of sector analysis when we come to the UK market.
But so far, so good.
- I’ll be back in a few weeks with more on buying, plus how and when to sell, and how to sell short.
Until next time.
Mike Rawson
Mike is the owner of 7 Circles, and a private investor living in London. He has been managing his own money for 40 years, with some success.


Hi Mike, great article as usual. I am only about 50% invested at the moment and am looking to model my investments very much around the asset allocation model you have previously outlined. This article makes me a bit nervous especially when we talk about all time highs, presidential cycle, go away in May etc. From previous articles you had mentioned the possibility of looking at more powerful TA products such as Sharescope. If we are working on the basis there that there is some good advice in Stan’s book what are your thoughts on using such software to validate the timing of purchases be they ETFs, ITs or individual stocks?
I’m still too much of a cheapskate to pay for ShareScope. Stan’s system looks pretty simple so far, and since it just uses price and volume data, I’m hoping to build a spreadsheet that can analyse a stock according to its principles using free data.
Once I have that working for a single stock, the challenge will be to build it out so that it can search a (limited) universe of stocks for opportunities. I think we are a few months away from that yet.
Thanks for the article. Always something to learn and nicely put together.
The book reviewed is very comparable to the book by Mark Minervini, 2013, which is mainly on US stocks and covers quite a bit of timescale, 80s to 2013. Emphasis is on the accelerated earnings and getting that Stage 2 timing right.
Very informative articles. Thanks for posting this. There is an interesting website dedicated to Stage Analysis with some great resources : http://www.nextbigtrade.com/
Very informative thanks
I’m in the middle of reading this book now, it’s great. Although does require re-reading in places to make sure things stick. How’s the spreadsheet build coming along?
Hi Gavin,
I signed up to Stockopedia to support building an AIM IHT portfolio, which took up most of my summer. So I will probably start by trying to build a Weinstein screen in there. They have a Minervini screen that a can use as an example.
I’ll try to get going in the next few weeks – thanks for the reminder. Stick with the articles – I’ve completed the book and the one-page summary will be out in a couple of weeks.
Mike
Hi thanks for this post. Is there anything or a famous book on the best order entries for a retail trader ?
Hi Badrul,
Every trading system is different. Read the rest of the posts on Stan’s book and you’ll know what he looks for before making an entry.
Mike
years ago i bought the book of stan weinstein and liked his system. but i lost connection. i would like to reconnect if there is a way. thank you . avigdor
I’m afraid Stan seems to have disappeared.
If you can find out anything, do let us know.
I learned about Stan Weinstein from several of his interviews on the podcasts offered by http://www.finanancialsense.com, where Jim Puplava interviews him. Because of these podcasts, I bought his book and am about finished.
The book is a little dated, in that it talks about stock moved only up to 1987, and uses charting services that may be defunct, but the most of the content is universal.
Thank you for the outlined principles. From now on, I’m putting all stock trades thru this new filter and placing stop losses on all my trades!
I have been following this system for years it works with your on discipline