
Man on Trend

Today’s post looks at a couple of papers from Man on trend following.
Contents
What’s Not to Like?
The first paper is from 2023 and is called What’s Trending: Trend-following – What’s Not to Like?
Trend-following strategies perform as well as equities in the long term, yet get there with lower risk, smaller drawdowns, and do best when equities are at their worst. What’s not to like about that?
Trend-following should be as popular as equity investing [but] equity markets are nearly 300 times the size of trend-following’s AUM. [So] either these facts are not well known, or there is some other issue.

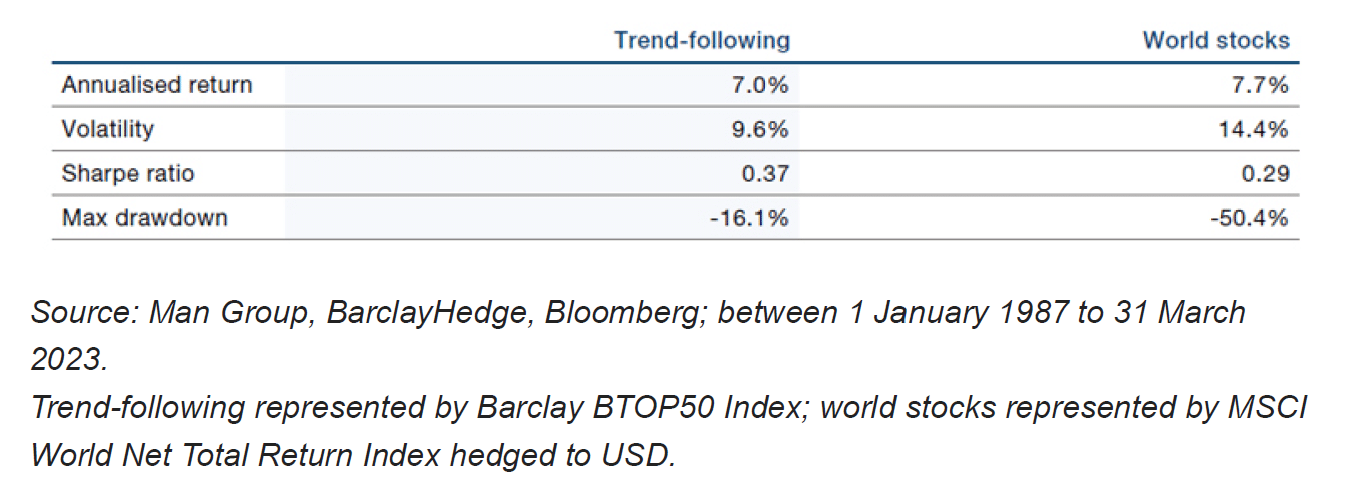
Trend-following is a remarkably simple strategy. Buy something that is going up; and sell something that is going down. Finance 101 says that trends should not exist; markets are efficient, and information is instantaneously reflected in prices.
Of course, this ignores the fact that decisions lag news flow, that economic cycles play out over years, and that humans get emotional; we hate losses more than we love gains, and in doing so we make irrational choices.
Correlation and crisis alpha
In practice, the edge is thin, and managers use dozens to hundreds of markets. But the returns are there, and they are uncorrelated.

Even better, trend offers crisis alpha.
Trend-following strategies have another trick up their sleeve; negative correlation to risk assets in times of crisis.
Of course, this depends on the crisis, and the speed of trend following being used, but in general it is true.
During shorter periods such as the Covid-19 episode, however, performance is more mixed. This is because trend-following strategies take time – typically 3-6 months – to discover, and trade into, a new trend.


Lack of popularity
So why doesn’t everyone use trend?
The performance of a traditional equity portfolio is fairly simple to understand. Performance of a trend-following strategy is far less intuitive.
Trend-following strategies trade many markets across multiple asset classes. This positioning can change as trends in different places emerge or dissipate. A trend-follower’s beta to any asset is dynamic.
Another reason is a period of serious underperformance post-2008:
The BTOP50 index returned zero between 2009 and 2019 when equities returned around 200%. We are sympathetic to the argument that it is hard to hold an investment that doesn’t make any money for 10 years.
Everything looks bad against large-cap stocks since 2008, but the point remains.
- Nevertheless, adding (up to 50%) trend to stocks should improve long-run performance:

The chart shows the improvements over the last four decades.
- I don’t think I will ever hit the 50% trend allocation, but I’m confident that 10% to 15% is a good idea.
If it Moves, Monetise It!
The second paper is from September 2023 and is called “Trend-Following: If it Moves, Monetise It!”.
- The focus of the note is on how to use trend-following’s “crisis alpha” credentials when there’s no crisis.
In particular, we need a portfolio combining trend and stocks that both improves long-term returns and doesn’t massively underperform during the “CTA winter” of 2009-19.

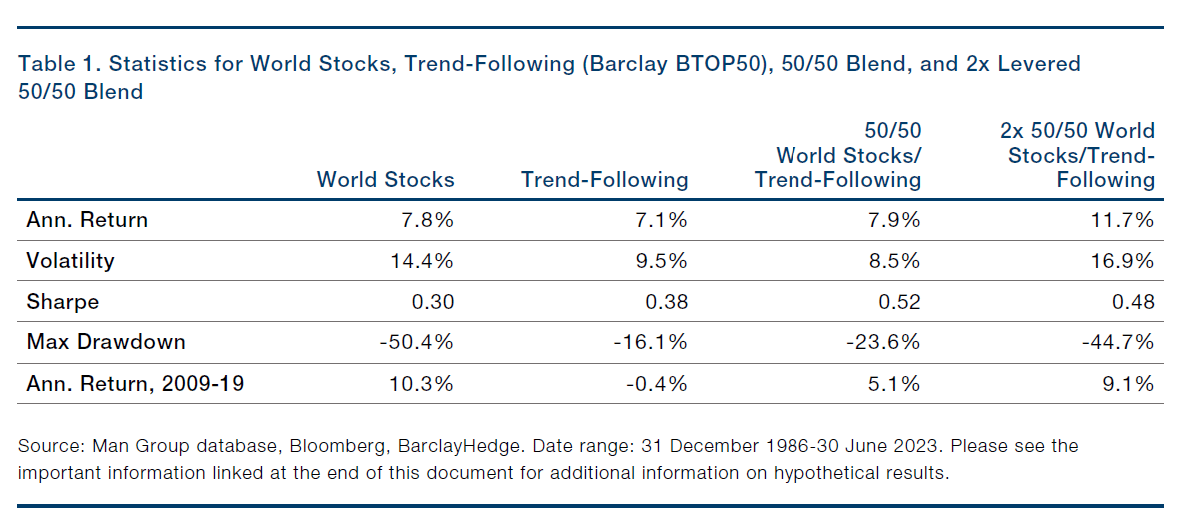
We begin with an updated version of the “Returns and Drawdowns” chart from the previous paper.
- The 50 /50 portfolio has similar returns to stocks with lower volatility and much lower drawdowns.
We could be picky and say that yes, risk-adjusted returns are higher in the blended portfolio – the Sharpe ratio is 0.52 versus 0.30 for World Stocks – but you can’t eat a Sharpe ratio. Returns are what really matters.
We also have the CTA winter problem. Between 2009 and 2019, trend-following strategies were broadly flat, returning -0.4% per annum compared with World Stocks at +10.3%. It is unsurprising that any blend of trend-following with World Stocks underperforms.
Gearing
You have probably guessed that the answer to both problems is gearing.
- We can borrow to reach a 2x exposure (100% stocks, 100% trend).
Leverage is often associated with additional risk and followed by a gnashing of teeth and a sharp intake of breath. In this case, the leverage is afforded by the diversification offered by the trend-following strategy.
Because of trend-following’s low correlation to stocks on average, and negative correlation in crisis periods, the twice-geared portfolio has very similar risk characteristics to the original World Stocks portfolio.
- Overall returns are significantly better; 12% versus 8% per annum
- Returns during the CTA winter 2009-19 are about the same, around 10% per annum (our critics are happy!)
- Volatility and drawdowns are about the same
What we have done is monetise trend following’s defensive properties, We can take more exposure in the good times because we know that the downside is taken care of through trend-following’s crisis alpha properties.

Conclusions
By concentrating on the CTA winter, in a sense our critics were saying, “In one of the best periods for our strategy (stocks), your strategy (trend-following) does badly”.
Defining the CTA winter as being the 10 years from 1 January 2009, performance of World Stocks is in the 83rd percentile of rolling 10-year returns, while trend-following is in its 1st percentile.
That this 1st percentile corresponds only to an annualised loss of 0.4% is remarkable in itself, in our view. This diversification should be celebrated. In this article we have shown how this diversification can be monetised.
Or my own version:
- Stocks are good
- Stocks plus trend is better
- Stocks plus Trend plus Leverage is best
Getting trend and leverage into UK private investor tax shelters is not straightforward, but at least we have a direction of travel.
That’s it for today.
- Until next time.
Mike Rawson

Mike is the owner of 7 Circles, and a private investor living in London. He has been managing his own money for 40 years, with some success.