Five Years of Stockopedia StockRanks
Today’s post is a look at a recent Stockopedia webinar celebrating five years of their Stockranks metrics.
Contents
StockRanks

A couple of weeks ago, Ed Croft conducted a two-hour, 124-slide webinar on how the Stockopedia Stockranks have performed over their first five years.
- We’ve looked at the Stockranks several times before (and indeed, I now use them every month to review my various portfolios), so I hope to keep things considerably shorter than that.
Return breakdown
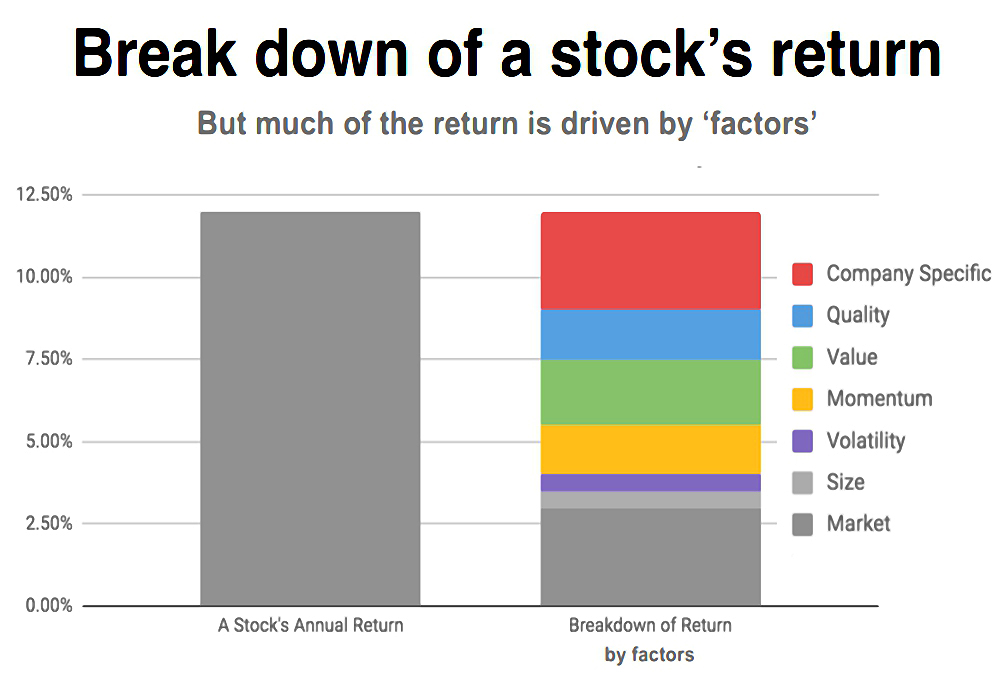
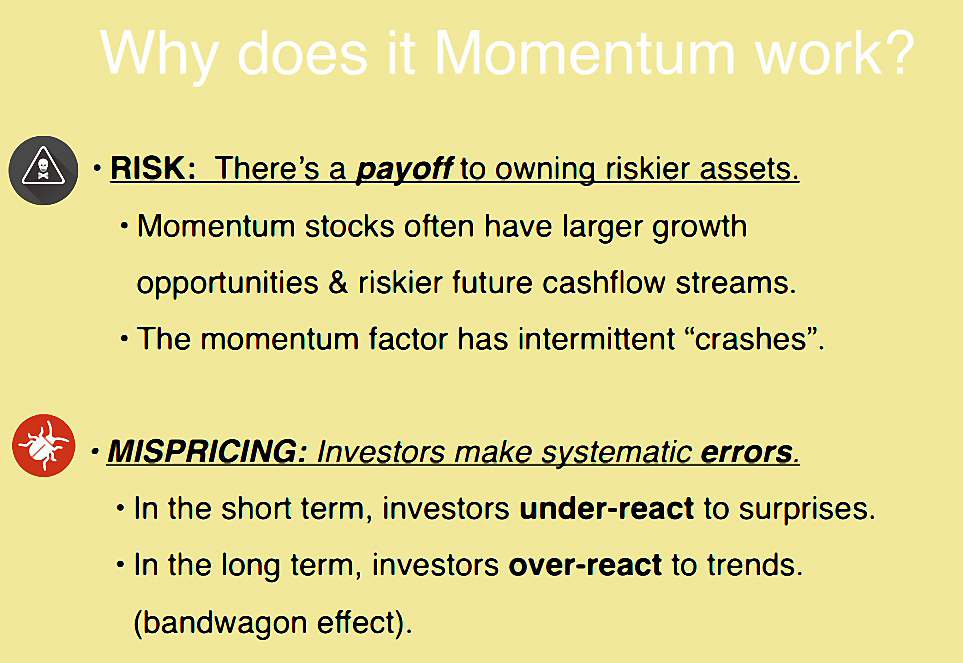
Ed began by looking at how the returns from a stock breakdown.
- Most of the return is due to exposure to the market, and to various factors.
- Only a minority of the return is stock-specific.
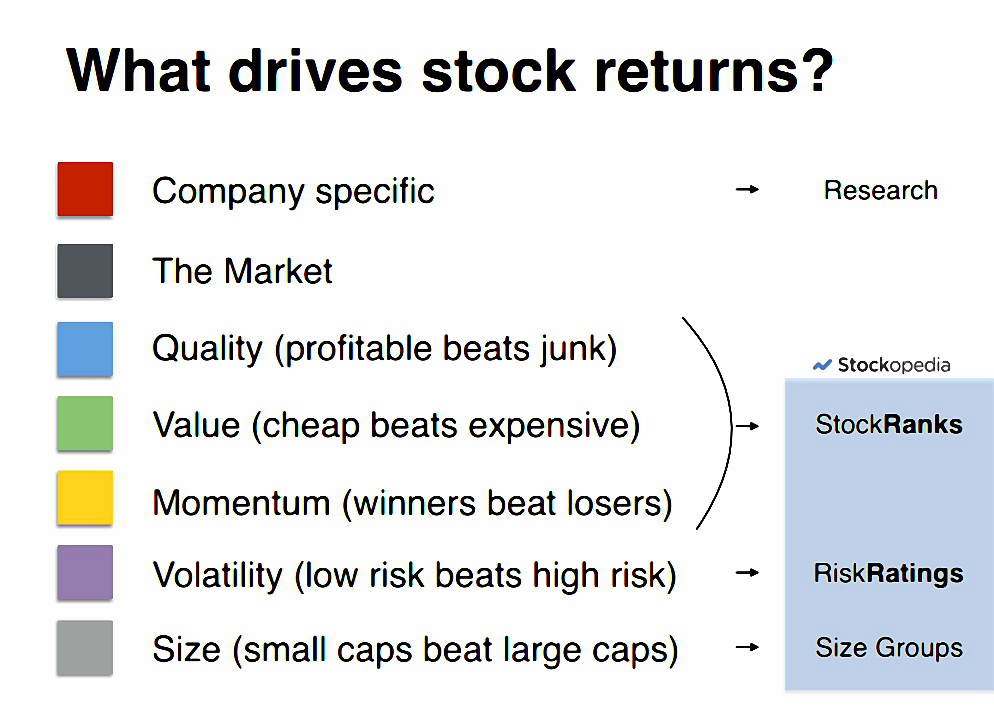
Stockopedia offers three tools to help capture these factore returns:
- The Stockranks (Quality, Value and Momentum factors)
- The Risk Ratings (Low volatility factor)
- Market cap data (Size factor)
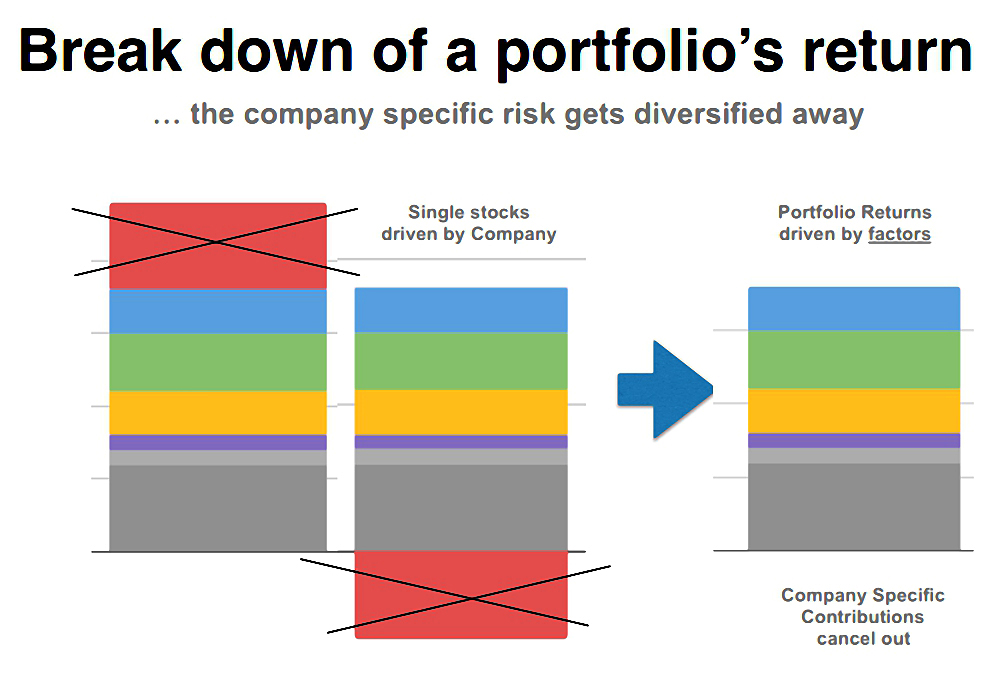
But in order to diversify away the stock-specific risk, you need to create a portfolio of at least 20 stocks.
Not everybody believes that the StockRanks work.
But they do.
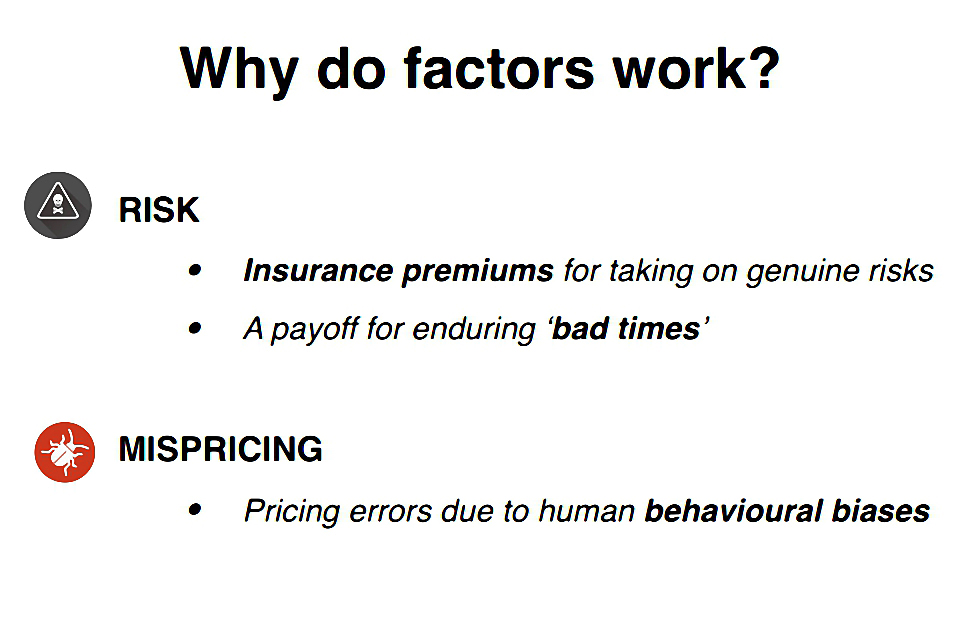
And here’s why – risk aversion and other behavioural biases.

Value
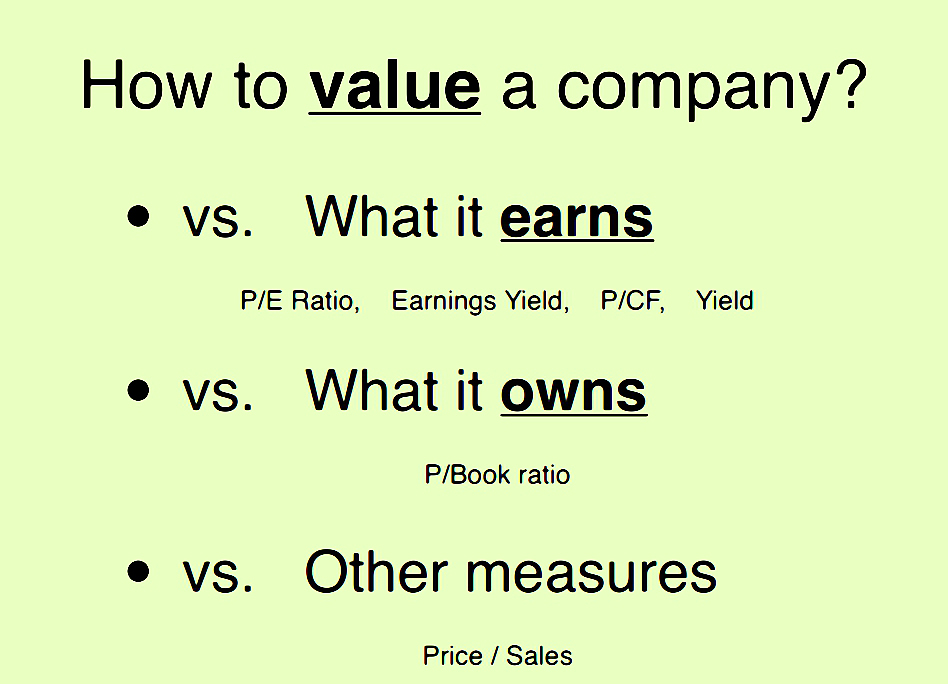
In the next section, Ed runs through the main factors.
- Value is up first.
![]()
Value works:
![]()
And here’s why it works:
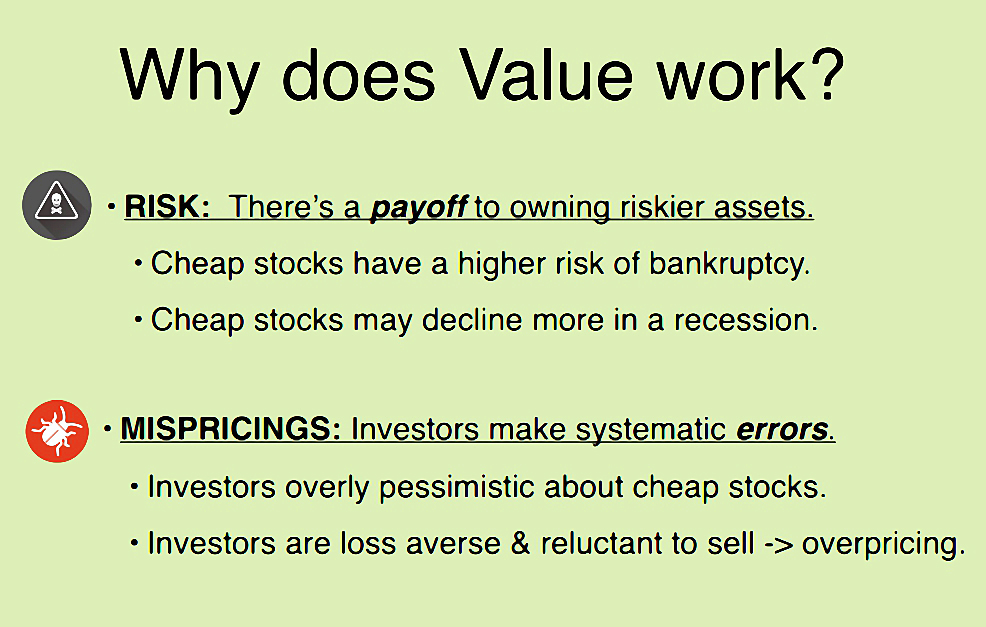
Ed notes that Value alone is risky, because there is no measure of quality, and some of the stocks may be close to financial distress.
- He suggests using it with other factors.
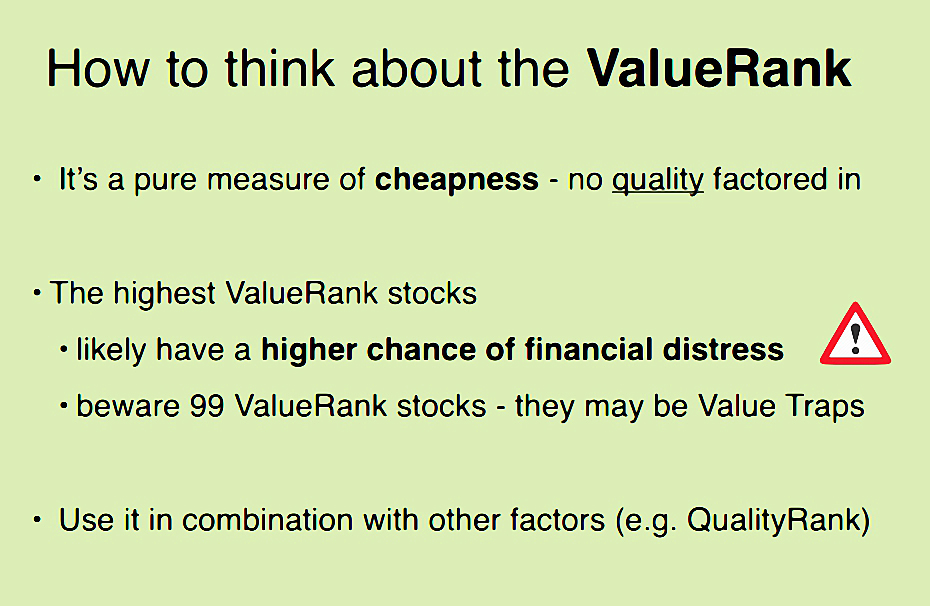
I tend not to buy anything with a StockRank below 80.
- In practice, few of these stocks have the extreme high value Ranks that Ed is warning about.
I usually have the opposite problem:
- I like to sell when any sub-Rank goes below 20, but many of my biggest winners end up with a very low Value rank.
In such situations I usually rely on the chart to see whether there is more to come from a stock.
Quality
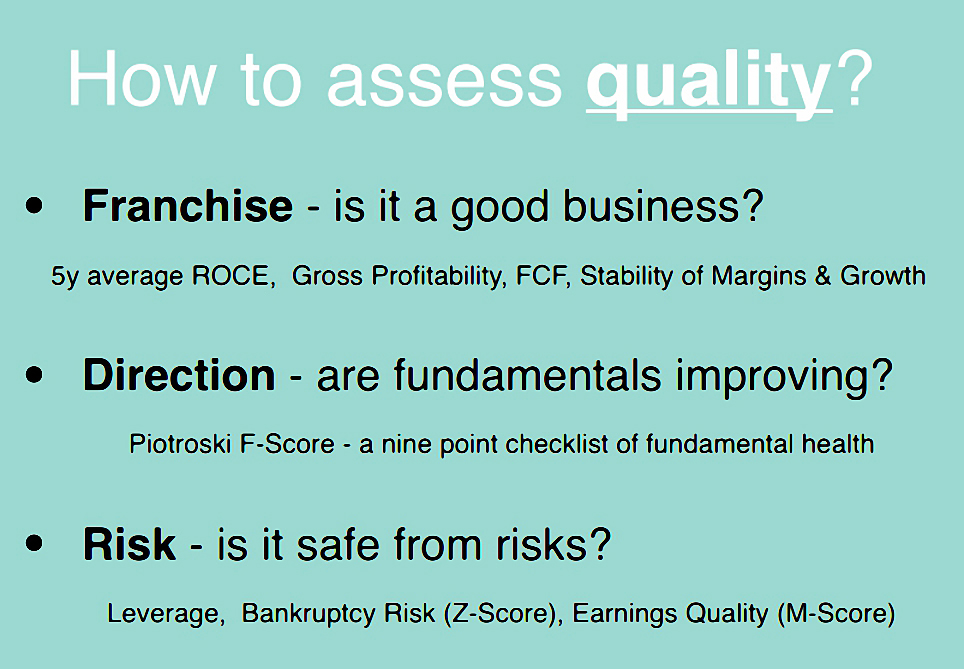
Quality is up next.
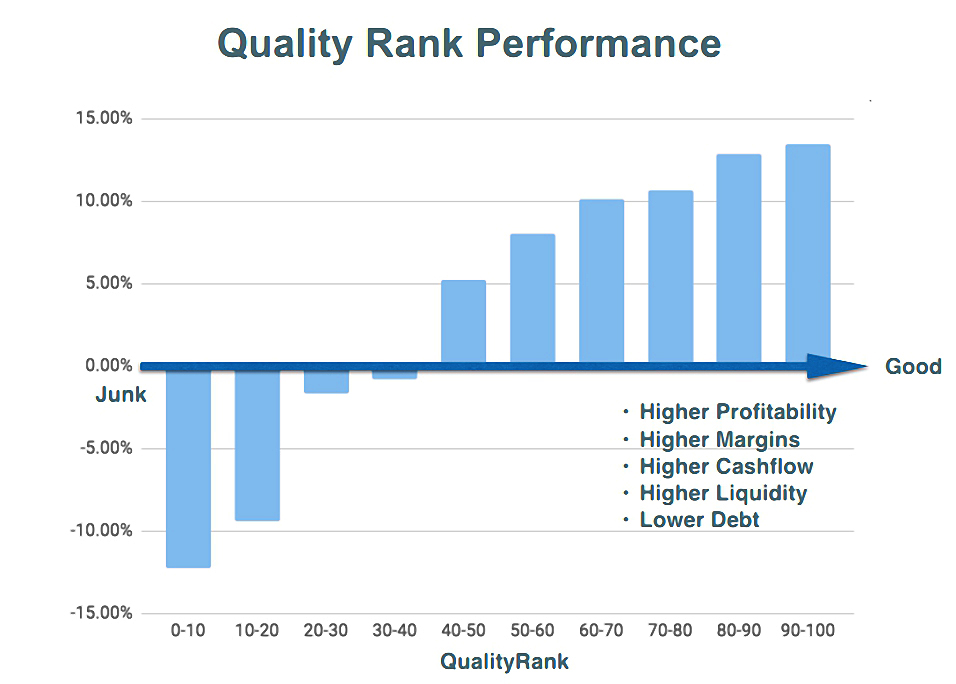
Like Value, Quality works.
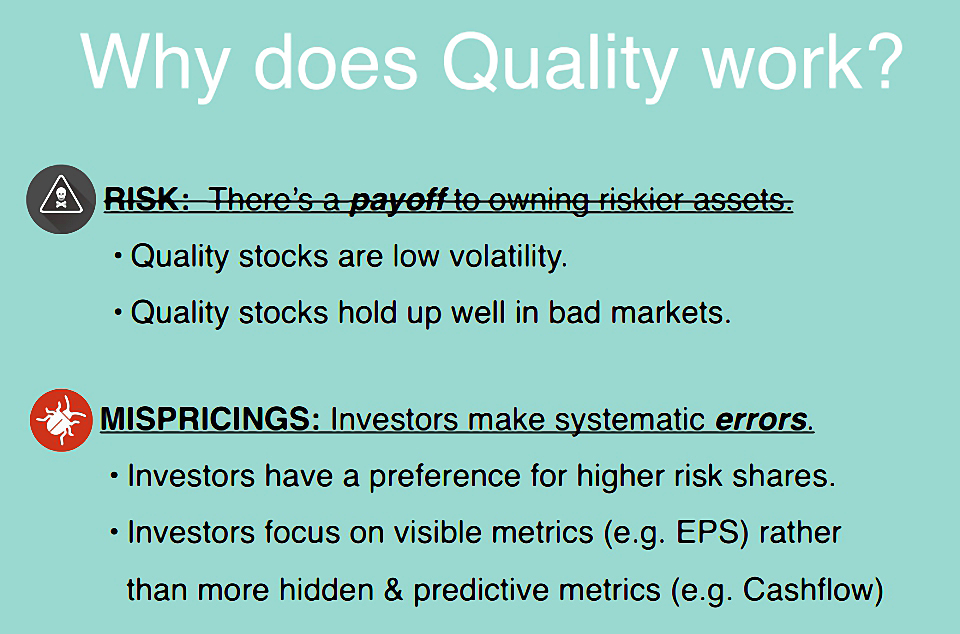
Here’s why it works.
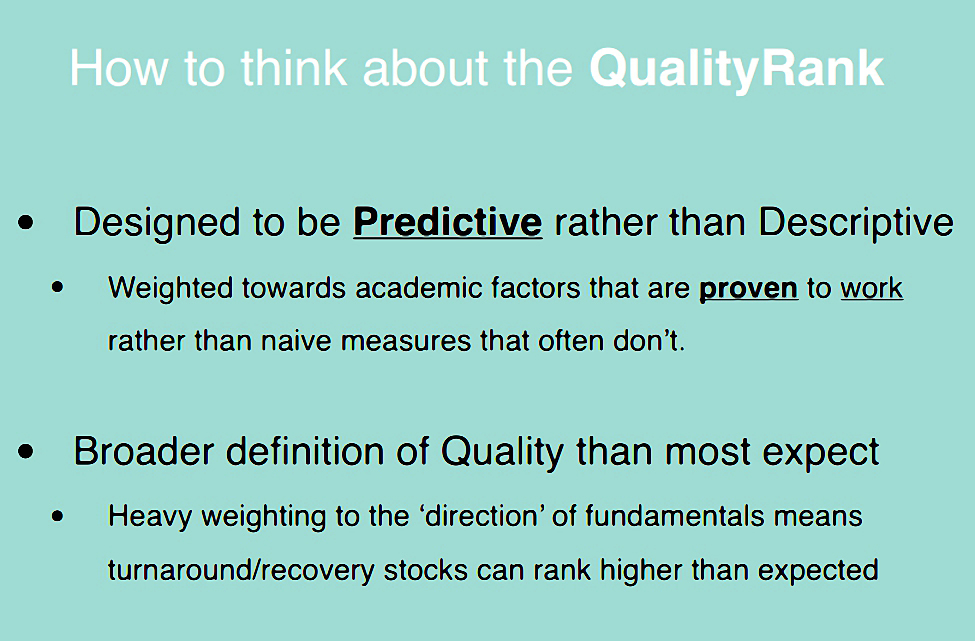
Ed points out that Stockpedia use a broader definition of Quality than most investors, which explains why turnaround and recovery stocks can score highly.
Momentum
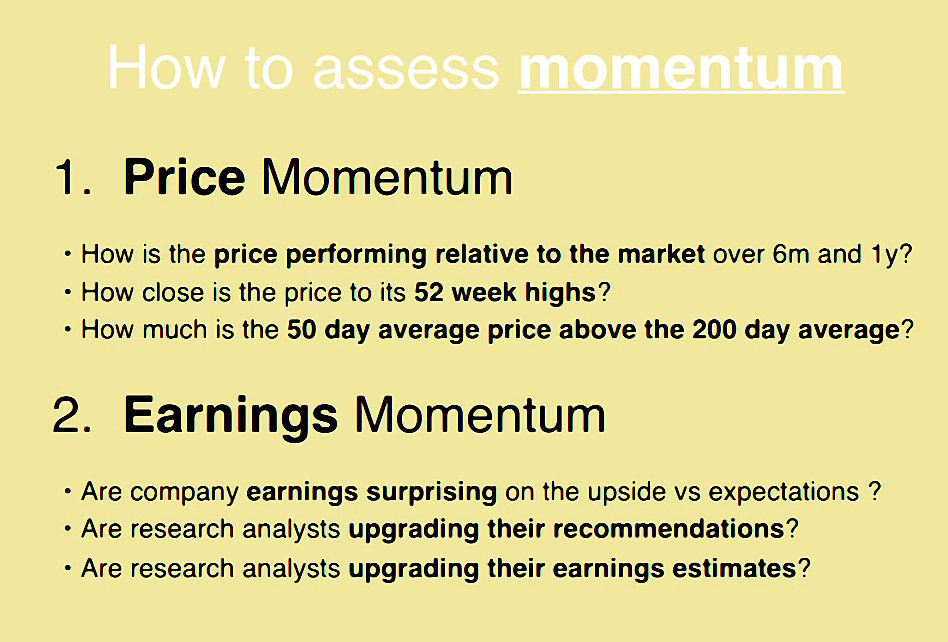
Momentum is the third Stockpedia factor.
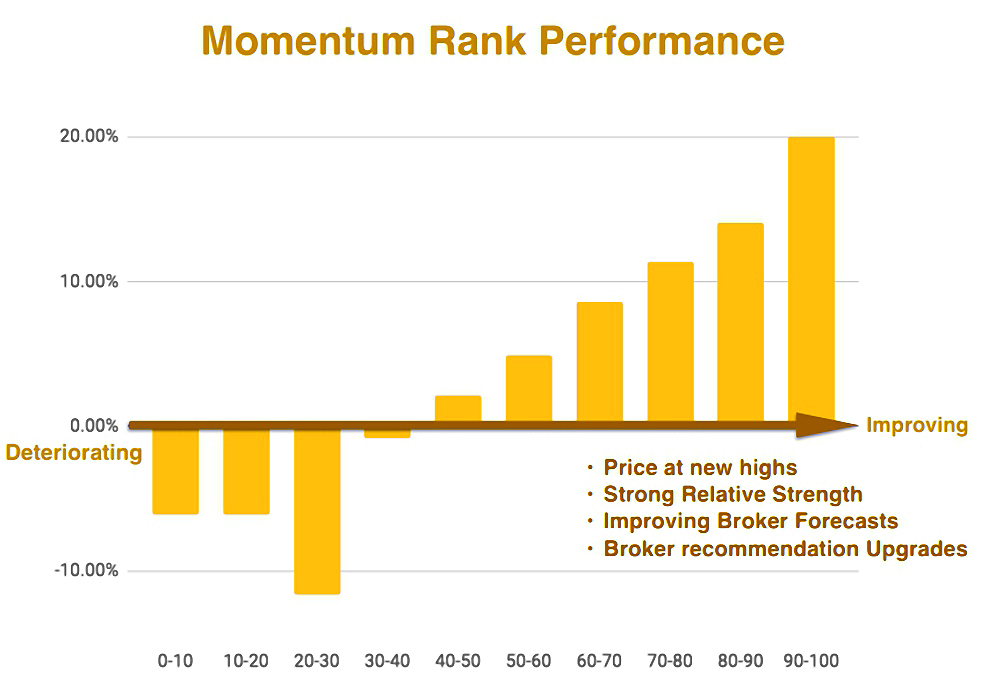
Like the other two factors, Momentum works.
Here’s why Momentum works.
Styles

Using a simple high / low metric for each sub-Rank, the StockRanks can be combined to form four winning Styles of stock, and four losing Styles.
- For obvious reasons, I try to stick to winning styles these days.

Here’s a breakdown of the percentage of stocks within each style.

Like the Ranks and the sub -Ranks, the Styles work, both in terms of cumulative performance …
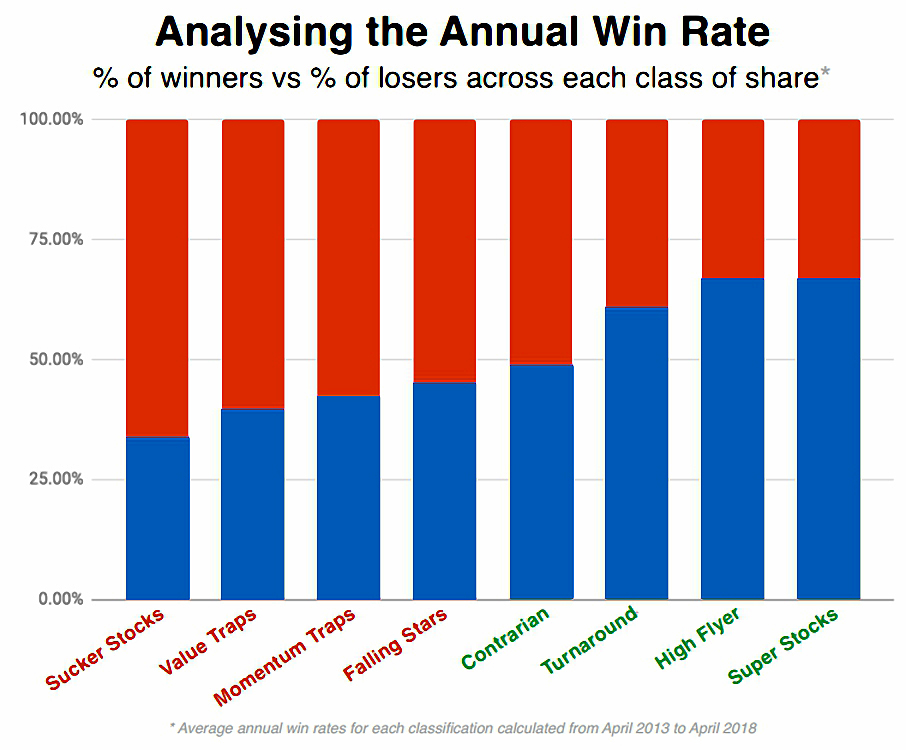
… and by win rate.
Risk Ratings
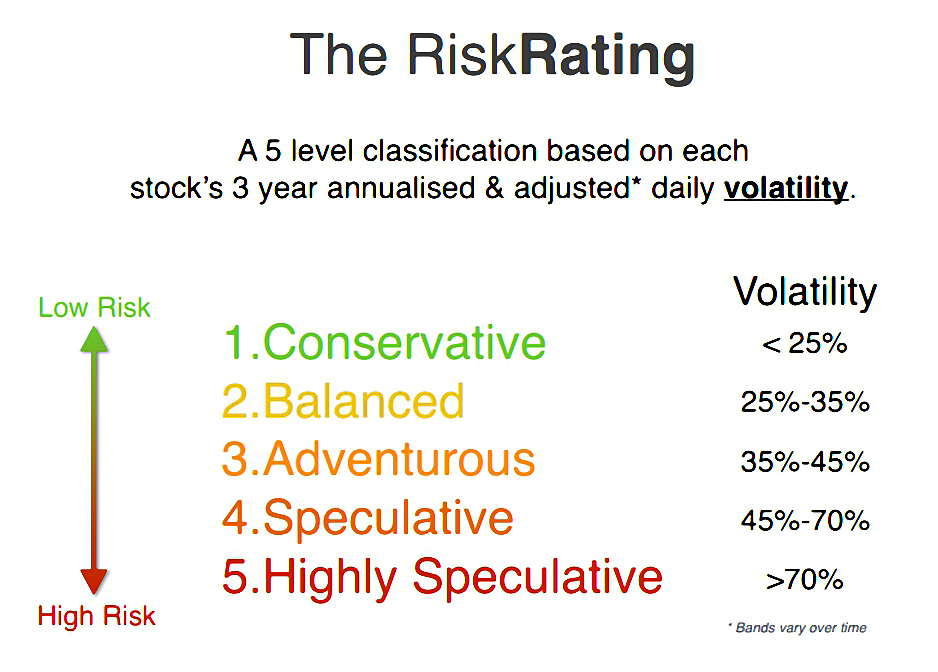
There wan’t much about the Risk Ratings in this presentation.
- That’s fine, because we covered them (and the Stock Styles) in detail at their launch back in 2017.
I use them to take advantage of the Low Volatility anomaly by generally avoiding stocks from the two highest risk categories.
High ranking stocks
In the next section, Ed ran through some of the characteristics of high-ranking stocks.
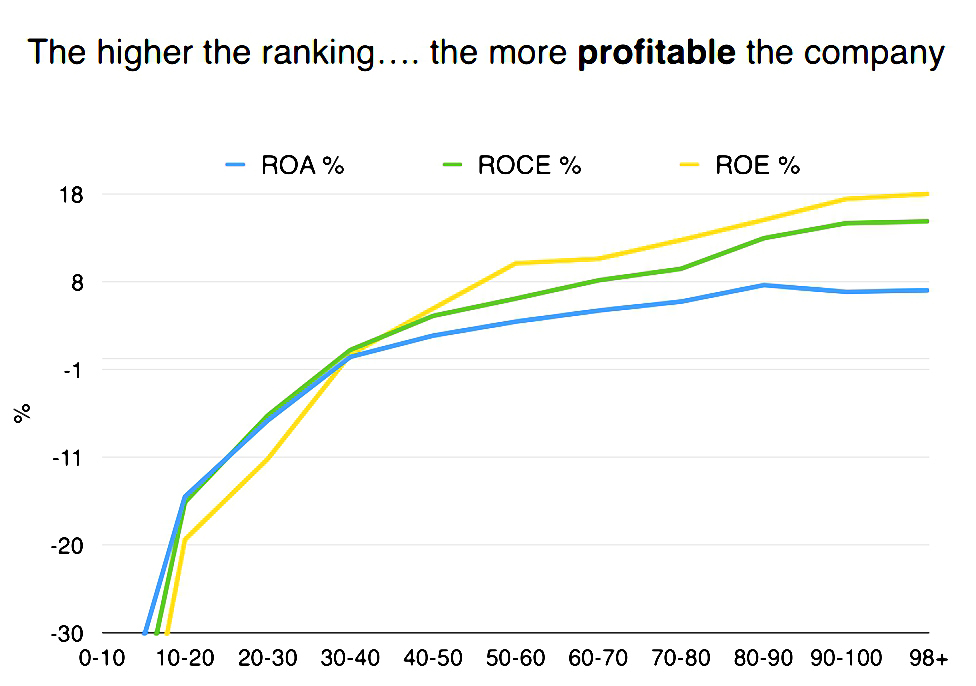
As you might expect, they are more profitable …
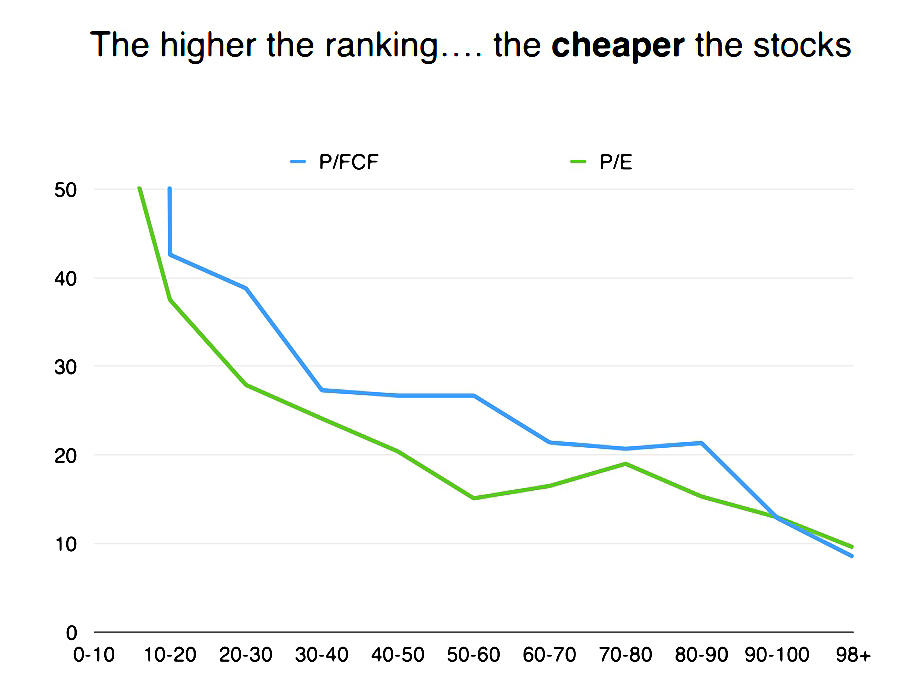
… they are cheaper …

… and they are beating the market.
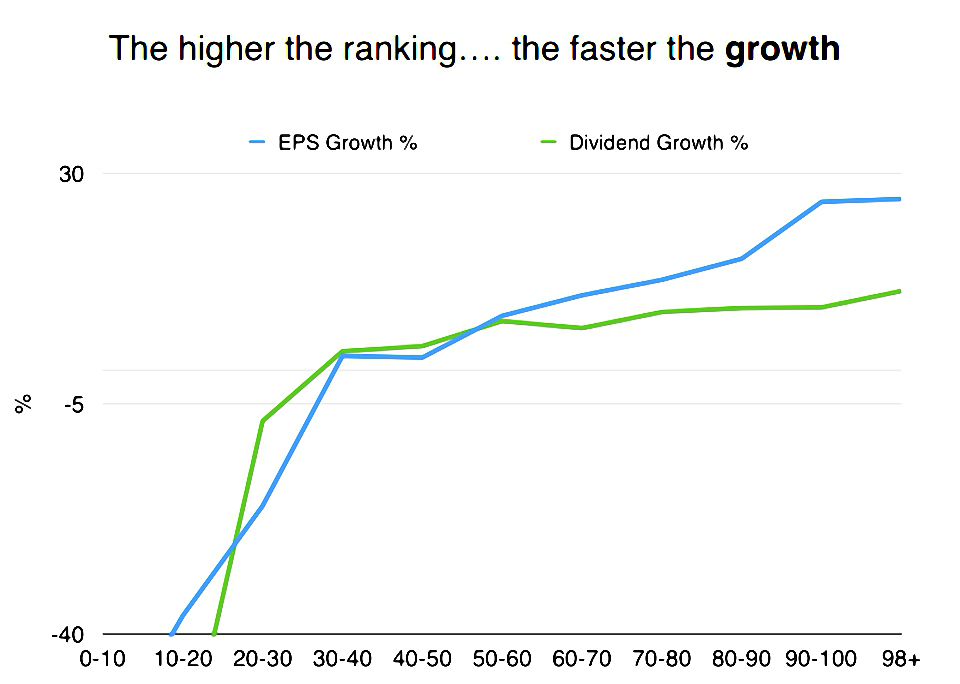
But they are also growing more quickly …
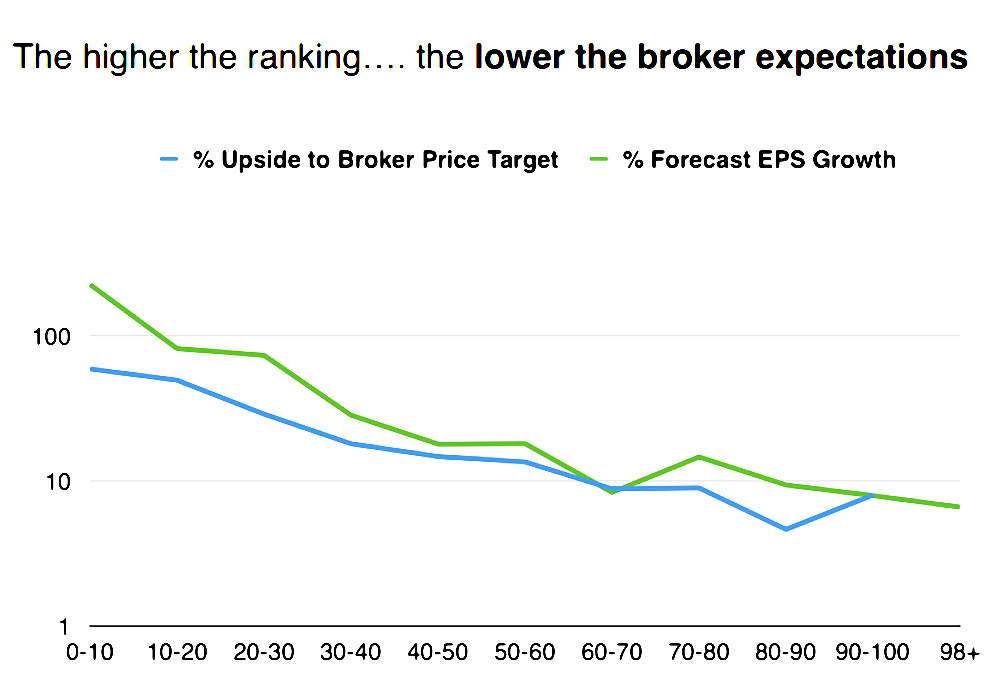
… they have lower broker expectations …
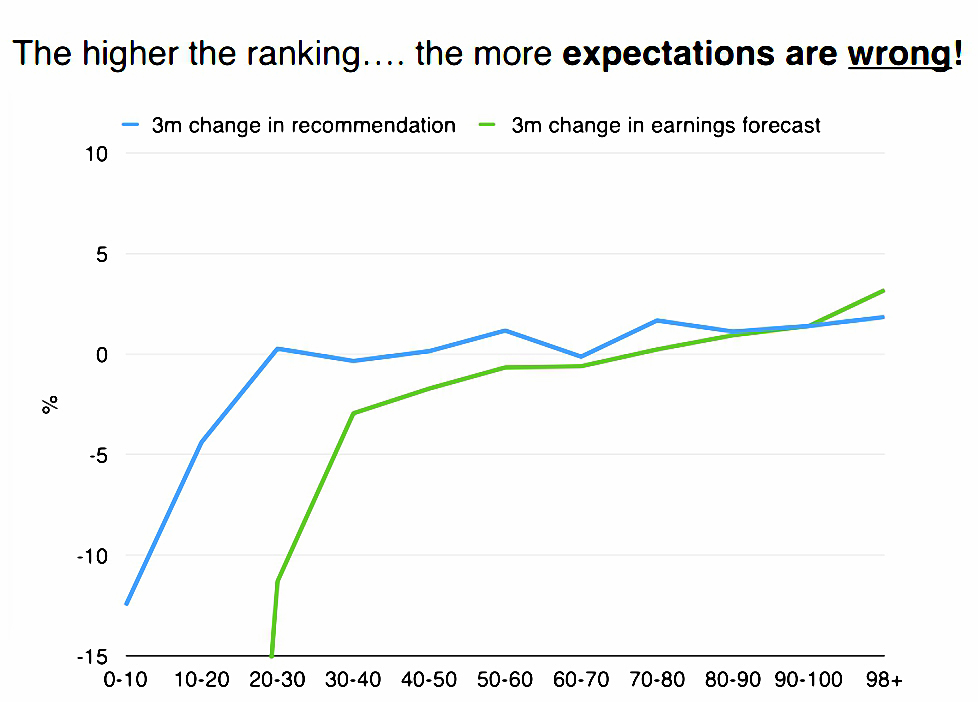
… and they are beating those (wrong) expectations.
Performance by decile
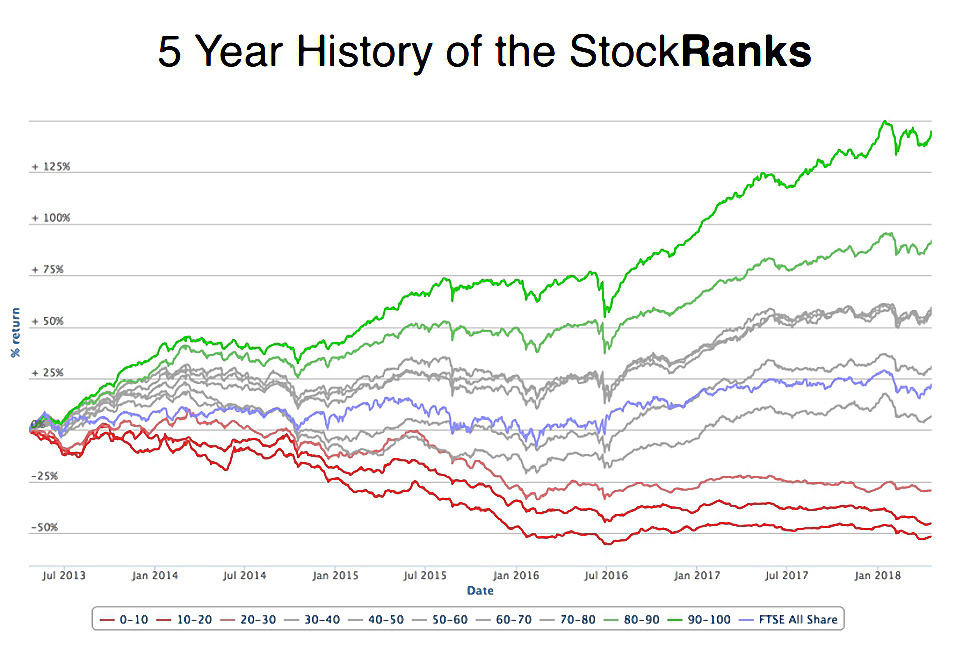
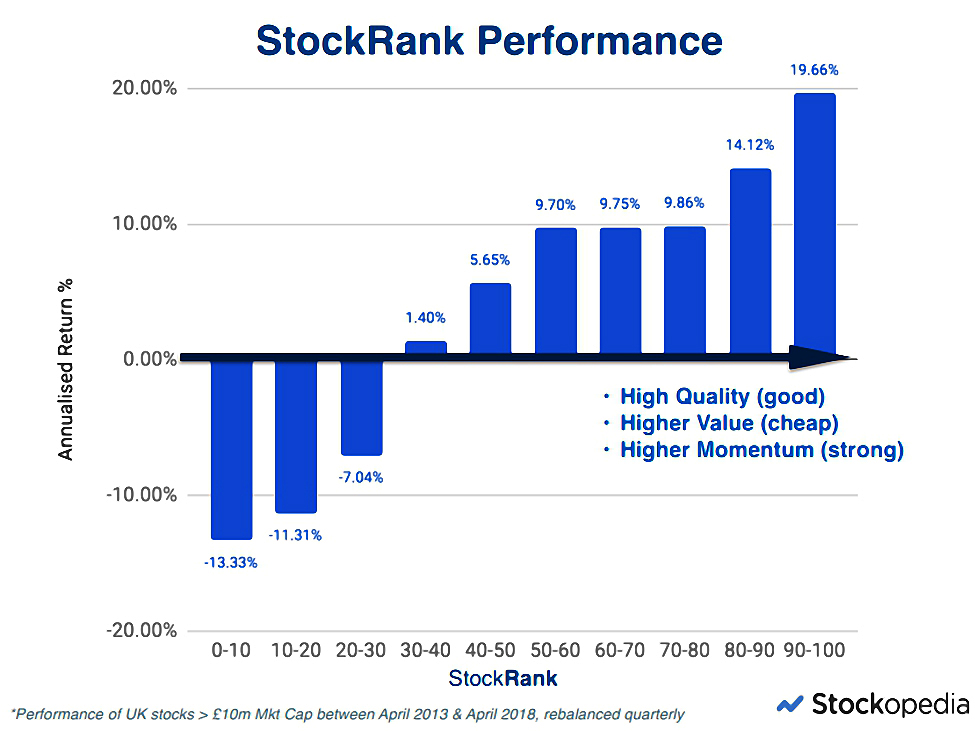
Here’s the performance history of the StockRanks by decile.
- I think this is probably the most persuasive slide in the deck.
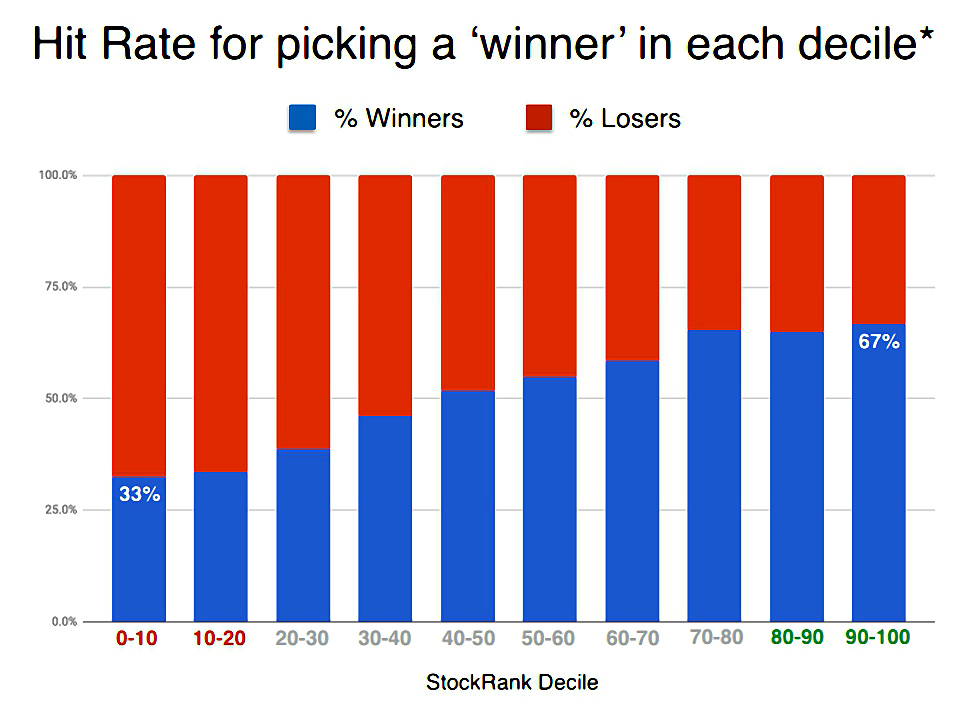
Here’s the hit rate by decile.
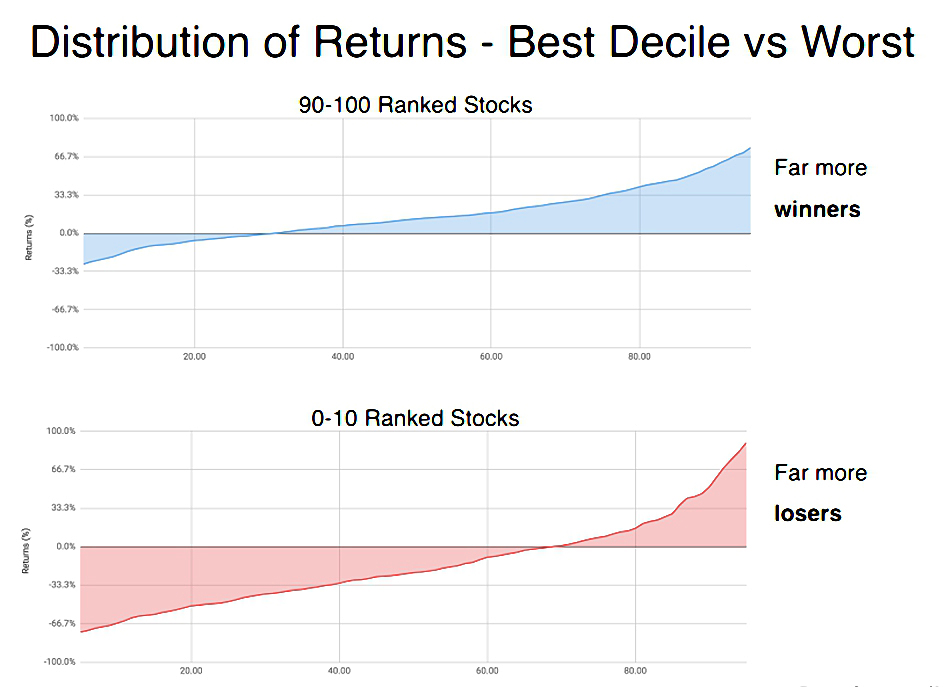
Here’s the distribution of hits and misses for the best and worst decile.
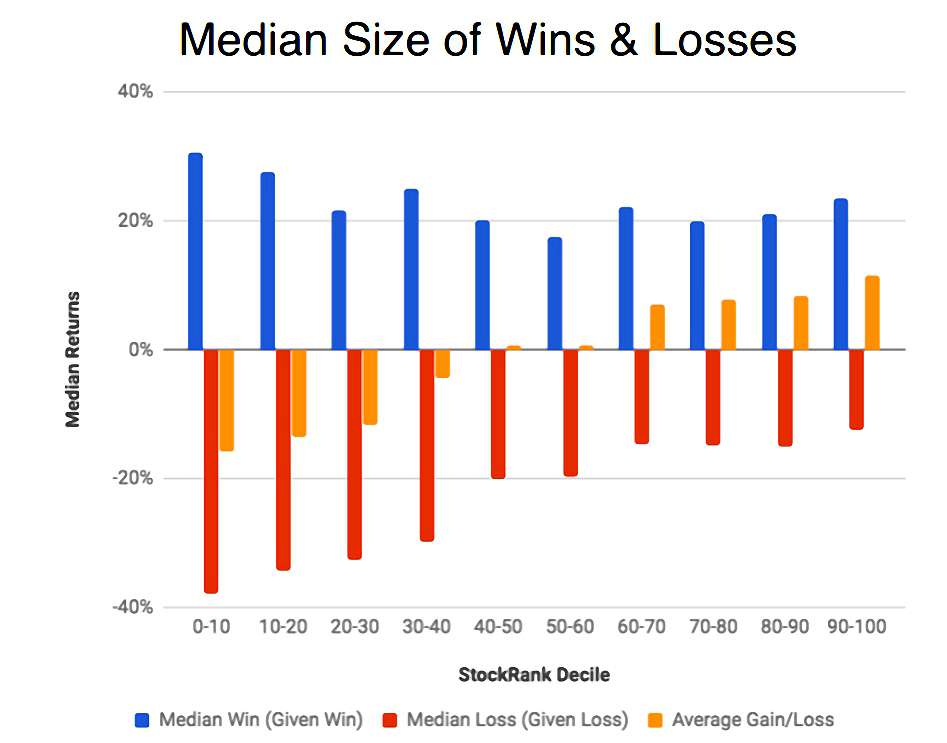
And here’s the size of wins and losses by decile.
- Note that there are some big winners in the bottom deciles, but not enough for average returns to be positive.
Sectors and size
Ed also looked at whether the Ranks were consistent across sectors and stock sizes.
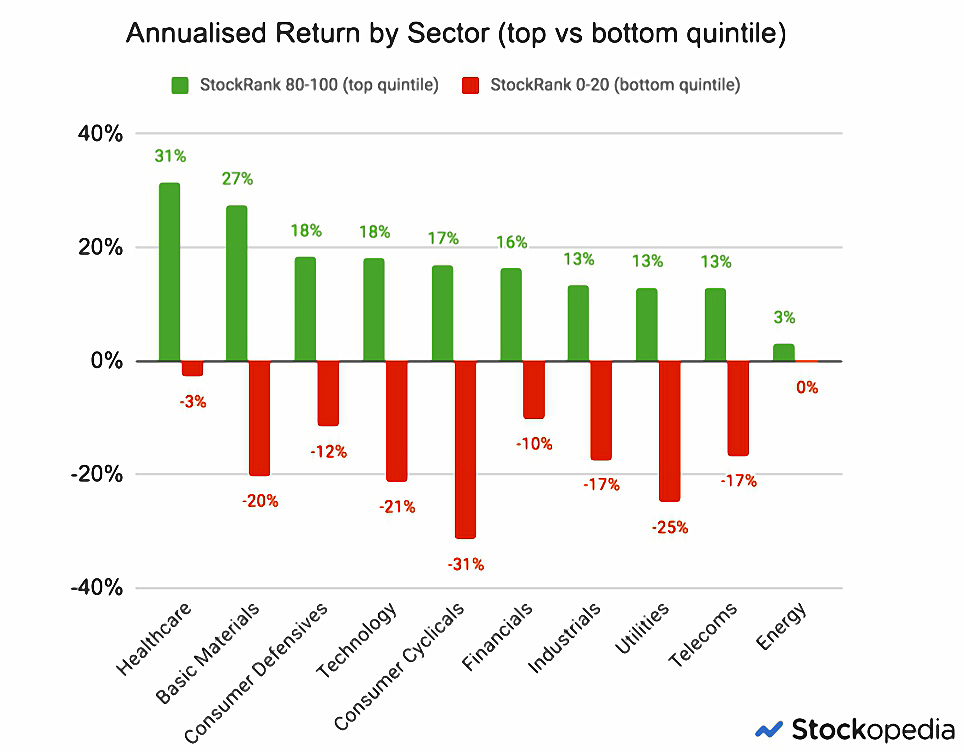
They are pretty good by sector, apart from energy (an industry that I largely avoid in any case).
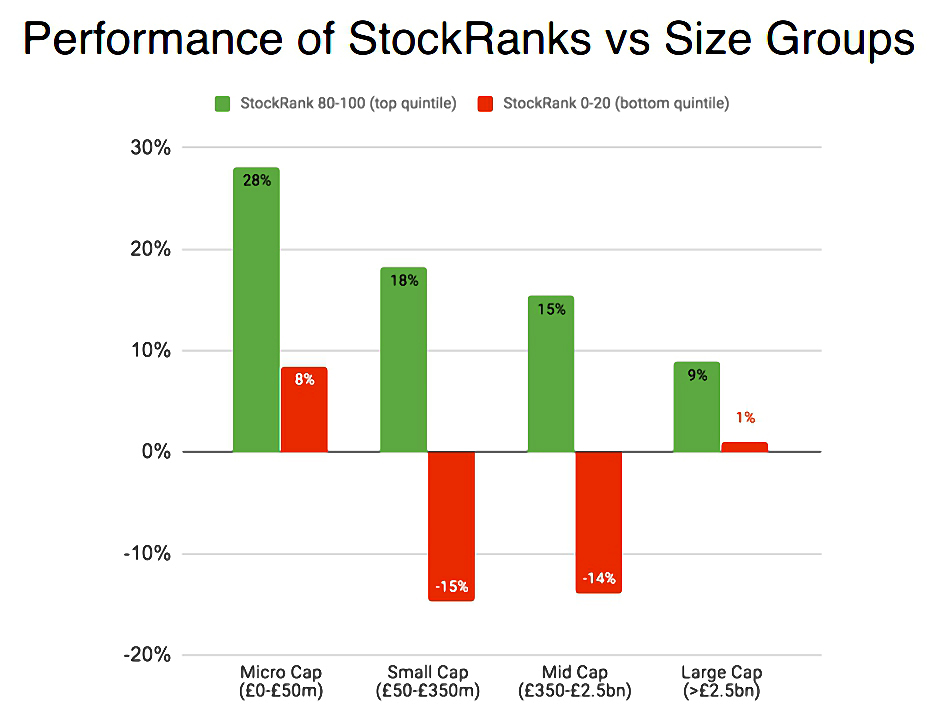
The ranks also work at all stock sizes, though not surprisingly the best gains are at the smaller end.
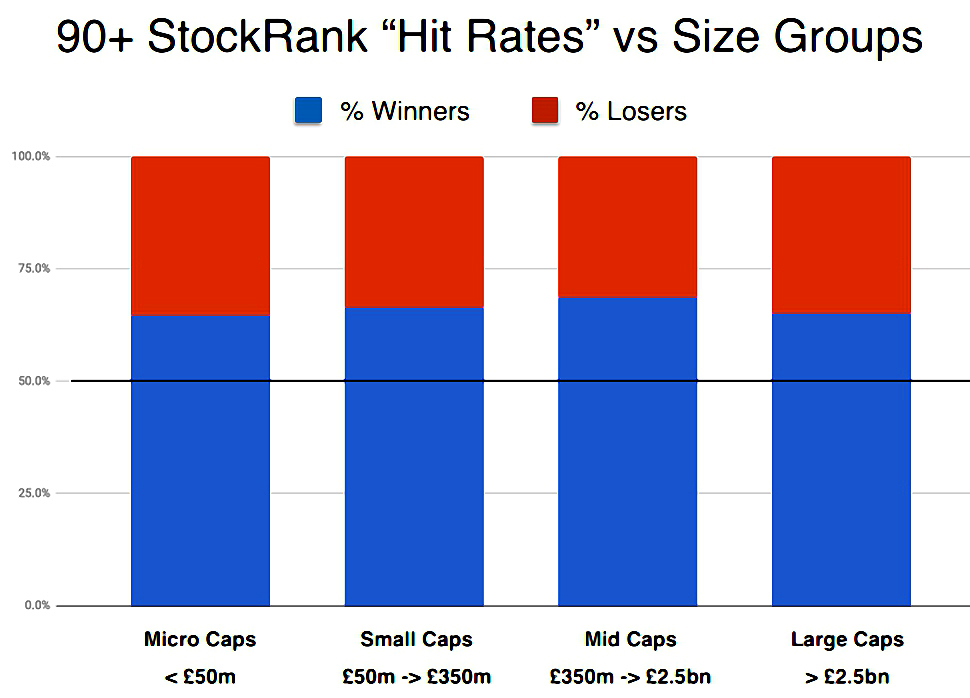
The hit rates for 90+ -ranked stocks are also pretty consistent across stock size.
Ten essential insights
After the seminar, Ed wrote a blog post detailing what he described as “ten essential insights”.
- He said that the 90+ ranked stocks have generated 20% pa over the five years.
- He also said that he is writing an eBook on the StockRanks.
On to the insights, most of which we’ve already covered in the slides above:
- Quality beat junk
- Cheap beats expensive
- Strong beats weak (momentum)
- High StockRanks means more winners (hit rate)
- Low StockRanks usually lose, but sometimes win big
- Enegy is the only sector where the Ranks don’t work.
- Ed puts that down to a “poor cyclical swing”.
- I think is might be the binary nature of energy exploration stocks (which is why I avoid them).
- The Ranks work at all stock sizes.
- Sucker Stocks really are bad.
- You can’t pick the pefect stock, but you can systhesise one.
- Ed means that if you try to build a stock screen for all the best attributes of a stock, it won’t return any hits.
- But on the other hand, you can build a portfolio of 20 stocks with 95+ Stock Ranks and on average it will have these characteristics.
- I agree with Ed, but this is common to all stock screens.
- I think there’s a middle road where you relax the screen enough to return 30 to 50 stocks, and then choose 20 from that list.
- I’ll return to this topic in a later post.
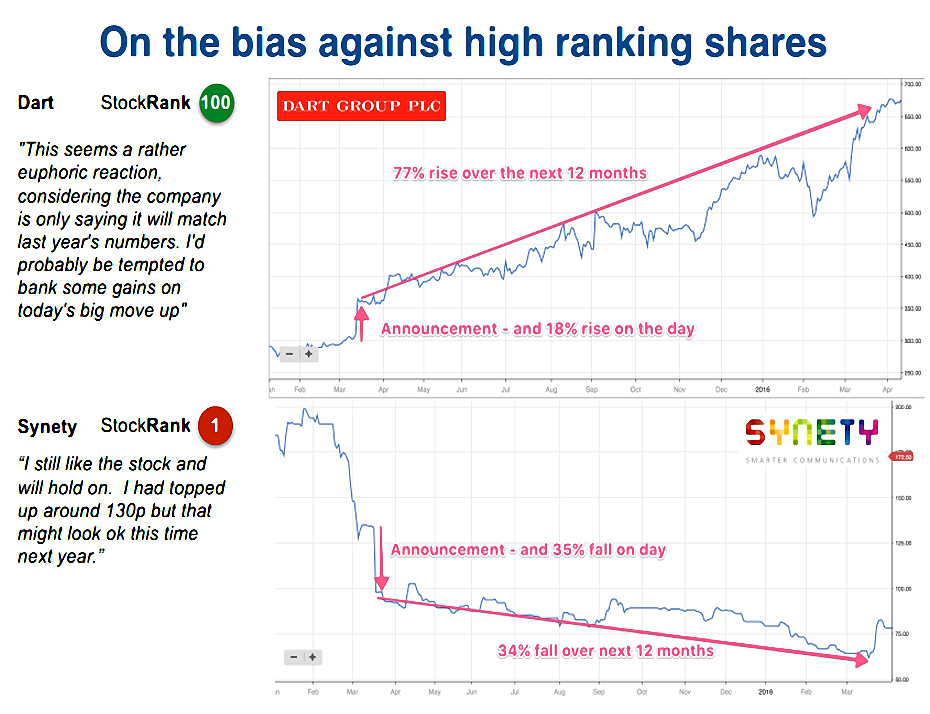
- People are biased against the Stockranks (see Dart vs Synety, above).
- I find this strange, as they seem common sense to me, but I do meet a lot of people who love Quality and hate Momentum.
- I expect the majority of my portfolios to be made up of stocks that were ranked 80 and above when I bought them.
As Ed says, if the factors stop working, we might as well all go back to indexing.
Value
Ed’s post generated a fair number of comments, and some of the discussion was insightful.
The first point (from Nick Ray) was that Value only outperformed during 2014, the worst year for the overall market of the five since the Stockranks appeared.
- It also appears that Value outperformance is concentrated in smaller stocks, below £100M market cap.
So that’s a good argument for diversification, or for choosing stocks with no low sub-Ranks.
Cycles
Several people commented that the Stockranks have only existed during a long bull market, and so have not been properly tested.
- This is true, but factor investing has been tested across cycles and it works,.
- Of course, no single strategy works all the time (which is why I use multiple strategies).
Howard Marks (perhaps not his real name) pointed out that JP Morgan have looked at how factors perform through the economic cycle.
- At most points, you should bet against one of the QVM factors.
In particular, rubbish stocks (or possibly all stocks) do well as we emerge from a recession.
- Bombed out cyclicals in particular are a good bet.
Gromley helpfully annotated the JPM chart that Howard supplied, to show which factors are best at various points in the cycle:
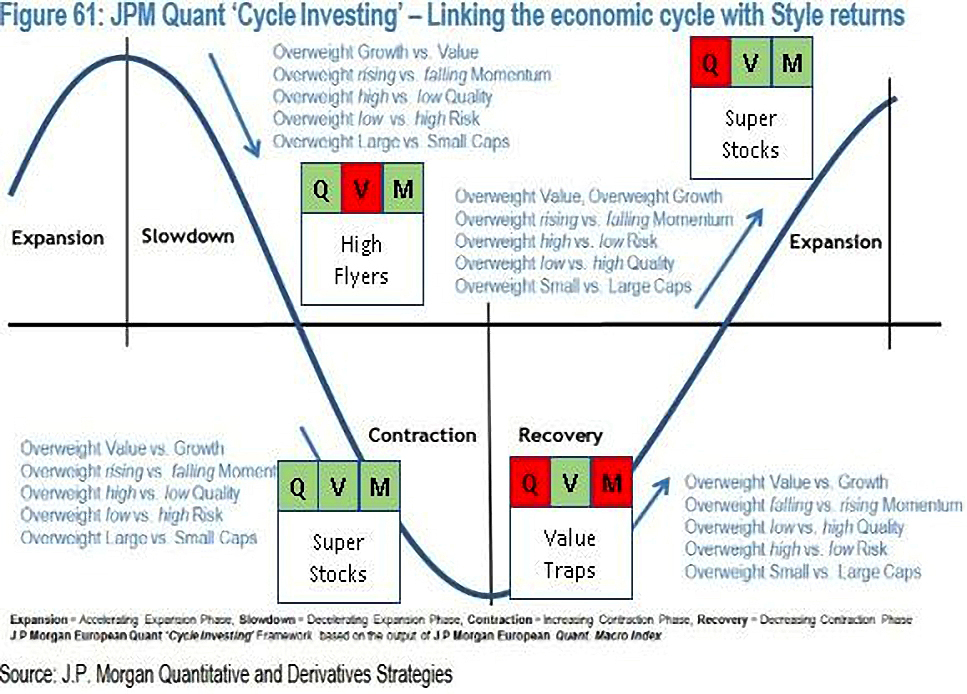
It’s really only the recovery phase where you should buy the “wrong” stocks.
- And in this phase, most kinds of stocks will do fine.
Note that there’s a typo in the annotated chart (hat tip PhilH) – the VM stocks that work in expansion are called Turnarounds, not Super Stocks.
Lower ranks
Jjis (!) said that stocks in the 50-60 range do surprising well, and he likes to diversify his portfolio from the high ranks down to 50.
- I do this as well, but through inertia.
- I mostly buy stocks that are ranked above 80, but I sell them when their rank drops below 50 (unless the chart tells me not to, or I have already sold them because they hit a stop loss).
Nick Ray said that Value was the most dangerous metric, and “V > 85 is often a warning sign”.
- He identified 25 < V < 60 as the best range.
Conclusions
The StockRanks work.
If you aren’t already a subscriber to Stockopedia, I recommend that you sign up.
- Please use this affiliate link, which will extend my own subscription sligtly.
I’ll be back soon with a stock screen based on what Ed sees as the most admirable stock characteristics.
Until next time.
Mike Rawson
Mike is the owner of 7 Circles, and a private investor living in London. He has been managing his own money for 40 years, with some success.


Thanks for the article, I’m keep to start factor investing. I’m trying to work out whether I have a large enough portfolio to start buying individual stocks for factor investing. If you need a minimum of 20 stocks, what would you say the minimum holding in each stock should be to make the purchase fees worth it? I’m thinking trading costs less than 1% of each holding? Othwise I will have to do it via an ishares etf.
Hi Matthew,
This is one of those things that you have to decide for yourself. If you want to stick to 1% and your trading commission is £5 (iWeb) then you could go as low as £500. Add in the stamp duty and you are up to £1,000. Add in the round trip (sale as well as buy) and you are up to £2K.
So for a 20-stock portfolio, you would need £40K.
I normally start a new style of portfolio with £100K these days (£5K per stock), but I’ve previously started with as little as just one year’s ISA contribs (£15K then, £20K now). Let me know what you decide.
Mike
Hi Mike,
I agree with you, I think £2k minimum per stock would be sensible (so £40k total).
I’m thinking an allocation of ~15-20% of my equities should be in smart beta/factor investing, with the remainder in passive index funds. This means that the total amount of equities I need to justify the individual stock purchases is ~ £200-265k.
I’m in my 20s at the moment so this sum is well above my current portfolio. Therefore I’m planning to get my factor investing exposure from ishares multi factor etf (IFSW). This won’t be as satisfying as doing the stock picking myself, but the transaction fees don’t make sense for myself at the moment.
Thanks again.