Low Vol Anomaly 2 – Stockopedia tools
Today’s post is the second in a series on the Low Vol anomaly, and looks at how Stockopedia can help us to implement a strategy to take advantage of it.
Contents
Risk ratings

The first tools in our kitbag are the Stockopedia Risk Ratings.
- They were introduced (along with the Stock Styles) in a webinar by Ed Croft back in May 2017.
I summarised the content of the call in a post called Risk and Styles.
- The webinar is also up on YouTube if you want to watch / listen:
At the time I wasn’t a Stockopedia subscriber, so I didn’t expect to use either the Styles or the Risk ratings.
- But eight months later, I am a subscriber and I want to exploit the Low Vol Anomaly.
I had a bee in my bonnet about the Risk Ratings having that name, since they were based on historic volatility, and as we know, Volatility is not Risk.
- Volatility was introduced to the Efficient Market Hypothesis back in the 1950s because it made the maths easier.
Low Vol Anomaly
But of course the name doesn’t invalidate the Low Vol Anomaly, which Ed covered in his talk.
Here’s how the relationship between volatility (here labelled risk) and return is supposed to look (chart from Ed’s webinar):
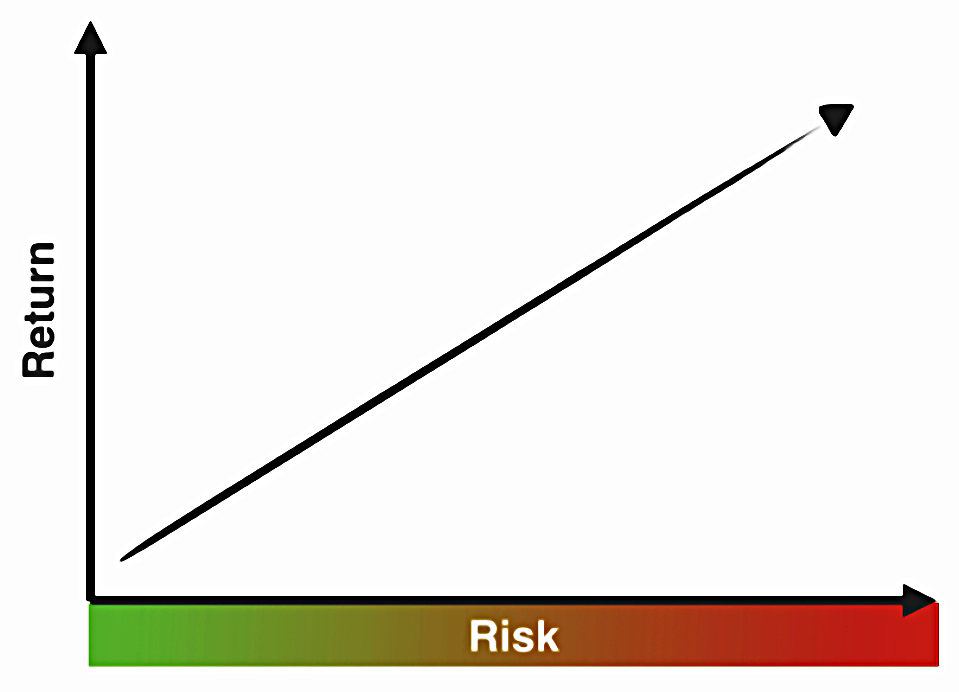
Ed looked at several studies (not just Van Vliet’s) to come up with the actual relationship.
Most [studies] find a fairly flat (or humped) relationship between risk and return, but with a severe drop off in the highest risk segment of the market.
What is almost universal … is a sharp (and almost linear) decrease in risk-adjusted return from the lowest risk to the highest risk deciles.
Here’s what that looks like:
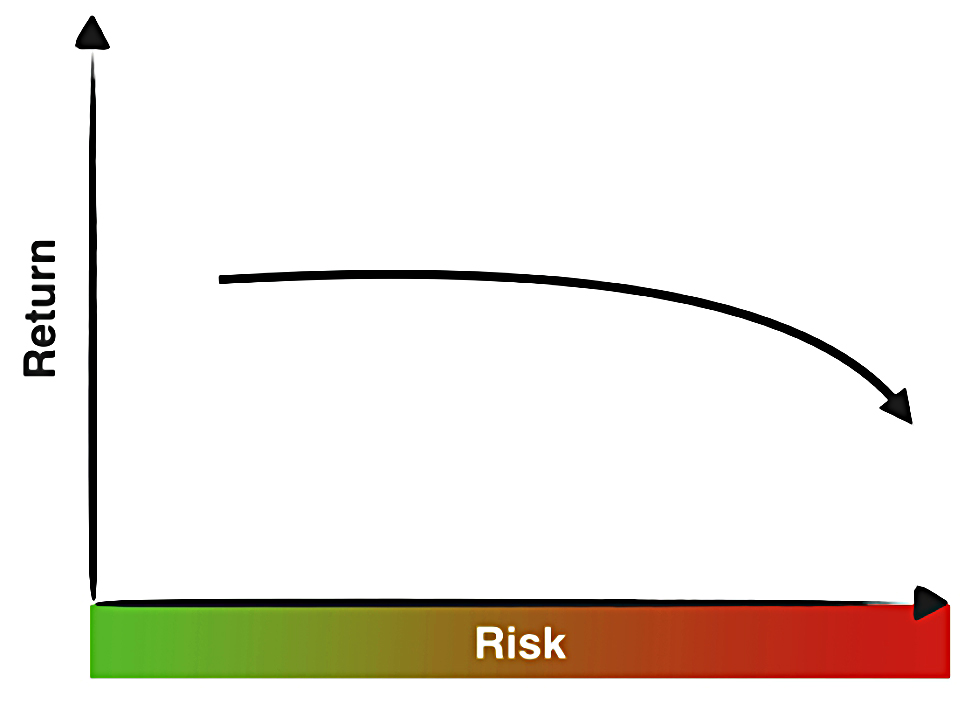
We covered the reasons for this in our previous post in this series.
The implication for Ed from the risk-adjusted return results is that we should choose low volatility stocks, and juice them up with leverage:
A rational investor, rather than buying the higher risk decile, would borrow money to invest in the low risk decile and keep borrowing until the volatility of the holdings was the same as the higher risk/higher return decile.
At the identical level of volatility, the low risk portfolio would significantly outperform.
Of course most investors are leverage-averse or have constraints, so they don’t do this.
One reason they might be leverage averse is that leverage amplifies price volatility, but of course by choosing low volatility stocks to begin with, we create some headroom for this.
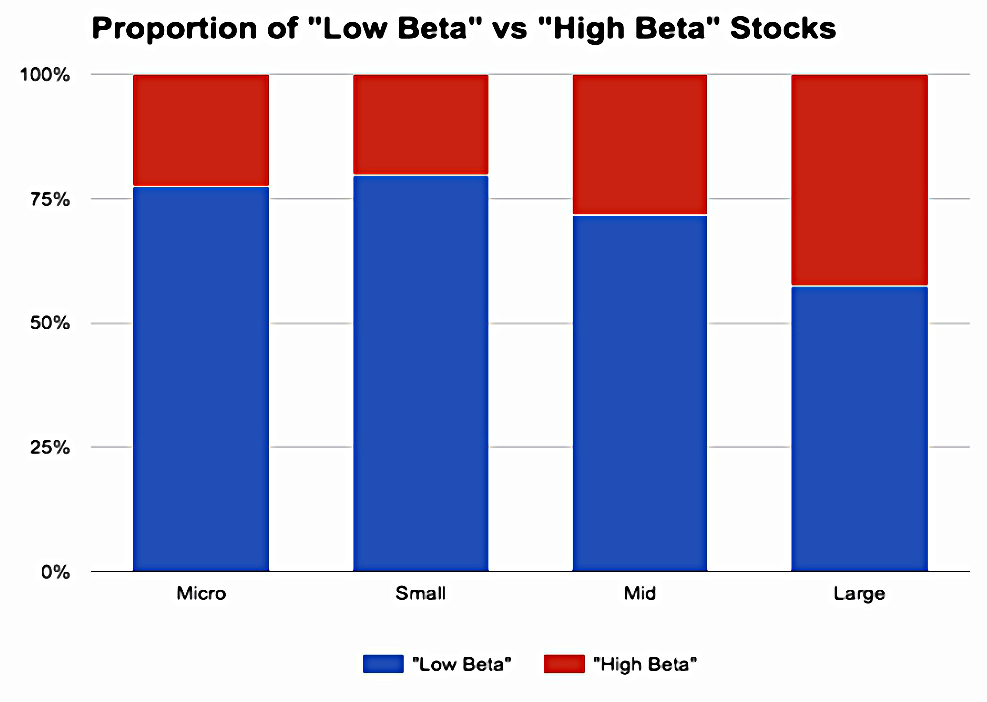
Beta
Ed was asked why Stockopedia don’t use beta (price movement relative to the market index) as a risk measure.
- It’s because – apart from the largest stocks – there are too many low beta stocks to make it a useful measure for private investors.
Risk ratings part 2
So Stockopedia now has five classifications of volatility (or as they call it, Risk) into one of which each share is placed:

Bigger, more predictable companies tend to be at the top of this pile, and smaller “news driven, early revenue companies” at the bottom.
Performance
As predicted by the anomaly, Stockopedia finds that Low Vol stocks do best:
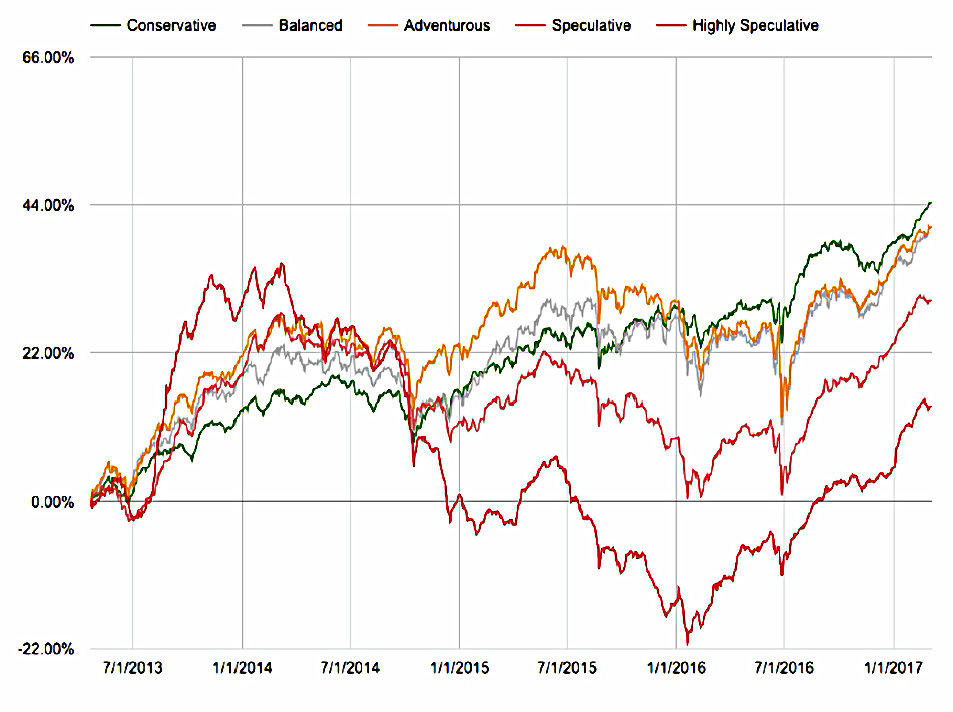
This is a four year chart (to early 2017) with yearly rebalancing.
- Conservative stocks do best, but Balanced and Adventurous stocks aren’t far behind.
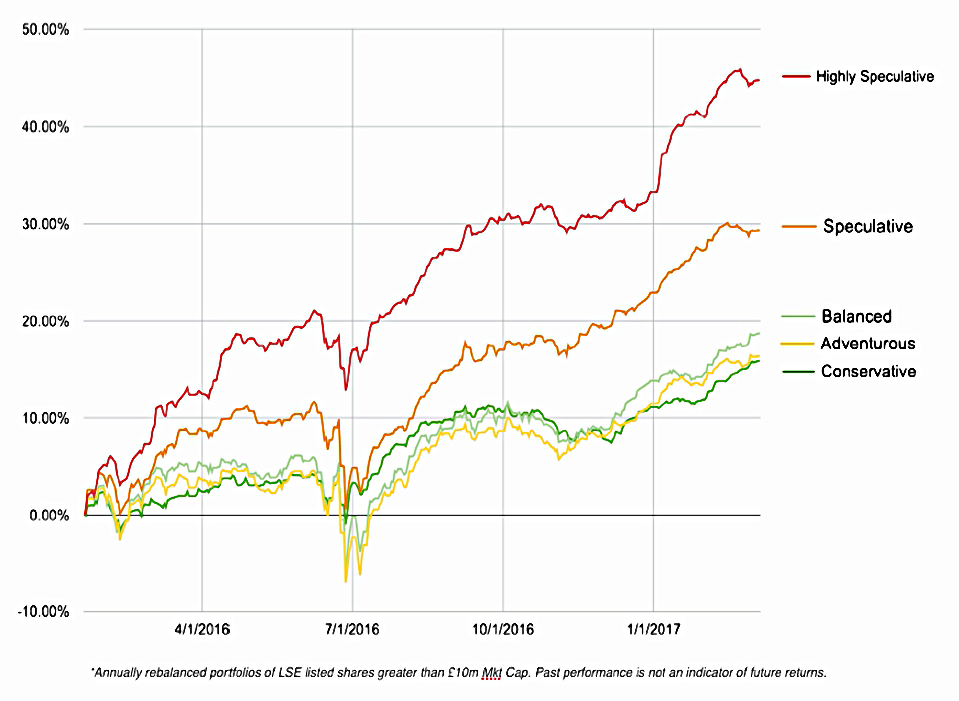
But Adventurous and Speculative stocks do well during “Risk On” periods (bull runs):
Distributions
Ed explained a little about how the ratings are constructed.
- It turns out that Conservative stocks are relatively rare.
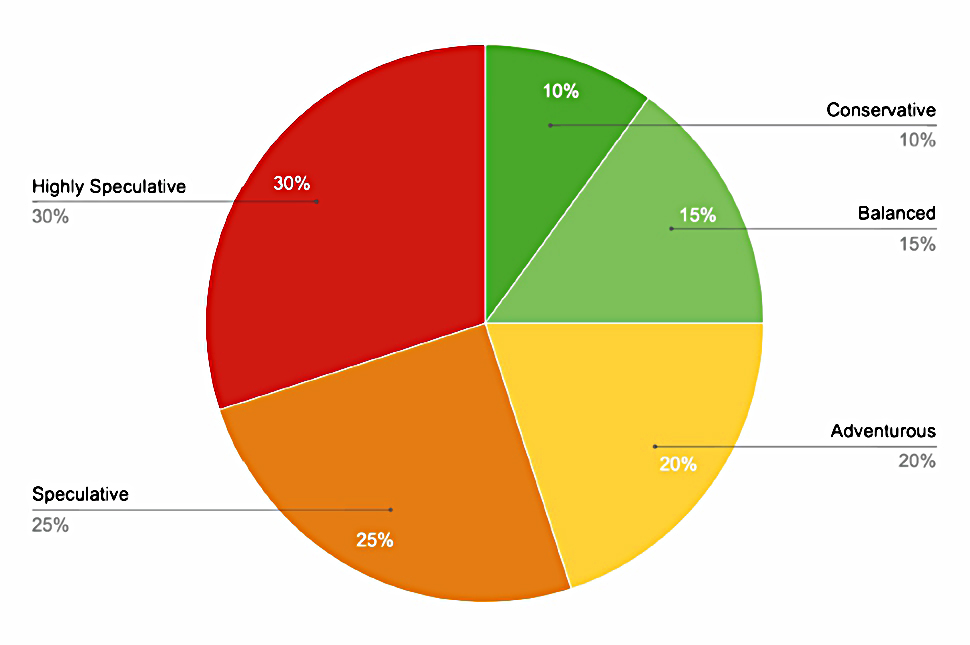
- Note that these allocations are fixed by Stockopedia – there will always be 10% Conservative stocks in the market.
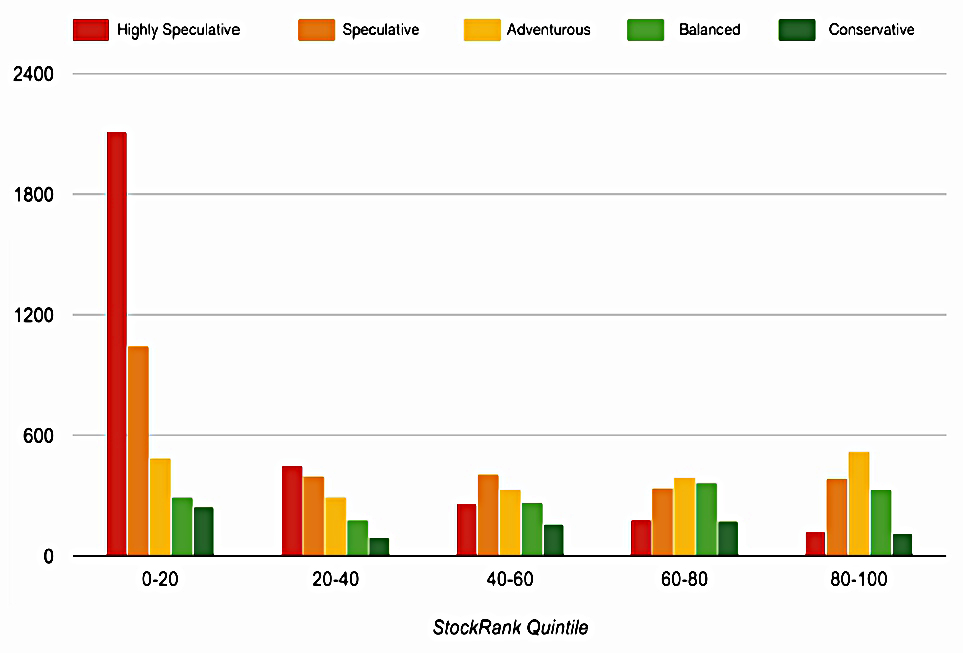
Low Vol Anomaly part 2

Most risky stocks are small, and have poor Stock Ranks.
Quality is also associated with Low Vol:
![]()
And Lov Vol is linked with low bankruptcy risk (Altman Z-score):
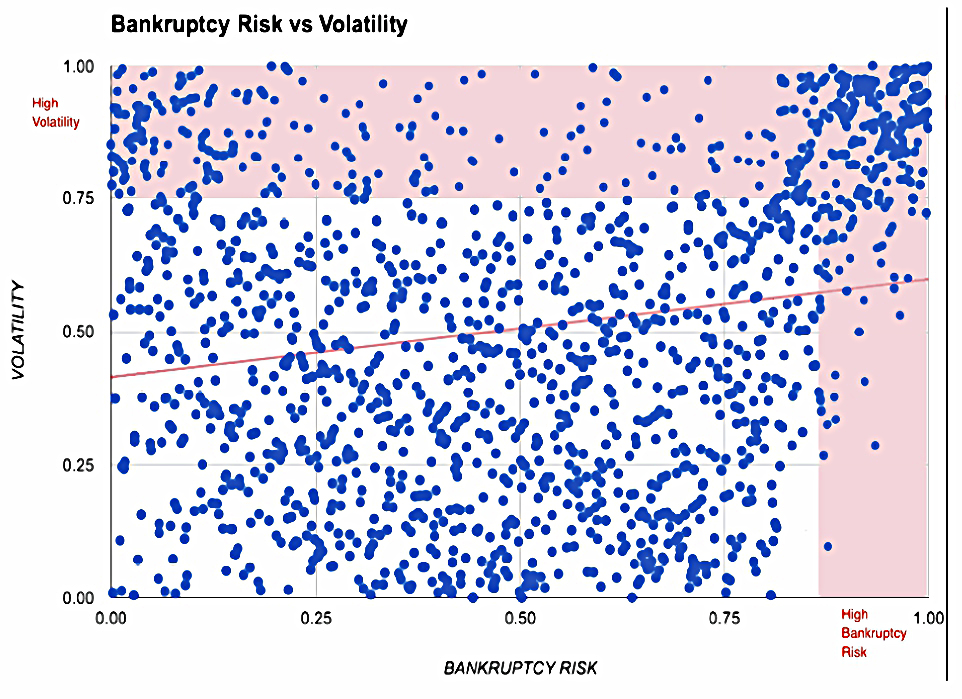
These four charts explain the Low Vol Anomaly:
- small, bad, risky stocks are more volatile
- if you avoid these stocks you will outperform
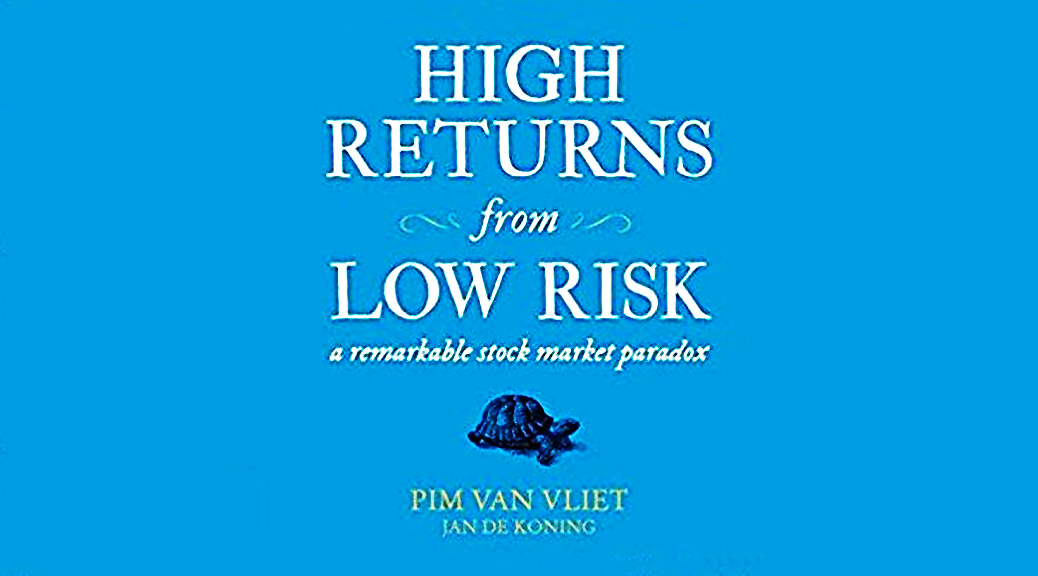
Book review
Later in 2017, Ed posted a review of the Van Vliet book we looked at in the previous article.
- He recommended the book.
- So do I – so long as you set your expectations properly (it contains just the one big idea, which can be explained in a moment).
He admitted that Van Vliet’s research was one of the biggest influences on the Risk Ratings.
He also criticised the industry (particularly the new FinTech firms) for their use of risk / reward sliders.
This one is from Nutmeg:

I think this is a little unfair, since between asset classes, the risk / reward relationship does hold:
- Stocks are riskier than bonds, which are riskier than cash.
- Stocks return more than bonds, which return more than cash.
It’s only within the stock universe that the rule fails:
- low volatility stocks do better than high volatility stocks.
Ed concludes that Van Vliet’s message is “Win by not losing”.
- Investors would be wise to heed it, but Ed expects that most won’t – they are too interested in the risky end of the market.
Ed’s screener
Ed mentions that Stockopedia is one of the screener sites recommended by Van Vliet on the website that accompanies his book.
- To help people directed to Stockopedia from that site, Ed has built a screener to implement Van Vliet’s work.
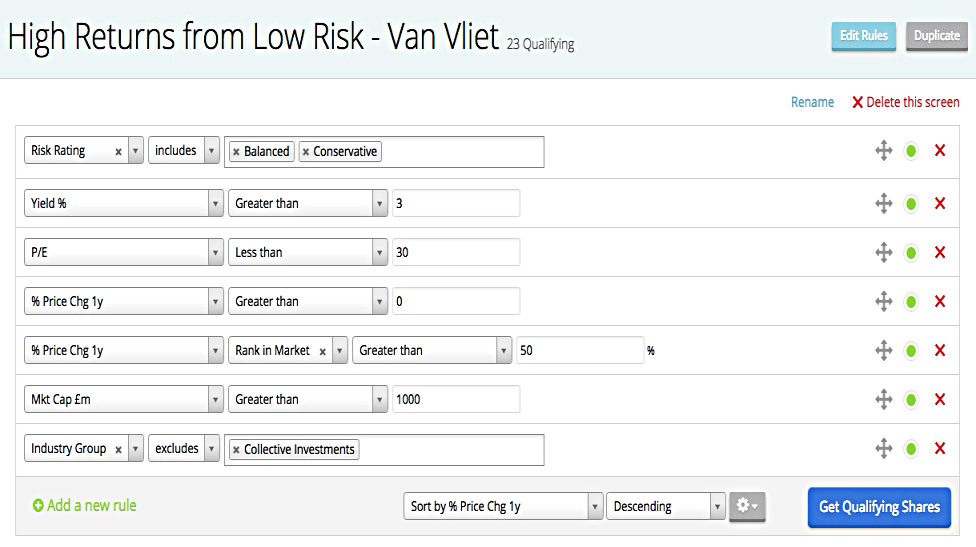
Ed has gone for the bottom two Risk Ratings, which excludes the riskiest 75% of the market.
- In the book, Van Vliet used the largest 1000 stocks, then picked the least risky 50% from within these.
So the possibility of adding back Adventurous stocks (within the top 1000) exists.
- Ed notes however that Van Vliet’s US large cap universe would stretch down in the mid caps in the UK.
- And in this top end of the market, Conservative and Balanced stocks already form close to 50% of firms.
Ed has added a couple of price momentum rules to the Risk Rating exclusions
- There are also size, sector and PE filters.
But his yield measure only includes dividends.
- Perhaps Stockopedia has no data on share buybacks.
Ed said that at the time of writing (June 2017) his screen returned 31 stocks in the UK, 78 in the US, 61 in Australia, 131 in Asia and 137 ins Europe.
- The UK results were skewed towards financials and had poorer average StockRanks than the other regions.
- So he recommended a global approach (( Which unfortunately would require me to take out expensive subscriptions to the other Stockopedia regions )) and deliberate (manual) sector diversification.
I would also introduce a Stock Ranks filter, or at least a manual selection by Stock Rank.
- I don’t want to buy stocks with low overall or individual ranks.
- And I will exclude stocks with negative Styles.
Looking at the comments on the screener, other possibilities include:
- Altman Z-score > 3
- Using earnings yield as an alternative to dividend yield
I can afford to be fairly aggressive with my choices, as I probably only need to find four or five Low Vol stocks for my Defensive portfolio.
That’s it for today.
In the third and final article in this series, we’ll play around with Ed’s screen and see which stocks it returns.
- We’ll also find out whether another close reading of Van Vliet’s book will give us any insights on how to improve Ed’s screen.
Until next time.
Mike Rawson
Mike is the owner of 7 Circles, and a private investor living in London. He has been managing his own money for 40 years, with some success.


“I think this is a little unfair, since between asset classes, the risk / reward relationship does hold.” Definitely a fair comment!
Great write up Mike. We don’t have buyback data, but I do hope to add it to Stockopedia in future.