Naked Trader 2 – Finding Shares

Today’s post is our second visit to the most popular book with UK active traders – The Naked Trader. Let’s look at how Robbie finds shares to invest in.
Contents
Places to look and to avoid
Robbie’s one-line summary of what he is looking for is “shares where something is happening”.
First he lists a few places not to look:
- internet tipsters and tipsheets
- bulletin boards
- guru columns
Now on to where he does look:
- National newspaper round-ups
- from the Times, Telegraph, Guardian, Independent and Mail
- he finds the FT “too dry and heavy-going”, though the Saturday edition is more “thoughtful”
- he sees the tabloids as a contrarian indicator – when they get interested in shares, it’s time to sell
- he’s looking for shares that have gone up or down (and why), plus interesting news stories
- Investment magazines
- Robbie looks at the Investors Chronicle and Shares
- but he doesn’t buy their tips, as these have already been marked up by the market makers on the morning of publication
- it’s good to know what has been tipped, since otherwise you might look for a more significant reason for the price rise (( These days, Twitter will let you know whether a price rise is from a tip ))
- he likes the summaries of recent results statements (( In a similar vein, the Small Cap Value Report on Stockopedia – written by Paul Scott with help from Graham Neary – provides daily comment on small cap stocks ))
- ADVFN news wire and Top lists
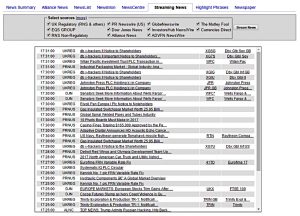
- the news wire is the “Streaming News” page – there’s a picture below of what it looks like
- this is particularly useful from 7 am to 8 am, when the company report RNSs are published
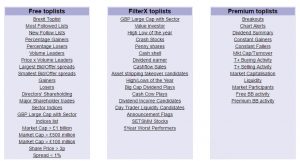
- we came across the Toplists last time – there’s a refresher picture below – they show shares on the move for some reason
- not surprisingly, Robbie is particularly interested in the premium lists, which require a paid subscription (( In my edition of his book, he offers a discount on the first year’s subscription to all his readers ))
- the subscription also allows access to the premium bulletin board area, including Robbie’s own personal bulletin board (( I don’t know if this is still active ))
Which toplists?
- Robbie uses mostly the percentage gainers and losers (which is free)
- and also Breakouts (from trading ranges established over 20- 60- and 250-days)
- He prefers stocks with market caps between £50M and £900M
For me, that’s a fairly underwhelming list of sources.
- They are all fairly well known sources and techniques
- And there’s not much detail so far on which companies to choose from the many mentioned
Research
Robbie says that he wants to know everything about a company before he buys.
- He focuses on finding the negatives, to put him off buying.
- His role models during research are “cut the crap” merchants Alan Sugar and Gordon Ramsey.
The lazier you are about research, the less money you’ll make.
I am looking for a share that has everything going for it with no question marks.
Here’s Robbie’s list of questions to find answers to:
- What’s the company worth (what’s the market cap)?
- as noted above, Robbie likes the £50M to £950M range, as these smaller companies usually have better growth prospects
- What does it do and what sector and market is it in?
- Robbie usually ignores AIM stocks, primarily because at the time he wrote his book, they weren’t allowed in ISAs, his main trading vehicle
- these days they are allowed, and I’d be interested to know if he’s changed his position
- What does the company website look like?
- back in 2007, this was probably a useful discriminatory factor, but nowadays most websites are pretty good
- today, you might look for online customer reviews instead
- What were the profits (or what’s the PE ratio), and are profits rising?
- How big is the dividend, and are dividends rising?
- Is the trading outlook positive?
- are the company’s markets (ie. the demand for its products) likely to improve or get worse?
- are there any negative things happening?
- What is the net debt?
- Robbie likes debt to be less than three times profits
- Is the share price rising, and what is the spread?
- Robbie looks for rising price charts over one year and three years
- and he won’t trade stocks with a spread of more than 5% (they are too illiquid)
- Have there been any significant trades?
- look for buys or sells from institutions or insiders (directors – check the RNS for this)
- director buys are a good sign (but could be a deliberate attempt to boost confidence in the share)
- director sales are not necessarily bad (they could just need the money for something)
- the bigger the buy / sell (in £££, but also relative to their holding), the more significant
- When is the next company statement due?
- Robbie’s not keen to buy in just before the next statement
As you probably anticipated, Robbie uses ADVFN to find these answers.
- In particular he uses the Quote, Financial and News pages (the last to find a recent report statement).
Traffic light system
Robbie uses a traffic light system (also known as RAG – red, amber, green – though Robbie actually uses blue as well) to analyse company reports.
- This is really a highlighting feature available on the ADVFN News page. (( There are similar plugins for web browsers, so you could use any copy of the company report that you find anywhere on the web ))
These are the words that he colours red:
- challenging, difficult, down by, unpredictable, lower, poor, difficult trading, tough, below expectations
For amber (yellow) he uses just one phrase:
- in line with expectations
For green, he has:
- exceeding expectations, positive, favourable, profit up, excellent
For blue, he uses:
- debt, banking facilities, bank covenants
If the report is mostly green, the stock is a buy.
- If it’s mostly red, it’s not a buy, and could be a sell.
The blue bits are for working out whether the company has too much debt (see below).
WAGS and SHAGs
As we all know, WAGS stands for “wives and girlfriends” (( Originally of footballers, but for Robbie, of Sharebuyers ))
- The acronym is a reminder to check with your partner before buying a stock in the retail sector.
- They will know whether it’s hot or not.
Of course, if you are female yourself, or very fashion / shopping oriented, this step won’t be necessary.
SHAGs (Share traders’ Husbands and Gigolos) are the opposite:
- Blokes usually know more about the tech sector.
Charts
Robbie thinks charts are important, but he wouldn’t buy just on the basis of a chart.
Charts show the history of a share price.
- Which means they show the prices at which investors are likely to buy and sell in the future.
- Support is the price that the share tends not to go below (looking back for, say, a year)
- Resistance is the price that the shares can’t seem to rise above
He’s not a chartist / technical analyst (TA).
- He uses charts for breakouts, and for setting sell targets and stop losses.
- But he also uses fundamentals.
Chart patterns
Robbie also uses a few chart patterns:
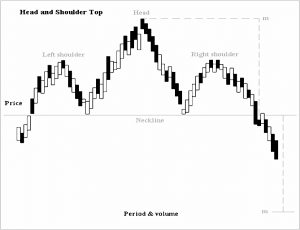
the Head and Shoulders is an indicator that a price rise has run out of steam
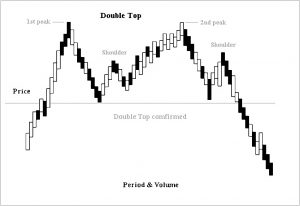
so is a Double Top, and a Triple Top (no picture)
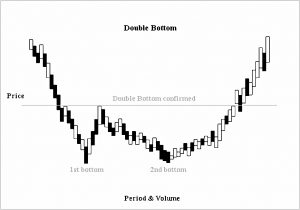
a Double Bottom means the opposite – the price is about to go up
- as does a Round Bottom and a Cup and Handle (no pictures)
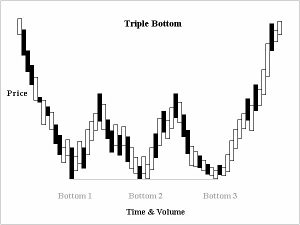
and a Triple Bottom
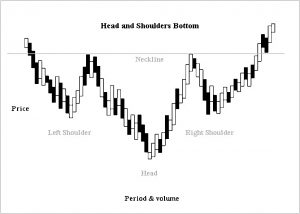
and a Head and Shoulders Bottom
Buybacks, AGMs and Perks
Robbie is not a big fan of share buybacks.
- He thinks that undervalued shares are undervalued for a reason.
He doesn’t comment on the technical effect of the cancellation of the bought-in shares.
- With fewer shares in the market, earnings per share will rise.
- This can lead investors to push the share price higher.
He’s not a big fan of AGMs and investor open days either.
- They are “usually pretty dull affairs” but “if you’ve got the time and energy, why not”.
He prefers the investor evenings put together by firms like Proactive Investors.
- These evenings will have two or three company presentations.
- They are free and usually include wine and canapes.
Nor does Robbie show much interest in company perks.
Don’t buy shares just because of the perks!
Timing
Robbie’s advice is that once you’ve found some potential share prospects, you should add them to your watchlist (monitor), to get a feel for how the price moves.
I’m not sure about this one.
- You can see the price movements in the past year’s charts.
If you are convinced about the stock you might as well buy straight away.
- The important thing is to use a stop loss, and make sure you don’t get stuck in a loser.
- If you are trading a lot of stocks, this approach will work out okay over time.
If you have a more concentrated portfolio (12 to 20 stocks) you’ll be more interested in timing your purchases correctly.
If you do want to do this, Robbie has a few tips on what he looks for:
- positive momentum
- good volume over previous day or two
- positive chart (rising / breaking out / lots of support)
- price rising on the day of purchase
- results approaching (but not tomorrow)
- Level 2 looks positive
- the wider market is going up
Trade log
Robbie recommends recording every trade you make, including:
- why you bought the company
- your profit target / winning sell price
- what’s your timescale for getting there?
- a stop loss (losing sell price)
This is good advice.
Stop losses
Robbie wants his stop loss to be at least 10% below his buying price, and below any obvious support.
- Of course, the market makers will know that there are a lot of stops in that area, and they may try a tree shake to get you out of the stop.
- So you might want to put your stop a little lower than that.
Personally I use stops between 10% and 20%, depending on the size of the stock (wider stops for smaller, more volatile stocks).
- I don’t always use real stops, sometimes just using mental ones.
- I use guaranteed real stops for spread bets.
Robbie also recommends trailing stop losses – those that move upwards with the share price.
- Many brokers will now set these automatically for you.
Profit targets
Robbie is always looking for at least a 20% gain, but he won’t sell at that point.
- He always runs his winners, and is really looking for 50% and more.
IPOs
Robbie is a big fan of IPOs – initial floats of shares.
- That’s mainly because he’s had a lot of big winners from them.
He much prefers main market new listings to those on AIM.
- Sectors he likes include oil & gas, hedge funds, finance, tech and renewable energy.
- Sectors he doesn’t like are retailers, and stocks he doesn’t understand or see the growth potential in.
I’m not a fan of IPOs, for reasons that I’ve discussed here.
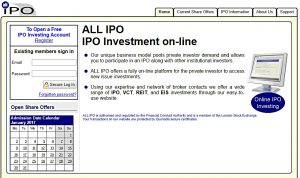
To monitor new floats, Robbie uses a site called All IPO.
- This covers VCTs, EIS and REIT share issues, as well as IPOs.
- You won’t be surprised to find that it’s part of the ADVFN empire.
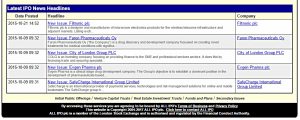
When I looked at the site (front page below), there were no new issues listed, and the New Headlines dated back to October 2015.
- So it looks like this site might be dead. (( If anyone uses the site, or knows of a good alternative, please let us know in the comments ))
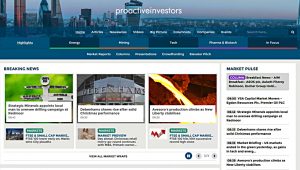
Robbie also likes Proactive Investors for monitoring AIM new issues, even though he invests in far fewer of those.
Here’s the front page of the site:
Robbie’s approach to IPOs is to try to buy early on the first day of trading.
- If he can’t get a price from his broker, and the stock opens a lot higher than the issue price, he will hold off for a few days to see if the price drifts back towards the issue price.
Before we close this section, it has to be said that Robbie’s experience with IPOs is atypical.
- Most investors lose money in IPOs, as most IPOs fall in price at first.
- If you can wait for six months or so, there are often bargains to be had as the minority of good new firms can often be bought on the cheap.
Seasonality
Robbie is a big believer in the seasonality of market returns:
- Dec and Jan are good months – it’s cold outside, people feel good and there’s usually a Santa Rally in December (admittedly often on thin volume).
- Feb and Mar – middling months, on the back of profit taking after Jan (Robbie likes to have cash on hand here).
- Apr – the best month, especially around Easter (Robbie often buys in min-March).
- May, Jun, Jul – here the saying “Sell in May” comes into play; these are bad months.
- Aug – usually good, on thin volumes (many are on holiday)
- Sep – the worst month (Robbie suggests it might be the best month for shorting).
- Oct and Nov – the markets tend to fall, setting up “bargains” for Dec; some of the worst crashes have been in Oct.
So Robbie’s strategy is:
- Buy the FTSE-100 in mid-Dec, sell in early Jan.
- Buy retails stocks in Dec, sell in early Jan (before the mid-Jan Xmas sales reports).
- Buy a few “tiddlers” in Dec to have a gamble.
So he’s really just playing the Santa rally and the Xmas sales.
I agree with Robbie that there is statistical seasonality, but it’s a minor effect in comparison with the natural volatility of stocks.
- Trading costs will usually cancel out most of the gains to be made from timing the market using seasonal factors.
Conclusions
That’s where we’ll leave it for today.
- We’re more than halfway through the book, and I remain hopeful that we can cover the rest in another two articles.
Here’s a summary of the good stuff we’ve covered today:
- look for market gainers and losers, and breakouts
- filter stocks on:
- use a traffic light system on company reports
- look at chart patterns for tops and bottoms
- keep a trade log
- use a trailing stop loss
And here’s the stuff that I think you can safely ignore:
- using newspapers and magazines as sources of good shares
- WAGs and SHAGs
- buybacks, AGMs and perks
- precise timing (of entries)
- profit targets (use the trailing stop loss to get out instead)
- IPOs
- seasonality
I’ll be back in a couple of weeks with the next section of the book, which is about “Winning Strategies”.
Until next time.







the last meeting , his sales are over £40, 000 and a lot of stats are difficult to read at the back of the room. Basics shoild all be given to you an a printed sheet or two but are not, so their is some confusion.
Basically after 7 mentions of a hurt knee fall from his bike, its poor value.. All geared to where RB will make money for himself.