Quality Shares – The Lessons
Today’s post is a summary of the lessons we can learn from How to Pick Quality Shares by Phil Oakley.
Contents
Process

The book provides a three-step strategy to analyse companies in order to find good long-term investments:
- find quality companies
- those with higher returns (profits and cashflows) on your investment
- avoid dangerous (risky) companies
- this is largely to do with debt, including hidden debts (leases and rents) and pension fund deficits
- don’t pay too much for the shares
- though you may have to pay more for quality or growth companies
It’s a quant process (numbers) rather than a qualitative one (people).
- But you only need basic arithmetic skills to follow it.
Quality Companies
Phil uses three things in order to work out whether a company is high quality:
- Profits, where Phil uses two indicators
- Sales and Profit history
- Profit margin
- Return on Capital Employed (ROCE)
- Phil likes to refer to this as a company’s interest rate
- Free cash flow
Profits
The first thing Phil looks for is a company that has been selling more each year.
But you also need the firm to be converting sales into profits.
- Often during periods of strong growth – especially when a company is small – it will not be profitable.
- It may be developing its product, or spending on marketing to build up its brand.
Where things get complicated is that there are six measures of profit.
1 – Gross profits
- These are sales less the cost of goods sold (raw materials, rents, wages and advertising etc).
- Different companies use different expenses, so the number itself is not crucial, but the trend from year to year can be useful
2 – Trading (operating) profits
- Here we also deduct items like depreciation on plant and machinery, and admin costs.
- This is a good and reliable number to use to compare companies, and years – interest (from debt) and tax (on profits) are not included.
3 – Earnings (profit) before interest and tax (EBIT)
- This is similar to operating profit, but includes the company’s share of profits from associates and joint ventures (businesses now wholly owned by the company).
- EBIT is Phil’s favourite profit number.
4 – Profit before tax (PBT)
- Here we add in interest received, and take away interest paid.
5 – Profit after tax (PAT)
- The current rate of UK Corporation tax is 19%, but the effective rate varies by company, making PAT not very useful.
- Phil warns us to be wary of companies with very low effective tax rates, as the condition that keeps them low may not last forever.
6 – Earnings per share (EPS)
- Phil is not a fan of the widely-used EPS number, as it can be calculated in many ways.
- The best calculation is PAT, minus profits due to minority interests and preferred shareholders, divided by the weighted average number of shares in issue throughout the year.
- Buying back shares will increase the EPS without an increase in profits – this is manipulation in Phil’s eyes, but to shorter-term / momentum style investors, share-buybacks and a rising EPS would be a positive sign.
- Phil recommends that you look at fully diluted EPS (adding back future shares from options and convertibles).
Interest and tax
Phil likes EBIT because it’s the best measure of “how good the management of a company is at making money from the company’s assets”.
- In particular, it ignores the effect of interest (and hence debt) and of taxes.
Phil looks for EBIT growth that is larger than revenue growth.
- He recommends a ten-year EBIT view as the best profit indicator.
- This should cover all parts of the economic cycle.
EBIT can also be boosted by cutting costs, but there’s only so far that you can go with this.
Exceptional items
Note that Phil’s uses “normalised EBIT”, which strips out “exceptional items” – one-off gains and / or costs.
What counts as exceptional is a matter of opinion, and many recent accounting scandals revolve around exceptional items that seem to occur every year.
- This is done to artificially boost profits.
Profit margin
Phil also likes to calculate the EBIT margin (profit margin):
EBIT margin = EBIT / sales × 100%
High profit margins are best, since a temporary period of difficulty is more likely to leave the firm in profit.
- Phil sees high margins as combining quality and safety, and he looks for a consistent margin of 10% to 15%.
Different sectors have different profit margins, so you need to be careful in choosing the right comparator companies.
As with EBIT, Phil looks at ten years of margins.
A Company’s Interest Rate
Investors need to understand if a company is getting a good return on what it spends.
- Phil calls this return the company’s interest rate, but it is usually referred to as return on capital (or Return on Capital Employed – ROCE).
- Phil looks for a ROCE of 15% pa or more.
ROCE = EBIT / capital employed × 100%
Phil prefers the term money invested to capital employed, but they sound pretty similar to me.
Balance sheet
This leads neatly into the balance sheet, which also by design includes two ways of calculating a company’s capital:
Assets - liabilities = net assets = shareholders' equity
More usefully for us:
Assets = equity + liabilities
Capital employed
For the first version of the calculation we start with the total assets, and take away “non-interest-bearing current liabilities”.
- These are things like trade creditors, accruals and tax.
These need to be removed because they act like interest-free credit, reducing the amount of money a company needs.
- For example, Domino’s suppliers are owed £52.91m at the end of 2015.
- But these costs have been expensed in calculating the profits.
In practice you can just subtract current liabilities and add back the financial liabilities (short-term borrowing).
- Capital employed = total assets – current liabilities + short-term borrowings
So, Domino’s capital employed was:
- £185.4M – £71.3M + £1Mm = £115.1M
This is the assets version of capital employed.
The alternative method uses the liabilities and equity.
- Capital employed = long-term liabilities (inc. debt) + equity
Note that liabilities here include short-term borrowings.
- For Domino’s, this is total borrowings (£1.0M + £11.4M), plus other long-term liabilities (£5M), plus total equity of (£97.7M) = £115.1M.
Which is of course the same number, since we are just re-arranging the balance sheet.
Cash
Some people remove cash from total assets but Phil says that an outsider can’t know if this cash is really the company’s to do with as it pleases (eg. to repay debt).
- Phil says that leaving cash in the calculation is the more conservative approach
- But obviously at some level of cash (as with the big tech firms at present) any surplus really is free cash.
So there’s an element of judgement here.
Averages
The balance sheet is a snapshot taken on a single day, unlike the income statement which summarises the activity across an entire year.
- So some assets in the balance sheet won’t have been productive for the whole year, and others will have been useful and then sold.
The way to get around this is to average the figures from two years.
Domino’s ROCE
So Domino’s ROCE work’s out at 73.6 / 109.5 * 100% = 67% pa
- Which is extraordinarily high.
Phil says that anything higher than 20% pa is the sign of a quality company.
As usual, Phil likes to look at the 10-year track record.
Leases
Domino’s ROCE appears to be so high because it has what are effectively off-balance sheet assets.
- It leases its shops, and will usually have committed to make rental payments for many years into the future.
- This is a common situation when analysing high street retailers.
Airlines and train companies also frequently have lots of leases.
- From 2019, these obligations will be added to balance sheets.
Until then, Phil calculates a lease-adjusted (rent-adjusted) ROCE.
The first step is to estimate the value of the rented shops (this should appear on the balance sheet).
- Then add this to the amount of capital employed.
And you need to do this for two years because we are using average assets.
- You also need to adjust profits by adding back in the interest portion of the lease payments.
So it’s a four-step process.
Phil calculates the value of leases by multiplying the rental payments by 7.
- A range of 6 to 8 is used by credit rating agencies and most analysts, but you need to be consistent.
The lease payments are usually in a note to the accounts.
Since Phil uses EBIT to calculate ROCE, the interest element of the rents needs to be added back to the profit figure.
- Phil assumes an interest rate of 7% (?).
So Domino’s average capital becomes (£264.2M + £249.9M)/2 = £257.1m
- And the lease-adjusted ROCE is now £84M / £257.1M = 32.7%
This is less that half the previous number, but it’s still terrific.
Today’s post is our second visit to How to Pick Quality Shares by Phil Oakley. Today we’re looking at cash flow.
Cash flow
According to Phil, the cash flow statement is
The most revealing item of financial information that a company gives investors – it shows you where cash comes in and goes out of a company.
Investors can use it to spot aggressive accounting by comparing profits with cash flows.
Cash flow vs profit
Phil reminds us that there have been lots of companies that appeared profitable, but were in trouble because they couldn’t turn their profits into cash.
- Globo is a recent high-profile example from the UK – it turned out to be an accounting fraud and went bankrupt in 2015.
Profits use the accruals, or matching, process within accounting – income and costs are matched within a period (month or year).
- They aren’t based on the actual flows of cash into and out of the firm.
- Bills can be paid in cash at the time of purchase, or they might be paid 30 or more days later.
- There can also be pre-payments, for things like electricity, or equipment rented on an annual basis.
Phil highlights three key sources of difference:
- Depreciation
- Assets that last for more than a year are gradually written off against the profits they help to produce during their usable lifetime.
- But the cash to buy the asset went out of the door in year 1.
- Sales on credit
- Purchases on credit (supplies to the firm)
Free cash flow
Free cash flow (FCF) is the money left over after a company has paid for everything that it can’t avoid:
- Debt interest
- Its tax bill
- Maintenance & replacement of assets (capex)
What can a company do with its FCF?
It can:
- Pay dividends
- Buy back its shares
- Repay debt
- Acquire other companies
All of these can improve returns to shareholders, which is why FCF is so important.
Calculating free cash flow
There are two versions of free cash flow:
- Free cash flow to the firm – FCFF
- Free cash flow for shareholders (or for equity) – FCF.
Net cash flow from operations = cash flow from operating activities + dividends from joint ventures - tax
FCFF = Net cash flow from operations - capex

FCF = FCFF - net interest (interest received less interest paid) - preference share dividends - dividends to minority shareholders
As an example, Domino’s has very little debt / interest payments, so almost all the FCFF turns into FCF.
- Phil contrasts Domino’s with pub company / brewer Greene King.
Greene King generates a good level of FCFF, but it has a lot of debt and pays a lot of interest, so FCF is lower.
So a rule of thumb is to avoid companies with a lot of debt.
- Too much of their FCFF gets paid out to lenders rather than shareholders.
An exception can be made where the FCF is being used to pay down the debt, so that shareholder returns will improve in the future.
How to produce lots of FCF
There are two characteristics to look for in firms:
- High and growing profits that are converted into operating cash flow
- this is called operating cash conversion
- Little need for new assets to support increased profits.
- these are low capex requirements.
Phil examines this by looking at how good a firm is at turning its operating profits (EBIT) into cash.
Operating cash conversion ratio = operating cash flow / operating profit x 100%
Phil is looking for a percentage of 100 or higher here.
- This shows that profits are real and means there is no need to borrow money.
To do the conversion, expenses like depreciation – which reduce profit but don’t affect cash flow – need to be added back.
- Any income that didn’t result in cash coming in needs to be taken away.
- This might be a “profit” on the sale of an asset at more than book value (the value in the balance sheet).
You also need to subtract any increase in debtors (sales made on credit).
- If debtors falls, this would be added back.
- Debtors rising with sales is not a good sign, but debtors falling as sales rise is a good sign.
Creditors works in the opposite way to debtors.
- Increases in stock (inventory) will reduce cash flow without affecting profit, so they need to be taken away.
- Decreases in stock need to be added back.
Top-up payments to pension funds will reduce both operating profits and operating cash flow.
- So the real question is whether the cash payment exceeds the amount expensed in the income statement.
Further adjustments include changes in provisions (for bad debts etc.), changes in working capital, and “other operating”.
- The smaller the working capital, the better the cash flow tends to be.
Interpretation
Companies with lots of fixed assets – manufacturers, hotels, oil explorers, miners or utilities – have big depreciation expenses.
- Adding back depreciation boots their operating cash flow and their operating cash conversion ratio.
Big depreciation expenses usually mean big capex bills, with the cash generated from depreciation ploughed back into the business.
- Avoid companies with a depreciation to operating cash flow ratio of more than 30%.
Good companies are ones that don’t need to spend a lot of money to grow.
- You want to see high conversion rates with low depreciation to operating cash flow ratios.
Phil also recommends looking at changes in working capital (stocks, debtors and creditors).
- High working capital can indicate financial distress or aggressive accounting.
The stock ratio = stock / turnover × 100%
- A rising stock ratio can be a sign of weakness.
- Stock levels are particularly relevant for manufacturing and retailing companies.
Rising debtors are also a sign of aggressive accounting.
- The debtor ratio = trade debtors / turnover × 100%.
A decrease in creditors is also a warning sign: suppliers are demanding faster payment.
- This could mean a loss of buying power, or indicate a risk of bankruptcy.
Low capex requirements
Phil looks for high ROCE (at least 15%) and lots of free cash flow.
- Usually this will mean that the firm doesn’t need to spend much money on new assets in order to grow.
He looks for a low capex ratio (below 30%):
- capex ratio = capex / operating cash flow
A consistently high capex ratio is a warning sign.
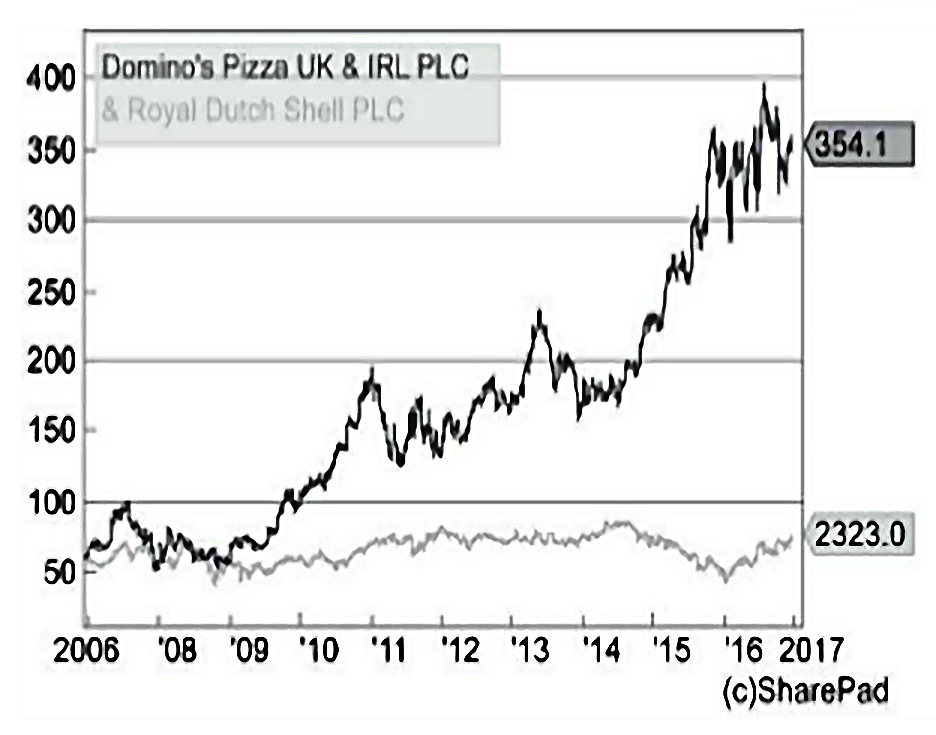
- Phil uses Shell as an example – its capex ratio was regularly above 50%.
Combined with volatile oil prices, this mean that Shell’s FCFF varied (before plunging in 2015).
- Over the 10 years to June 2016, while Domino’s returned 660%, Shell returned just 63%.
Advanced free cash flow
In the next section of his book, Phil looks at eight more advanced topics:
- Is a company spending enough?
- Is negative cash flow always bad?
- Combining ROCE and free cash flow (CROCI)
- Free cash flow per share (vs EPS)
- Depreciation and profits
- How safe are dividend payments?
- When free cash flow is not what it seems.
- Manipulation of free cash flow.
Are they spending enough?
Here Phil is worried about the deterioration of assets.
- This can only go on for so long before a lot of money will need to be spent.
But it’s hard for an outsider to know what this “stay in business” capex should be.
- As a proxy, you can assume that capex should be higher than depreciation
- It’s a good idea to compare the level of spend with other companies in the same sector.
- Using the average over the past five years is also a good approach.
The real problem is when a firm cuts spending when revenues and profits are falling.
- Eventually, worn-out equipment will need to be replaced, hitting FCF.
Is negative FCF bad?
When a firm invests heavily in new assets to grow future sales, it can have low or even negative FCF.
- But if ROCE is high and increasing, then there could be a period of high FCF to come (when the investment cycle completes).
- You would need to consider what the “stay in business” capex might end up being.
CROCI – ROCE meets FCF
If we combine Phil’s two measures, we are looking for businesses that have a high free cash flow return on capital invested – what Phil calls CROCI.
- CROCI = adjusted FCFF / average capital employed
A CROCI above 10% is good (cf. 15% as the minimum for ROCE).
- CROCI (like ROCE) should be looked at on a lease-adjusted basis.
Phil warns in this section against the AIM stocks that have appeared to be profitable but turned out not to be.
The simplest test is to compare normalised earnings per share (EPS) with FCF per share (FCFps).
- To calculate FCFps you just divide FCF by the weighted average number of shares in issue through the year.
FCFps should generally be close to EPS, especially over several years.
- Cashflows are always lumpier than profits, which are based on smoothing out the revenues and costs.
If FCFps is always lower than EPS, there might be a problem.
A growing company could have poor operating cash conversion, because they are making a lot of sales on credit, but you need to be sure that they are real sales.
- Or there could be a build up of stock, which is fine if it eventually will be sold, but can also be used to artificially boost profits
The second explanation is a lot of capex (more than depreciation, like Easyjet).
- High capex needs to be matched by high ROCE, and should not continue for a long period.
- It can be also be a sign of manipulated profits and aggressive accounting (see next section for more detail).
Phil uses four rules when comparing FCFps with EPS:
- FCFps is 80% or more of EPS = definite investment candidate
- FCFps less than 80% of EPS and ROCE is increasing = possible candidate
- FCFps less than 80% of EPS but ROCE is falling = avoid
- FCFps is consistently negative = avoid
Depreciation and profits
We’ve already explained how depreciation spreads the cost of an asset over it’s useful life, writing it off against the profits it helps to produce.
- There are many approaches to working out depreciation.
If management pretend that assets will last longer than they really will, the annual depreciation charge can be reduced, and profits inflated.
- If the real maintenance capex is still spent (as per the genuine lifetime , this will depress FCFps relative to EPS.
Safety of dividends
To check whether dividends are safe, you can compare its FCFps with its dividend per share.
- FCFps should usually be bigger than the dividend per share.
The ratio between the two is the free cash flow dividend cover, and needs to be greater than 1.
As usual, the odd year or two of heavy investment to generate future growth is fine.
- But if the dividend is the higher number for too long, then eventually it will be cut.
When the cover ratio becomes large, it’s clear that the dividend could be increased in the future.
Problems with free cash flow
Phil warns in the next section that sometimes you need to dig into the cash flow statement to be sure that the FCF number can be trusted.
- The first example he looks at is British Land, which had no FCF but was paying dividends.
British Land owns and builds commercial property.
- Its capex spend is usually higher than its operating cash flow, making its FCF negative.
But British Land sells assets as part of its business, and so the cash flows from these sales should really be added back.
When they are, things look better.
- Over 8 years, FCF totalled to minus £2.3bn, but sales were £4.7bn.
- So the net cash flow (£2.4bn) was higher than the total dividends (£1.7bn).
- The free cash flow dividend cover ratio for the period was 1.42.
The second example is RPS, which showed positive FCF, but was regularly acquiring other companies.
- RPS is a consultancy, with mostly people costs and low capex.
- But it makes an acquisition every other year.
Taking away the cash flows spent on the acquisitions reduces FCF significantly.
- And now there isn’t sufficient FCF to pay the dividend.
FCF Manipulation
Although profits are easier to manipulate, Phil outlines a number of ways in which FCF can be manipulated by companies:
- They can delay paying their bills until after the end of the financial year
- This increases creditors and boosts operating cash flow and FCF
- Sell debtors to a factoring company to speed up the receipt of cash from credit sales
- Cut back investment (capex, as discussed above)
- Buy companies rather than assets (again, see above)
Look at what is causing FCF to change.
- Growing FCF should come from growing profits.
Changes in working capital (paying bills later, collecting their debtors faster and holding less stock) and cutting capex are not repeatable year after year.
Avoiding dangerous companies
One of the key contributions to investment success is avoiding the companies that lose you money.
- For Phil, this is all about avoiding excessive debt.
There are three types of debt to look at:
- Borrowings from banks and investors (via bonds).
- Leases (from renting rather than owning assets).
- Phil calls these hidden debts.
- Pension fund deficits.
Normal debt
Some debt is normal – debt is cheaper than equity, and debt interest is tax-deductible, whereas dividends are paid from after-tax income.
So the more debt (and the higher the interest rate) the bigger the share of profits will be spent on servicing it.
- Shareholders will get less of the pie, and perhaps none at all.
The key thing is to only invest in companies with low debt relative to capital employed, profits and cashflows.
Gearing
The effect of debt interest is to multiply the effect of changes in profits on what is left for shareholders.
- This is known as gearing.
One of the reasons that property is such a popular investment is that it’s the easiest asset for the ordinary person to borrow a large proportion of money against.
- 95% mortgages were common for many years, though 80% to 90% loans are more common these days.
This means that with only the 20% deposit coming from your own pocket, a 5% rise in the price of the house feels like a 25% profit on your own money.
- Conversely a 5% fall is effectively the loss of 25% of your equity.
Imagine how you would feel if a friend or relative said that they planned to invest hundreds of thousands of pounds in the stock market, and that they had borrowed 90% of the money.
- That’s gearing, and it’s seen as completely normal with property.
So debt is great in the good times, and bad when things go sour.
- Debt is particularly dangerous for cyclical companies, whose sales move in line with economic and / or commodity cycles.
Measuring debt
Phil uses four ratios to judge debt on the balance sheet (normal debt):
- Debt to free cash flow.
- Debt to net operating cash flow.
- Debt to assets.
- Interest cover.
Debt to free cash flow
Debt to free cash flow = total borrowings / free cash flow
Debt to free cash flow tells you how many years it would take to repay the debt with the current rate of free cash flow it is producing.
- Phil wants this number to be below 10
Property, pubs and utility companies normally have high debt as their cash flows are more stable.
Debt to net operating cash flow
debt to net operating cash flow = total borrowings / net operating cash flow
Net operating cash flow is the cash from trading after tax has been paid.
Phil calls this number a “worst-case scenario” test, as it assumes no further investment assets.
- He likes this ratio to be 3 or lower.
- Again, property, pubs and utility companies would have higher values.
Debt to assets
debt to assets = total borrowings / total assets
Phil likens this ratio to the loan-to-value measure on a house – it tells you what percentage of a company’s assets is made up of debt.
- Phil likes this number to be less than 50%.
- Banks normally have a 90% debt to assets ratio, which is why Phil doesn’t like them.
Interest cover
interest cover = EBIT / interest payable
Interest cover tells us how much bigger the trading profits are than the interest that is due on the debt.
Phil likes this number to be 10 or more, but he insists on a ratio of at least five.
- That gives him a 40% margin of safety before the ratio hits 3, which is where he really starts to worry.
- As usual, utility companies and property companies with high levels of debt are the exception.
Financial engineering
Phil uses the fictitious Bob’s Book Shop to illustrate the effects of replacing equity with debt.
- ROCE does not change, but ROE can increase dramatically.
- This is despite profits (and profit after tax) falling because of the interest on the debt.
So long as the percentage fall in post-tax profits caused by the new interest payments (less the tax saved) is smaller than the percentage of shareholders’ equity that has beeen replaced by debt, ROE will rise.
- Phil prefers ROCE to ROE for this reason.
Hidden debts
What Phil means by hidden debts are mainly leases, where assets are rented rather than owned.
- This keeps the debt off the company’s balance sheet.
It’s particularly important with airlines, railways and retail firms (shops, not online retailers).
Phil uses Domino’s as an example.
Domino’s has two choices when opening a new shop:
- buy (from cash reserves or by borrowing money)
- rent
If it buys, the balance sheet shows an asset (the new shop) and a liability (the debt used to buy it).
- The income statement shows an expense to depreciate the asset over its useful life and the cost of the interest on the new debt.
- Free cash flow is reduced by the money used to build / buy the new asset.
If it rents instead, there’s just an expense in the income statement.
- There’s no impact on the balance sheet, and the hit to cash flow is just the one year’s rent.
- But the company may have committed to a 10-year or even 20-year lease.
Some people think that the store asset and the liability of future rents for 20 years should appear on the balance sheet.
- Not doing this overstates the ROCE by not including the future rents in the capital of the firm.
Analysing rents
Phil has two checks for firms with lots of rental commitments:
- Work out the fixed charge cover.
- How many times can trading profits pay the interest on borrowings plus the rents?
- Capitalise the value of leases.
- Then you can calculate an adjusted ROCE.
fixed charge cover = (EBIT + lease expense)/(net interest + lease)
Domino’s calculation was: (73.6 + 21.3)/(0.02 + 21.3) = 4.5 times
Phil likes this number.
- A range of 1.5 to 2 is common for retailers.
- Domino’s number is better because it mostly operates franchises, which means that the buildings it rents are sub-let to its franchisees.
Phil would not accept a number below 1.3
- He says that attention to this number would have identified problems at HMV, Game Group and Woolworths.
- These companies didn’t have a lot of debt on their balance sheets, but were crippled by rental agreements when profits started to fall.
Phil describes two ways of capitalising operating leases (that is, working out what the future liability might be in today’s money):
- Discount the future lease commitments using an interest rate similar to that paid on existing borrowings.
- Multiply the annual rental expense by between 6 and 8 – a rule of thumb that Phil uses.
Using a 6% discount rate, Domino’s hidden debt is around £150M, down from £156M in 2014.
The annual rental expense was £21.3M, which multiplied by 8 gives £170.5M, somewhat higher than the discounted value.
- Using a multiplier of 7 would have been pretty close, though.
Domino’s hidden debts have been growing as the company has opened up more Pizza shops.
Lease-adjusted ROCE
This has already been covered above.
Phil looks for:
- A minimum lease-adjusted ROCE of 15%.
- A minimum fixed charge cover of a 2.
Sale and leasebacks
Phil reminds us that the sale of properties to real estate funds – followed by renting the sold properties instead – was a big warning sign in the case of Tesco.
- Tesco used the cash this generated to pay dividends and invest in its stores.
- It didn’t have the underlying free cash flow to do this.
Pension fund deficits
Phil’s basic point is that shareholders are last in the queue for the profits and cashflows of a company.
- Not only are banks and bondholders in front of them, but so are pensioners (or to be precise, the company’s pension scheme).
For various reasons (poor returns, the effect of low interest rates on calculations of future liabilities, over-promising to previous employees) many defined benefit pension schemes are in deficit.
- They don’t have enough assets to be able to say they will meet their future liabilities, even though in many cases they were closed to new employees years ago.
So it’s likely that more assets will need to be transferred into the pension fund in the future.
- This could lead to future dividend cuts, or even to bankruptcy.
Effectively, a pension fund deficit is another debt, albeit one that is sensitive to several variables and can change from year to year.
- So you should try to avoid investing in companies with large (defined benefit) pension fund deficits.
Phil would like to see the pension deficit be less than 10% of market cap.
Falling interest rates (as per the last 30 years) are bad news for pension deficits.
- But when (if?) rates eventually rise, then pension deficits will shrink.
Phil likes to see that FCF per share remains significantly higher than dividends, despite any extra pension contributions.
Pension fund questions
Phil suggests the following analysis:
- Is there enough free cash flow to plug the hole in the pension fund and still pay dividends?
- Divide the deficit by ten – this is the target annual top-up payment. Is the firm actually paying this much?
- If a company is paying less than this, remember to reduce free cash flow by the missing amount and compare what’s left with the dividend.
- Look at the sensitivities to interest rates, inflation and life expectancy
Valuation
The last section of Phil’s book concerns valuation.
- It’s no use finding a good, safe company if you then pay too much for it.
Phil accepts that most high quality companies will come with fairly high valuations, and they can rarely be bought on the cheap.
- But there is still a price that is too high for any firm.
Phil’s method involves looking at how much of a company’s share price is based on its current profits, and how much is based on growing profits in the future.
- He even provides a maximum price that you should pay for a share, and a target price for selling it.
Fair value
One common starting point for valuing shares is “fair value”, which usually involves a discounted cash flow (DCF) calculation.
- This involves estimating the future cash flows to the shareholder that the company will produce
- And then discounting them back to the present day, to find out what is known as the “present value”.
Phil suggests that a higher discount factor (d) be used for small and / or indebted firms, since they are more likely to go bust.
- The higher d includes a margin of safety into the calculation.
The problem with this method is its extreme sensitivity to the chosen discount rate, and to a lesser extent the unreliability of cash flow forecasts that are a significant period into the future.
- I think that the sensitivity of DCF calculations to the discount rate makes them a tricky tool to use, though there may be some merit in using DCF to compare quite similar companies (in the same sector, say).
Phil says that there are two reasons why share prices move up and down:
- a change in expectations of future profits
- a change in interest rates
After a profit warning, even investors who don’t use DCF can work out that a share is worth less.
A rise in interest rates means that shares are worth less to those who value them like bonds.
- The “interest rate” people require to hold shares will rise, pushing down the breakeven purchase price.
I would argue that not everyone in the market values shares as if they are bonds.
- Most people use “shortcuts based on multiples of a company’s profits, cash flows or assets” instead.
At the same time, it’s clear that low interest rates (as today) underpin high share prices.
The PE ratio
Phil doesn’t like the PE ratio, the most commonly used valuation ratio:
PE = price / earnings per share (EPS)
At first sight, a high PE is expensive and a low PE is cheap.
- But earnings are easier to manipulate (via accounting policies) than cash flow is.
And earnings can be “bought”, through investments in assets or through buying another company.
- Phil prefers a rise in earnings to come from increased sales of existing products and services.
Buybacks are popular with executives for several reasons:
- they boost EPS, which can support the share price (many execs have share options, or bonuses linked to EPS)
- they offset the issue of new shares as options
- there can be tax advantages, particularly in the US
Whether buybacks add value really depends on the price at which they are made.
- If the shares are bought at less than fair value, they add value.
- If the shares are bought at more than fair value, they subtract value.
Warren Buffett has a buyback policy at Berkshire Hathaway which reflects this analysis.
Phil prefers special dividends, though this is obviously with the benefit of hindsight.
- Sometimes “bad” share buybacks work out, because the share price goes up.
- And special dividends can create tax problems for some investors.
EPS
Phil has some more criticisms of EPS (and by extension, PE ):
- EPS is not the same as cash profits
- EPS may be based on unsustainably high profits (or temporarily low ones)
- This is particularly true of cyclical firms.
Cash profits
Phil has said previously that cash flow is a better (less easy to manipulate) number than profits.
- Now he tells us that cash flow can be manipulated in the short term.
- We need to work out “cash profits” instead.
One of the things a firm can do to boost free cash flow is to cut back on capital investment (capex).
- Other distortions include tax refunds, pension fund top-ups, restructuring costs and litigation.
Phil uses Close Cut Lawnmowers as an example.
To boost cash flow (and hence the share price), the firm decides to:
- reduce inventory from 20% to 15%
- chase customers for payment, reducing debtors from 8% of sales to 7%
- delay paying suppliers and increase trade creditors from 15% to 17%
Phil seems to view these measures as something close to manipulation.
- But I see them as legitimate and welcome (albeit one-off, non-recurring) efficiency measures.
The changes bring in £5M, £1M and £2M respectively.
- From a £2m outflow in working capital the previous year, this is a swing of £10M.
Free cash flow increases from £14M to £24M.
- Since the company has been valued at 10 x FCF, this should add £100M of value to the share price.
But it’s a one-off boost.
- As sales and profits increase by 5% with no further squeeze on working capital, FCF falls back to £16.6M.
Owner earnings
Warren Buffett calculates the cash profits of Berkshire Hathaway – what he calls the “owner earnings” – each year in his letter to shareholders.
Owner earnings = net income + depreciation + other non cash items - maintenance (stay in business) capex
Any extra working capital (for more stocks or generous credit terms) is added to maintenance capex.
Owner earnings / no of shares = cash profit per share.
Maintenance capex
The hardest part of Buffett’s formula is working out maintenance capex.
Phil offers three solutions:
- The company tells you.
- Use a multiple of depreciation, say 120%
- This won’t work if the cost of replacing assets is falling (eg. technology).
- Use a five- or ten-year average of capex
- Some of this will have been spent on growth, but it all needs to be replaced over time.
- Phil prefers this option, and uses the higher of the 5yr and 10yr averages.
In asset intensive companies like Anglo American (mining) or Tesco, depreciation can be higher than average capex.
- This leads to poor FCF and modest ROCE and CROCI
In media companies (ITV, Sky), capex is less than depreciation.
- This can look like under-investing, but usually reflects the writing down of intellectual property like programme libraries.
Phil uses three methods:
- Cash yield, for comparison with interest rates on savings or bonds.
- Earnings power value (EPV)
- This is the value of the shares if the current cash profits continue forever.
- You can work out the proportion of the current share price that can be explained by current cash profits (more = cheaper).
- The remainder is due to growth expectations (more = more expensive).
- A maximum target share price
- Phil bases this on the yield on government bonds
Cash yield
Cash yield = cash profit per share / share price
So for Domino’s at 320p, with a cash profit per share of 11.6p, the yield is:
- 11.6 / 320 = 3.62%
This is better than cash or bonds, but is it enough to hold the stock?
Cash profits will need to increase significantly to produce a good return.
- Phil includes a table assuming 10% pa growth in cash profits to illustrate this.
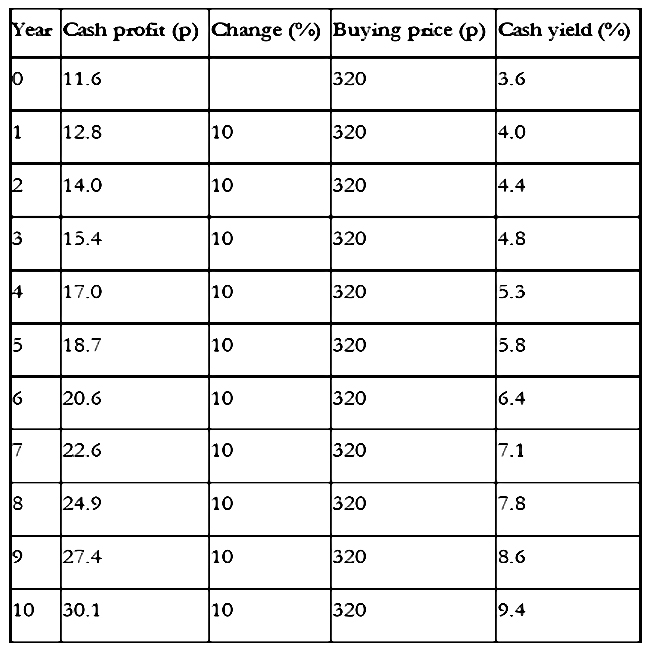
With 10% annual growth for ten years, the cash yield still doesn’t reach 10%.
Phil likes to see a starting cash yield of 5%.
- For Dominos with a cash yield per share of 11.6p, that gives a buying price of 232p.
Earnings power value (EPV)
The EPV is the value of a share if its current cash profits stay the same forever.
It’s a long calculation:
- Start with profits (normalised trading profits or EBIT).
- Add back depreciation.
- Take away “stay in business” capex.
So far this is Buffett’s “owner’s earnings”, or Phil’s cash profit.
Next:
- Tax the cash profit
- Phil suggests using the standard corporation tax rate, to be conservative.
- Divide by your required interest rate to get an “enterprise value”.
- Phil suggests a rate of 7% to 9% for FTSE 350 companies.
- or 10% to 12% for smaller and / or more risky companies (including those with volatile profits and / or lots of debt)
- Take away debt, the pension fund deficit, preferred equity and minority interests to value the equity.
- Add any surplus cash.
- Divide by the number of shares to get EPV per share.
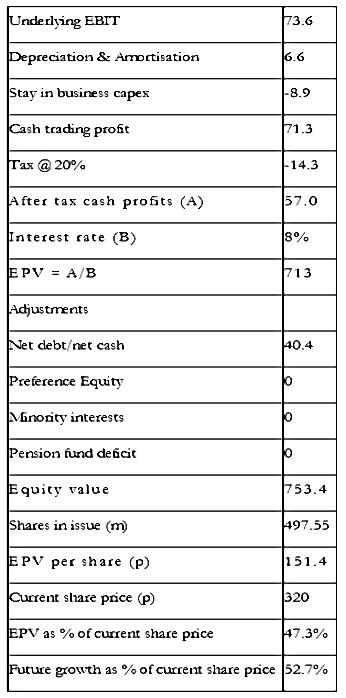
Domino’s EPV of 151p is only 47% of the share price at the time (not good).
- Phil recommends 50% of share price as a minimum level for EPV.
Maximum price
Good companies will never be cheap, but how much is too much?
- Buffet divides the cash profits by the yield to maturity (gross redemption yield) of government bonds.
So if cash profits were 10p per share and bond yields 5%, the maximum value of the share is:
- Maximum value = 10p / 5% = 10 / 0.05 = 200p
This is a “cash PE” of 20 (= 1 / 5%).
Of course, bond yields are much lower today (UK 10 year yields are 1.3%, and were only 0.9% when Phil wrote the book) and a multiplier of 77 could be justified on this basis.
- But when bond yields are so low that you don’t want to buy bonds, it makes no sense to use the bond yield as the target interest rate for the shares you plan to buy.
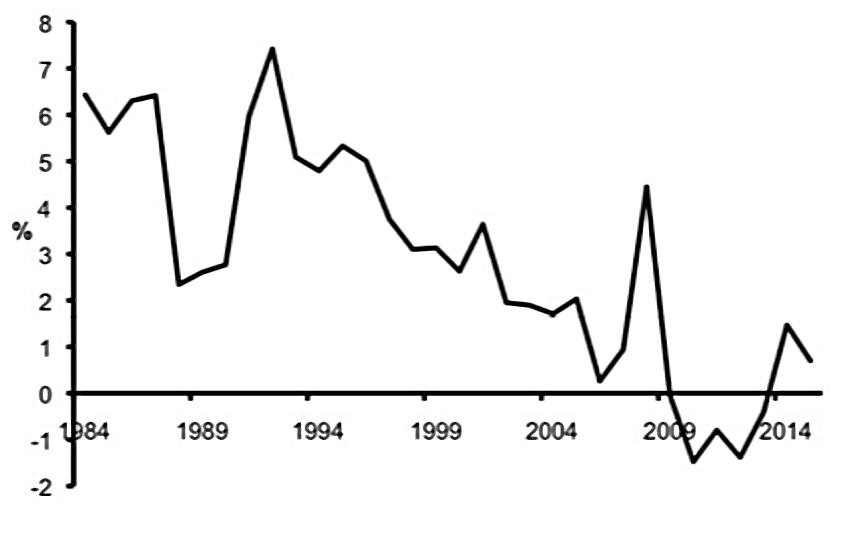
Phil suggests using the average gilt yield over the last 30 years.
- This was 6.4% when he wrote the book, and gives a multiplier of 15.6 (= 1 / 6.4%).
An alternative is to use the average real yield over 30 years and add in current inflation.
- When Phil wrote the book, the average real yield was 3.0%
- Inflation was 1.4%, so his target return is 4.4% – this gives a multiple of 22.7 (= 1 / 4.4%).
CPI for October 2017 was 3.0%, giving a target yield of 6%.
- This gives a multiplier of 16.7 (= 1 / 6%)
I wouldn’t expect to find too many qualifying stocks in the current bull market.
- The FTSE all-share has a forward PE of around 15, slightly higher than average.
But we would be using trailing cash profits rather than forward ones.
- And we would be looking for the best companies, which are likely to be more expensive.
Growth, quality and price
Growth is very important to Phil, since high share prices can fall quickly when profits stop growing.
He uses the Restaurant Group in 2016 as an example.
- The shares were priced at over 700p, on a PE of more than 20.
- After a series of profit warnings, the valuation halved to a PE of 10 and the price dropped by 60%.
A lower valuation on smaller profits means a nasty price drop.
Phil also notes that “over-paying” for the best companies can work out in the long run.
- This is the Buffet approach – long-term holdings of high-quality shares that earn high returns on capital.
Conclusions
I must admit that Phil’s book has defeated me.
With each of the other seven books we looked at this year, it was relatively straightforward to summarise the content in a single article of 3,000 to 4,000 words.
- Even Excess Returns – the densest investment book I’ve ever read – could be boiled down fairly well.
But Phil’s book just has too much technical detail, which is why today’s post is the longest I’ve ever written for the blog.
- Worse than that, I’m not convinced that I’ve made the content that much easier to understand.
I strongly recommend that you go back to the original articles, which you can find here.
- Or read the entire book yourself.
To make amends, I’ll be back in a few weeks with one more post on Phil’s book.
- I plan to try to make a stock screen out of his many rules.
Until next time.
Mike Rawson
Mike is the owner of 7 Circles, and a private investor living in London. He has been managing his own money for 40 years, with some success.