Stan Weinstein’s Stage System 2 – Refining Buying

Today’s post is our second visit to the book “Secrets for Profiting in Bull and Bear Markets.” Today we’ll be refining the buying process for Stan Weinstein’s Stage System.
Contents
Refining the Buying Process

Last time we looked at charts and buying.
- In the book’s next chapter, Stan looks at ways of refining the buying process.
Less (and older) resistance
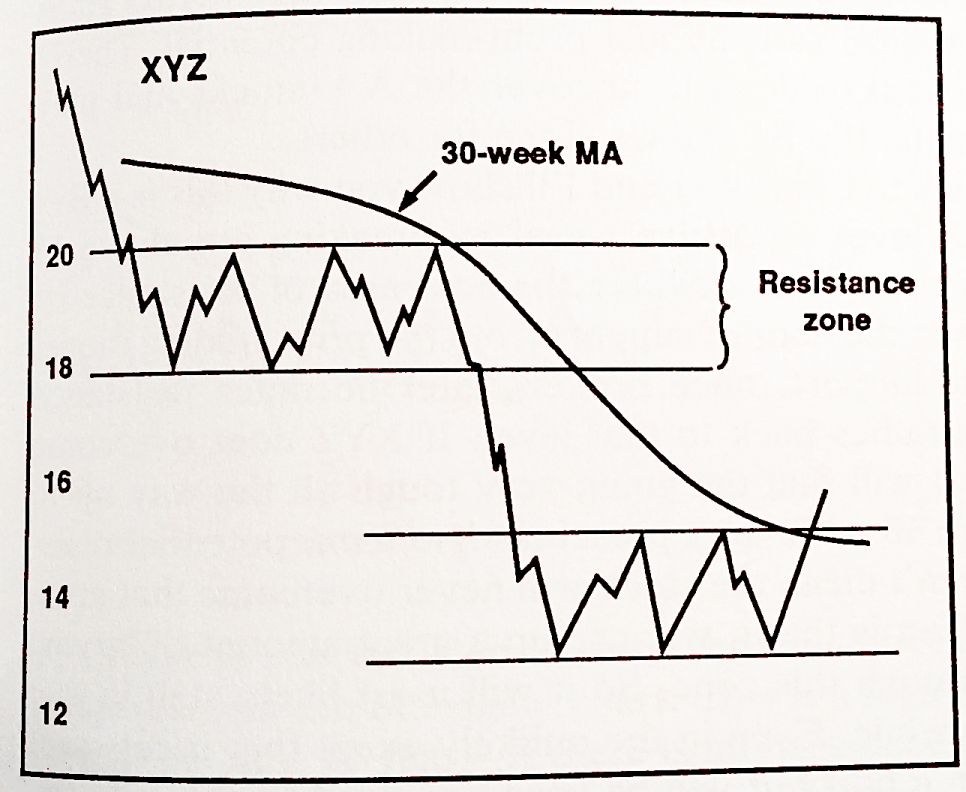
The first concept is the less resistance, the better.
- In the chart above, XYZ trades at 18 to 20 before declining to a range of 13 to 15.
- Then it breaks out above 15.
According to Stan’s system, this is a weak buy at best.
- It’s not a strong buy because there is resistance at 18 (and all the way up to 20).
- There is a lot of overhead supply.
Although most stocks building from a base will have overhead resistance at some point in their past, the further back the better.
- A couple of years is good, but 10 years is even better.
Volume
For Stan,
Volume is a gauge of how powerful the buyers are.
Never trust a breakout that isn’t accompanied by a significant increase in volume.
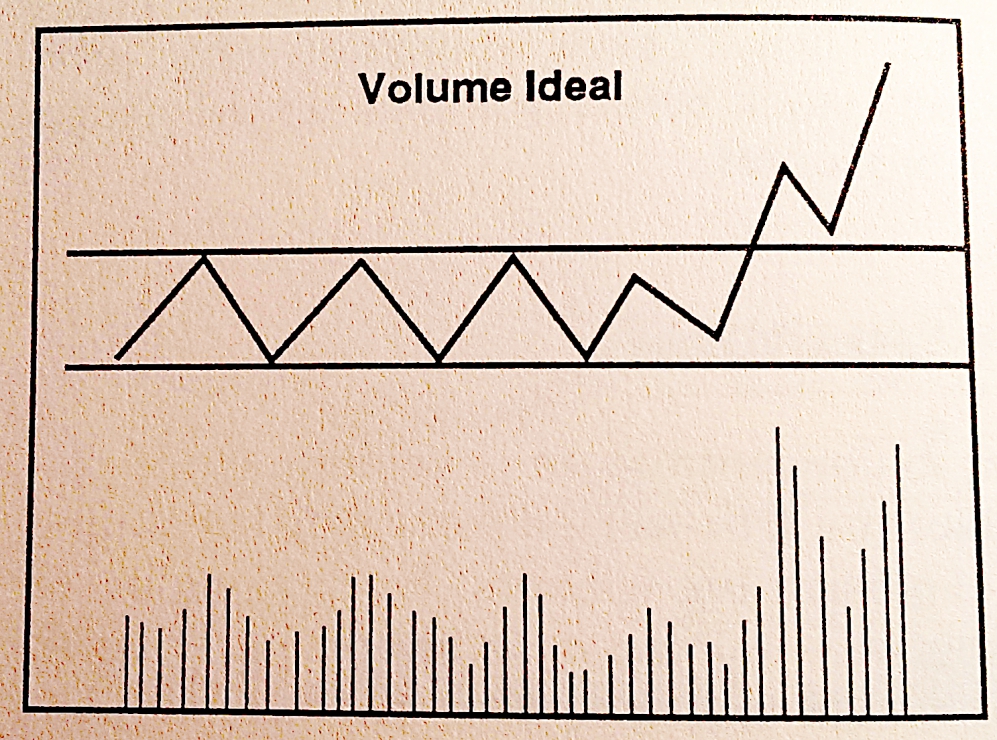
In the base area, the volume pattern is erratic.
- Some analysts look for an initial volume spike – the panic dumping of the stock – before the rise, followed by volume drying up.
- Stan says that many kinds of volume patterns in Stage 1 can lead to big winners.
But once the price goes through the 30-week MA, Stan looks for volume to pick up significantly.
- He wants to see a weekly volume spike that is at least twice the average for the previous month, or
- A three to four week buildup that is twice the previous average, followed by a further increase on the breakout week.
Relative strength
Stan’s third concept to help with buying is relative strength.
- This is the price of the stock relative to the market index.
- It’s nothing to do withe the RSI oscillator used in technical analysis.
A stock that is going up will have poor relative strength if the market is rising faster.
- And a stock that is going down can have positive relative strength if the market is declining more quickly.
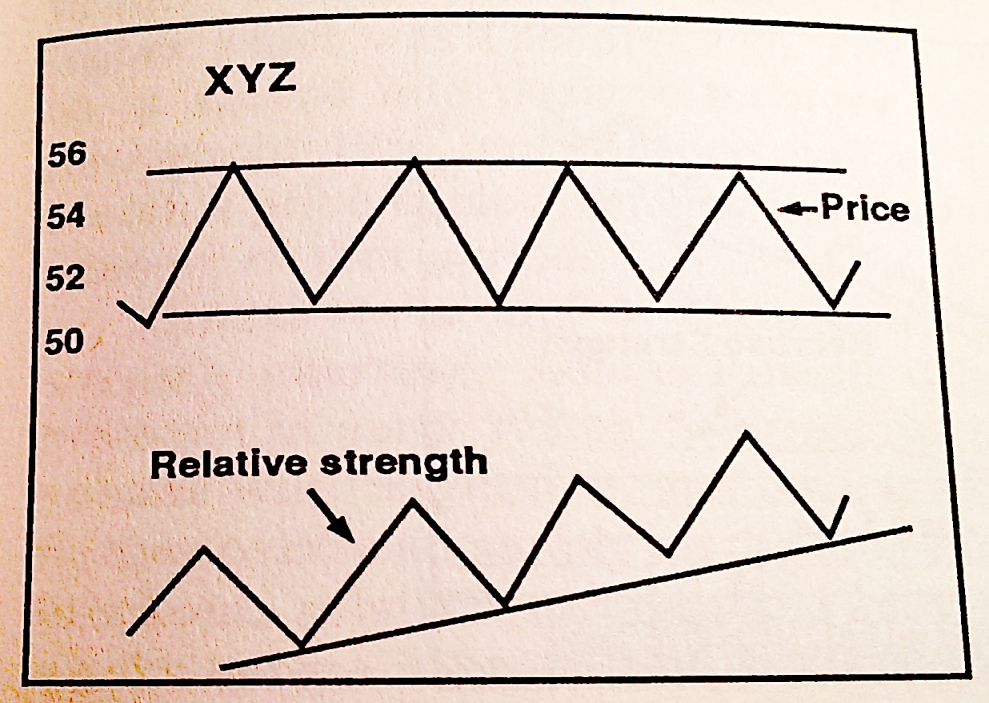
Stan finds the crossover from negative relative strength to positive particularly significant.
Head and shoulder bottom

Stan is not obsessed by chart patterns, but one that he does like is the head and shoulders bottom.
- Here there is an initial decline to a new low to form the first shoulder, followed by an oversold rally (point A).
- Then there is a smash that drives the stock to a new low (the head).
- Then the stock rallies to the same resistance level as point A (now point B).
- Next there is a decline which can’t make it to a new low, or indeed, even as far as the previous low (the right shoulder).
- And finally the real rally begins.
There should also be a trendline (moving average) that connects points A and B.
- This is known as the neckline.
- It’s important because when the price breaks up through the neckline is the best place to buy.
According to Stan, volume is not critical here, though many analysts prefer heavy volume on the left shoulder, less on the head and low volume on the right shoulder.
Double barrel (double bottom)

Another pattern that Stan likes is the double bottom, or as he calls it, the double-barrel.
- This works particularly well when supported by increasing volume, good relative strength and a lack of overhead resistance.
The key point is that the second wave of selling (to B) should not drive the price significantly below the first low (A).
Double bottoms form much more frequently than head and shoulders bottoms and you need to be sure that the breakout has begun before you buy.
Bigger is better
The bigger the base, the bigger the move.
Stan prefers breakouts from very large base formations.
- There can be excellent breakouts from short-term bases, but the odds are better with a large base.
In technical terms, a long base indicates a lot of sellers in Stage 1, which removes overhead resistance.
Diversification
Stan believes in diversification to an extent, but says that there is no single magic number for how many positions to hold.
One or two stocks is far too dangerous, and 40 to 50 stocks are far too many to keep track of.
For small portfolios (< $25K) he recommends no more than five or six stocks.
- For large portfolios (> $100K), 10 to 20 stocks are the most he would invest in at once.
He recommends equal dollar amounts in each stock.
- He also recommends that not all your stocks come from a single sector.
Takeovers
In the next section of the book, Stan talks about using his method of analysis to whittle down takeover rumours to those that have the best chance of coming true.
- This is all a bit speculative to me, and pushing the boundaries of chart analysis, but some people might want to try it.
He’s basically saying that insider trading will show up in the charts before the merger / takeover is announced.
- I think this is entirely possible, and I would be prepared to check the chart for evidence of this in a stock that I was already following.
- But I think I would soon tire of checking every market rumour I here.
- Stan was trading in the days before the internet and Twitter, and probably had fewer and more reliable rumours to deal with.
Triple confirmation pattern
Stan also talks about the triple confirmation pattern than he discovered in the 1970s.
- This pattern is used for longer-term trading than the techniques that we’ve covered so far.
- It’s designed to select stocks that are setting up for significant advances.

The three signals are:
- heavy volume – more than twice the underlying level, and for several weeks from the start of the breakout
- relative strength that begins as negative or close to zero, but breaks out decisively to the upside along with the price
- a big price move up (40%+) before the breakout signal – this implies a base pattern that has relatively wide swings up and down within the overall sideways trend
Conclusions
We’ll leave it there for today.
- We’ve now covered half of the book and remain on track to cover the whole book in four articles.
Over the past two articles, we’ve learned a number of rules on when to buy:
- Look for a positive trend in the overall market
- Look for the sectors that are doing the best.
- Look for stocks within those sectors that have bullish charts but are forming bases, and wait for them to break out from Stage 1 to Stage 2.
- This means that they must move above their 30-week MA, and the 30-week MA must not be declining.
- Bigger bases are better.
- Filter out those with nearby overhead resistance.
- Filter out those with poor negative strength.
- You might place a buy-stop order for half your normal size at the breakout price.
- If the breakout is confirmed by increased volume, buy the other half of your position, ideally on a pullback.
We’ve also covered some favourable chart patterns:
- Head and shoulders bottom
- Double bottom
I’ll be back in a few weeks time with the next section of the book, which is on when to sell and short selling.
Until next time.
Mike Rawson
Mike is the owner of 7 Circles, and a private investor living in London. He has been managing his own money for 40 years, with some success.


Just finished reading the Stan W book and found it fascinating. It could have been written in 1880! Talking about manual charts and getting the info from the library!!!
However did some googling on his name and your summaries here are fantastic. Thanks.
Saves me a job writing up my notes from reading the book!
Writing now in 2020, applying some of his points looks like we are entering a bear market, big time.
Thanks for the kind words, but you make me feel old. I learned with manual charts and went to the library every day to read the newspapers.
The big difference between then and now is the level of government intervention. The stock market doesn’t stand alone. Sam wouldn’t have predicted these interest rates.