Stan Weinstein’s Stage System 3 – Selling and Shorting

Today’s post is our third visit to the book “Secrets for Profiting in Bull and Bear Markets.” Today we’ll be looking at when to sell and how to short.
Contents
When to Sell

Last time we looked at refining the buying process.
- In chapter six, Stan looks at when to sell.
He begins with a few examples of stocks that started out as winners but became disasters.
- Avon, Floating Point, Alfin and VM Software all made good advances at first, but then gave back all their gains and turned into losses.
Just as bad as hanging on too long is selling a winner too soon.
- Many people believe that you can’t go broke taking a profit.
- But you can.
Most traders have as many losing trades as they have winners, if not more.
- So it’s vital to have big winners that can pay for your (small) losers.
Yet lots of traders sell simply because they feel that the stock price has become too high.
Don’ts for selling
Before describing when to sell, Stan looks at reasons that shouldn’t be used for selling (or not selling).
- Don’t time your sale around tax considerations
- This is less likely to be a driver for a sale here in the UK, because most people will hold their stocks in tax-sheltered accounts (ISAs and SIPPs).
- If you were operating a taxable account and needed to crystallise gains in order to use your annual capital gains tax (CGT) allowance, you would need to wait for 30 days before buying back the shares.
- This is better than the alternative that Stan is principally worried about, where an investor holds on to a large position in a stock because they don’t want to pay tax on their gains.
- When in this situation, at the very least sell enough shares to use up the CGT allowance.
- You could also sell more and also sell some stocks that are showing losses, in order to offset your further gains.
- Don’t hold on to a stock (that is heading into Stage 4) because it has a good yield
- A significant drop in price will cancel out several years worth of dividends
- High-yielders like utilities make good Stage 2 stocks because the gains are supplemented by the yield.
- Don’t hold on to a stock because its PE ratio is low
- This is admittedly unlikely after a good Stage 2 run, but can happen if the base level was low enough.
- Don’t sell a stock just because the PE ratio is high
- High PEs can get much higher
- Don’t refuse to sell because the market trend is bullish.
- A rising tide will float most boats, but not all of them.
- Don’t wait for the next rally to sell
- Don’t hold on to a stock because it is high quality
- Even quality stocks have price cycles.
Stan also reminds us that we should never average down.
Selling properly for investors
The first point Stan makes is that you should always have a stop loss in place.
- The is particularly the case with leveraged positions (eg. spread bets), but even with regular stocks, a mental note of the price you would sell at is a very good idea.
- Of course, using mental rather than actual stops means that you have to monitor your positions more closely.
Stan says that there is no magic percentage level for where the stop loss should be placed.
How can 10% or any other percentage be the right level? Does the market know or care what price you paid?
Instead, focus on the prior support level and the 30-week MA.
- If a stock was trading in a rage of 180 to 200, and you bought on a breakout above 200, then your stop would be just below 180.
- Stan also likes to place sell stops just below round numbers, since dropping through these indicates real selling pressure.
Stan’s second point is about buying rather than selling:
- If you are trying to choose between several stocks to buy, work out where you would need to place your stop and translate this maximum downside into a percentage.
- The stock with the lowest downside percentage is the one you should buy.
You should avoid buying stocks where stop is more than 15% below your entry price.
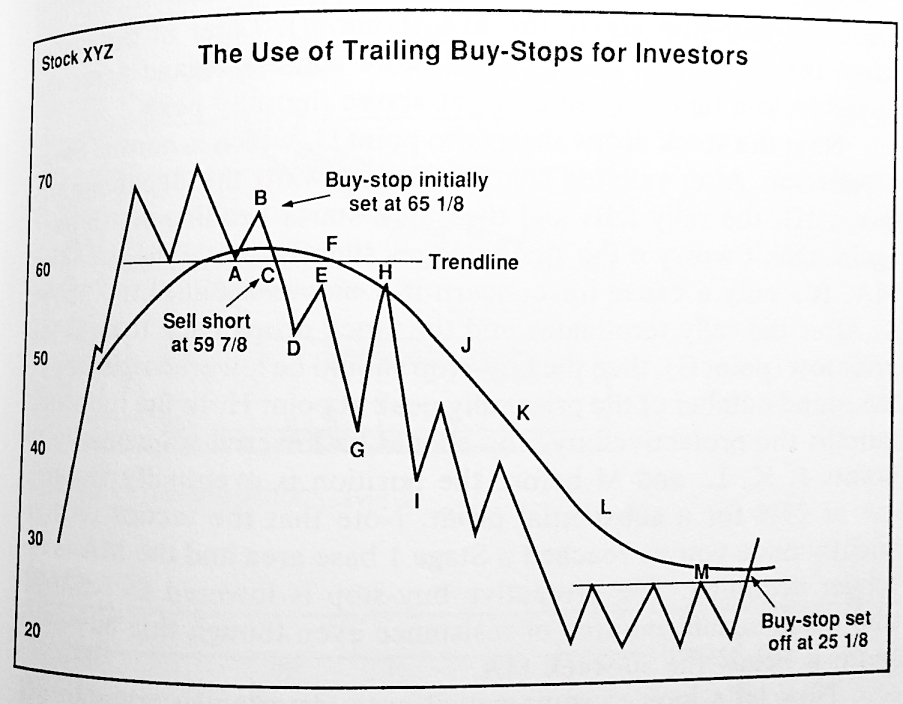
Trailing sell stops
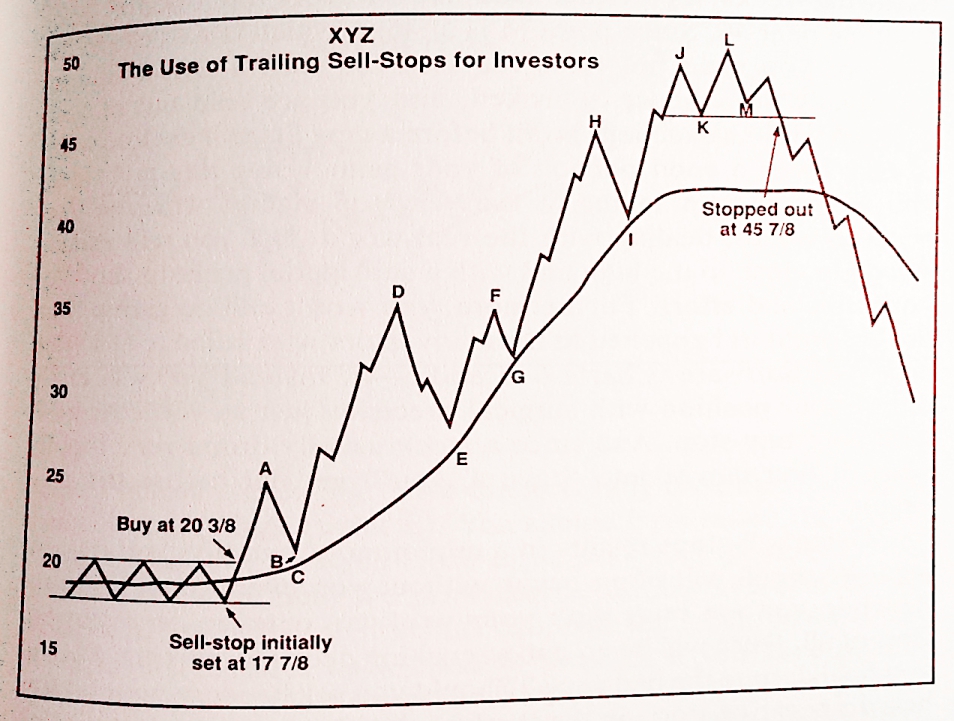
The diagram above shows how to correctly trail your stops for a winning share.
- The stock was trading in a range of 18¼ to 20¼ before a breakout
- You bought at 20½ with a stop at 17½ (below the round number of 18)
- The stock then rises to 25 (point A) before correcting back by 8% to 10% (point B)
You don’t move your stop up until the first correction to the positive trend has ended, and the correction has come close to the 30-week MA, but not violated it.
- Your stop moves up to just below the 30-week MA (point C).
The same process is repeated every time a correction to the positive trend comes close to the 30-wk MA, and the uptrend resumes (points E, G, I).
- In fact, Stan recommends that the raises at C, E, G and I are delayed until the stock has recovered most of the previous correction.
- So at points C, E, G and I you are waiting to raise the stop, assuming this recovery happens (which it does on each occasion, but some time later).
After point I, the MA flattens out.
- This is probably the start of Stage 3, and so you need to be more aggressive with your stop.
- The new stop is the correction low, at point K (which is above the MA).
After an initial correction to point M, which is above the stop, the next correction will stop you out.
- Soon after this the price falls through the MA, suggesting that in this case Stage 3 was brief and we are already into Stage 4.
Stop losses for traders
Stan says that traders need to be more aggressive with stops than investors.
- Investors want to stay with the stock for as long as it is in Stage 2, and will accept setbacks and sideways movement.
- Traders think that time is money, and want to avoid significant declines and sideways trading.
- They would rather shift to a new stock that is ready for an exciting move.
So a trader won’t wait for the stock to break down through the 30-week MA.
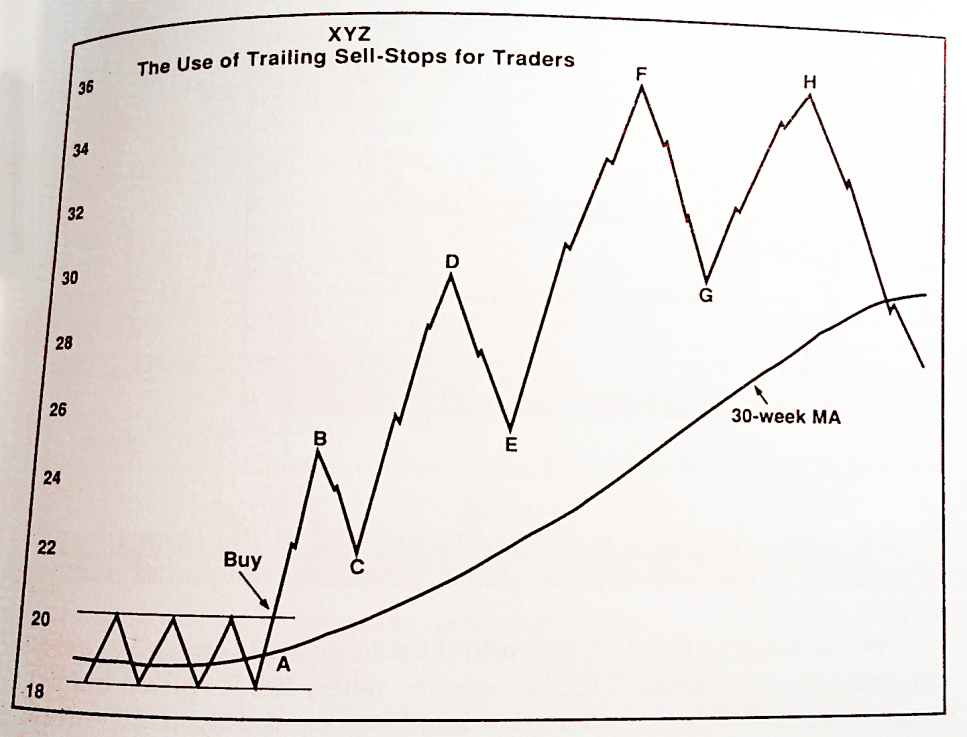
The chart above shows how this works.
- Once again, the stock was trading in a range of 18¼ to 20¼ before a breakout
Traders want a faster but smaller upside than investors, and so should only accept a smaller loss.
- So the stops should be just under the”closest prior reaction low”.
- I’m not entirely sure what this is – it could be the low before the breakout.
- Luckily Stan supplies a backup rule – a stop placed 4% to 6% below the breakout point (and below the nearest round number).
The stock then rallies to 25 (point B) and declines to 22 (point C).
- Stan says that traders should ignore corrections of less than 7%, but I make this a 12% decline.
Once the stock recovers up to the level of B, the stop should be moved up to just below C.
- Similarly, when the stock rallies to D, declines to E and then recovers back to D, the stop should be moved up to just below E.
- After the next rally-decline-recovery cycle, the stop would be just below G.
- After a double top at F and H, you would be stopped out just below G.
Stan adds that a trader should never stay in a position when the stock breaks below the 30-week MA.
Trendlines
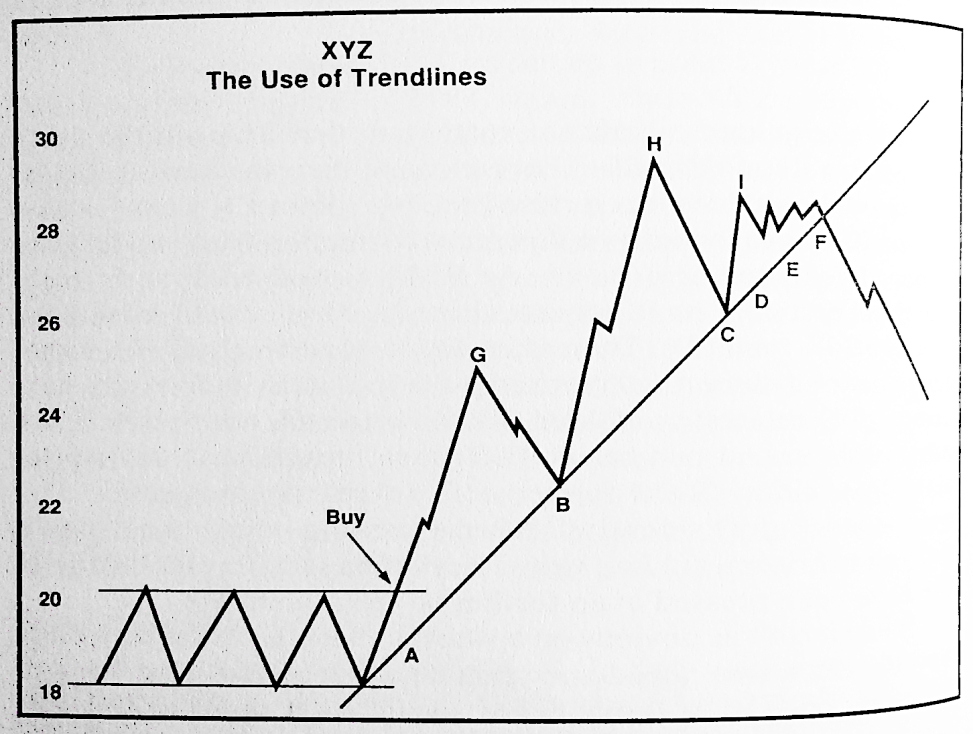
If a trendline forms, Stan says that you should use it.
- When the trendline is broken, sell at least some of your position (say half).
- The rest can be managed using the stops, and will probably be sold at a lower price.
A trendline is one that connects at least three lows.
- Once the third low forms and the price recovers (C in the diagram above), that becomes your stop.
- You can raise the stop to D, E and F as the price stays above the trendline.
- Note that the stop for this half of the position would be raised even though the price action beyond point I is sideways.
Eventually the stop at F is hit.
Swing rule
Stan says that most trading rules are not worth the effort.
- But one he likes is the swing rule.
This says that the target price is as far above the previous high as the previous low was below it.
- So if a stock falls from 260 to 160, its swing is 100.
- When it next breaks out of the range at 260, the price target is 260 + 100 = 360.
The top may be at 350 or 380, but you should be looking for a top to form in this area.
Selling short
Though the stock market is biased to the upside, it goes down for around one-third of the time, and the same is true for individual stocks.
Though shorting can be risky – a shorted stock can rise indefinitely, though this can easily be protected against with stops – stocks tend to fall faster than they rise, so there is the potential to make good money quickly.
Mistakes in shorting
Stan begins by listing a few rules on how not to short:
- Don’t short a stock because it has a high PE.
- Don’t short a stock because it has had a good run.
- Don’t short because the market cap is “too big”.
- Fundamentals like market share and growth prospects won’t stop the price rising temporarily.
- Don’t short a stock that everyone agrees must crash.
- Stan calls these stocks “sucker shorts”.
- Don’t ever short a stock that is above its 30-week MA.
- If the stock is still in Stage 2, don’t short it.
- Don’t short a stock with low volume
- Stan quotes weekly volume of 15,000 shares as the lower limit, but I’m not sure whether this should be lowered for the UK market.
- Covering a short in a thinly-traded stock will push up the price.
- Don’t short a stock in a sector that is moving upwards.
- Look for a weak stock in a weak sector.
- Don’t short a stock with good relative strength
- Compared to the market index (not the RSI oscillator)
- Don’t short without a protective stop.
Shorting done right
The first thing you need to look for is a stock that has had a good advance in the previous year.
- The Stage 2 rise should be relatively steep (fast), with little support or congestion along the way.
- It should now be in Stage 3 with a flat or even better, a declining MA.
- It should have traded sideways for a few weeks, so that a top is forming.
You should identify a level (at or below the MA) that will signal that Stage 4 has begun, and wait.
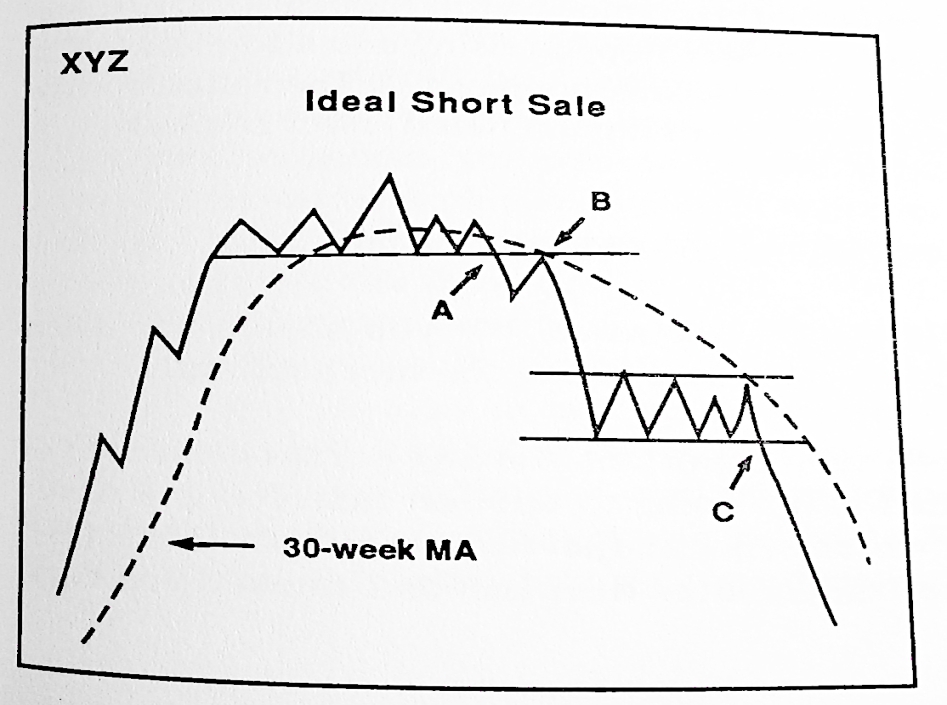
Potential entry points on the chart above include:
- A – the initial breakdown
- B – the pullback to the breakdown point
Stan says that all the principles from the buy side still hold on the short side – you just have to reverse the steps.
- With upside breakouts the risk is lower if you buy on the pullback – assuming that there is one.
- So the best approach for investors is to buy half a position on the breakout and half on the pullback.
- Traders are in a hurry and so would buy their full position on the breakout.
It’s just the same with shorting:
- Traders take the full short on the breakdown.
- Investors take half on the breakdown and half on the pullback.
More than half of breakdowns will show a pullback, but this is a lower proportion than for breakouts.
If you miss the initial breakdown, you can short well into Stage 4, but you need a consolidation pattern and a further breakdown.
- This is point C on the chart above.
Just as with long positions, Stan prefers the general market tone, and the trend within a stock’s sector to be bearish when placing a short.
- An outstandingly bearish pattern can be shorted in a bull market, but this should be the exception rather than the rule.
- When you do find one, it provides a welcome hedge against the many long positions you are likely to be holding.
One major difference between going long and shorting is volume.
- When going long, you want confirming large volume.
- This is not necessary on the short side.
Chart formations for shorts
Stan likes the head and shoulders top formation as an indicator for a potential short.
- This is the opposite of the head and shoulders bottom that he uses for long positions.

The formation begins with a strong advance on above-average volume (A, B).
- Next there is a profit-taking correction (B, C).
- And then a new high (D), usually with less volume than the previous advance.
Then comes a second correction (D, E).
- E must be lower than B, which in a more positive situation should have provided support on the way down.
- E should be at roughly the same level as C, the previous low.
Thus ABC is the left shoulder, CDE is the head, and CE is a trendline (known as the neckline) between the two lows.
- At this point you must wait for the next rally to fade before a new high (F < D and ideally, F = B
- And also for the neckline to be broken by the next low (G).
- The pattern is confirmed in around two -thirds of cases – the rest go to new highs.
Volume should be lighter on the right shoulder (EFG).
- If the right shoulder has the heaviest volume, it is not to be trusted.
At G, you have the most negative chart pattern that can form.
- Sell any longs that show this formation.
- Think about going short.
Stan has one more rule of thumb:
- “The bigger (longer) the top, the bigger the drop.”
- Note how long the formation takes to form, and the gap between neckline and peak.
Swing rule on the downside
The swing rule that we met earlier on the long side also applies to the short side:
- The height of the sideways channel before the breakdown is the same amount of breakdown to expect.
So if a stock rises from 160 to 260 before its breakdown, its swing is 100.
- When it falls below 160, the price target is 160 – 100 = 60.
Stan recommends that you close half your position when the price is in the target area, and leave the remainder protected by a stop.
He also finds that the downside swing rule applies to indices as well as individual stocks.
Stops for shorting
Stops for shorting are largely the reverse of those on the buy side. The diagram above shows the plan for investors:
- When the initial breakdown occurs (the transition from sideways Stage 3 trading into downwards Stage 4), the initial stop will be at the previous high (the right shoulder if the formation develops, but in the diagram above, point B).
- Don’t move the stop down until there is an oversold rally of 8% (E), and the price moves back to the prior low (D).
- The new stop is just above the 30-week MA (F).
- Note that at point H the price breaches the MA (but doesn’t hit the stop).
- At this point in the cycle this is not a problem.
- When the price drops back to G (on it’s way to I), the stop will be moved down to H.
- J, K, L and M are the subsequent stops.
As on the buy side, traders will be more aggressive.
- Their stops will be just above the rally peaks, and usually under the MA.
- The initial stop is at the prior peak (B), or around 5% above the breakdown point (C).
As with the buy side, trendlines should be used if they form.
- When the trendline is broken, sell at least some of your position (say half).
- The rest can be managed using stops, and will probably be closed at a higher (less profitable) price.
Put options
Stan sometimes uses put options to play the downside.
- These are not offered directly to private investors by many UK brokers.
- But the risk profile can be mimicked using spread bets with guaranteed stops.
Conclusions
That’s it for today.
- We’re now three-quarters of the way through the book and on course to complete with one more article.
Today’s chapters were much meatier than I expected, but as with the rest of the book so far, Stan’s methodology is clear and unambiguous:
- We sell when the stage is over, whether it’s Stage 2 (up) or Stage 4 (down).
- We know this has happened when our stops are hit.
- Stops are set above the MA (investors) or at counter-trend reversals (traders) or on a trendline (if it forms).
- Shorts are just like longs in reverse
- We look for a runup (Stage 2) followed by sideways action (Stage 3).
- We want the weakest stocks in the weakest sector in a weak market.
- The head and shoulders top is the best chart pattern to look for.
- Put options are useful for playing the short side
- These are difficult to access for private investors in the UK, but can be mimicked via spread betting.
Until next time.
Mike Rawson
Mike is the owner of 7 Circles, and a private investor living in London. He has been managing his own money for 40 years, with some success.