Systematic Trading 4 – Volatility Targeting and Position Sizing
Today’s post is our fourth visit to Robert Carver’s book Systematic Trading.
Contents
Volatility targeting

Rob describes the overall risk level as the most important decision that the designer of a trading system has to make.
- Most retail traders lose money because their positions are too large for their account size.
You need to know two things:
- the expected returns from your system (and their volatility)
- your personal capacity to accept losses.
Rob uses a single volatility figure (standard deviation) to measure risk appetite.
- He calls this the volatility target.
- It can be expressed in cash or percentage terms, and over different time periods.
So you might talk about the daily cash volatility target (in £££), but Rob prefers the annual cash volatility target.
- This can be converted to a percentage by dividing it by your trading capital.
You annualise by multiplying by the square root of time.
- If we assume 256 trading days in a year (there are 252 in the UK, I think, including two half-days) then we have a multiplier of 16.
Losses
Rob provides a table showing what you can expect from a range of volatility targets.
- It assumes a $100K account trading a system with an SR of 0.5 (pretty good) and Gaussian normal returns with no skew.
I was immediately drawn to the 25% target – but of course, I don’t know what the trade-off is for that at the moment.
A negative skew (-2) strategy (carry or relative value?) leads to higher individual losses but lower cumulative ones.
- A positive skew (+1) strategy (trend following?) leads to lower individual losses but higher cumulative ones
Rob also has a table showing the chance of big losses after trading an SR 0.5 system with zero skew for ten years.
- After all this, I’m still liking the 25% volatility target.
Leverage
Without leverage, very high levels of portfolio volatility won’t be possible.
- Leverage is a problem though, especially with the negative skew strategies for which it is typically needed.
Rob talks about the removal of the Swiss Franc peg in 2015.
- The volatility of EUR/CHF before the peg was pulled was just 1% a year.
To get to a 50% target, you would need 50x leverage.
- Retail FX brokers offered 500 times in 2015, though I’m pretty sure that European legislation has now reduced that.
With 50x leverage, a 2% move wipes out your position.
- The move on the day the peg was removed was 16%.
Diversifying across many instruments can help to protect against this sort of incident.
- Rob prefers to exclude low volatility instruments rather than leverage them up “insanely”.
Kelly
The optimal size of bet is frequently calculated using the Kelly criterion.
- Rob prefers simply to say that your volatility target should match your SR.
A system with a typical SR of 0.25 should have a 25% volatility target.
The next table shows geometric returns (vertical) against the percentage volatility target.
- Regardless of skew, the optimal risk percentage is 50%.
Higher percentages (risk levels) are particularly bad with negative skew strategies.
With bigger SRs (not so easy to find), and therefore bigger volatility targets, you can expect larger returns.
- Rob warns against taking back-tested SRs of 2 and more at face value.
Rob’s system
Rob’s system uses 54 instruments, 8 basic rules and 30 variations.
- It has a back-tested SR of 1.0 after costs, but Rob won’t use a volatility target above 37%.
Even ideas-first testing is likely to result in some over-fitting, and Rob expects future returns, in general, to be lower than in the past (because of low interest rates and high valuations).
- Rob thinks that back-tested and hand-crafted strategies should have their potential SRs marked down by a quarter to a third, and suggests that an SR of 1.0 is the most that is achievable.
He also thinks that Kelly is too aggressive:
- A 50% Kelly target gives a 10% chance of losing half your money after 10 years.
So Rob uses Half-Kelly instead.
- His back-tested SR of 1.0 is marked down by a quarter to 0.75, and the Kelly target of 0.75 is replaced by a Half-Kelly target of 37%.
Rob’s system has zero skew.
- He recommends that you halve the risk again (quarter Kelly) for strategies with a negative skew.
Asset allocators (with a static trading strategy) should expect a maximum SR of 0.4, even for a well-diversified portfolio.
- So their volatility target is 20% – which will be difficult to achieve without leverage.
Semi-automatic traders will have SRs between 0.2 and 0.5, with a maximum volatility target of 25%.
- As before, these targets should be halved for systems with negative skew.
Implementation
Rob recommends starting with a small amount of capital, adding more as the system proves itself.
- Keep the percentage volatility target constant, and allow the cash volatility to increase until just before you become uncomfortable.
The same applies to cumulative profits and losses.
- They will affect the cash volatility, but the percentage volatility can remain constant.
- It’s also the same approach when cash is added to, or withdrawn from, the account.
Rob recommends adjusting your cash target every day, unless your volatility target is below 15%.
Capital per trade
Rob provides a table for converting traditional “capital at risk per trade” systems into implied percentage volatility targets.
- He assumes that the average bet is half the maximum (I think this is unlikely) and that an average of two positions is open at a time.
The third variable is the holding period.
Fast trading, and risking more than 2% per bet looks like a mug’s game.
- Two half-size bets of 2.5% held for six weeks give a volatility target of 10%.
Working the other way, six 2% bets (full-size) held for six weeks give a target volatility of 24%.
- That feels reasonable to me.
Position sizing
Rob uses a concept called the block value to look at the risk of holding an instrument.
For listed instruments (stocks, ETFs), a block is a single share.
- The block value is 1% of the price.
For things like spread bets, it’s not so simple.
- At £10 a point (say on the FTSE-100), the block value is 10 times 1% of the index value.
- So if the bet is placed at 7000, a 1% move is 70 points, and the block value is £700.
Commodity futures will be for a set quantity of the commodity.
- So for oil at $50, it might be a 1000-barrel contract.
- A 1% move is $0.5 per barrel, so the block value is $500.
Price volatility
Next we need to know what the average standard deviation of daily price movements is for each instrument.
- Rob calls this the price volatility.
Equities have a 1% daily volatility whereas German 2-year bonds have a daily volatility of 0.02%.
Rob has three ways of calculating price volatility:
- Look at the charts (I can’t recommend this).
- Use a lookback window of between 10 days and 100 days (Rob uses 25 days, a period which is popular in the industry).
- Use an exponentially-weighted moving average (Rob uses the EMA-36).
I have also used the Average True Range (ATR) indicator.
Rob reminds us that when price volatility is low, we will buy lots of units (instrument blocks).
- For low vol / negative skew assets this can lead to trouble.
- As before, Rob’s advice is to avoid very low volatility assets.
Note that any instruments priced in a foreign currency (usually dollars) will need their daily volatility value converted back in to pounds.
Position risk
Let’s say we have a portfolio of £1M, with a 25% annual volatility target.
- That’s £250K in cash terms (annually).
- To get a daily cash target we divide by sixteen – that’s £15,625.
Rob works out that a oil futures contract has a daily volatility value of £668.33 (converted back from dollars into pounds).
So if the entire portfolio was devoted to trading oil, we could hold 23.4 of these contracts.
- Rob calls this the volatility scalar for that instrument.
From forecast to position
Rob uses forecasts with a standardised long-run value of 10.
- When you are optimistic (forecast >10) you buy more blocks.
When pessimistic, buy fewer, or go short if the forecast is negative.
Portfolios
Rob is a big fan of diversification and recommends that you use as many subsystems and instruments as possible.
In the next chapter, Rob looks at putting together a three asset portfolio:
- S&P 500,
- NASDAQ, and
- A 20 year US Bond.
To do this, you create three subsystem positions.
- So we need to make a portfolio with individual instrument weights which sum to 100%.
Then the portfolio-weighted position is the sub-system position times the portfolio weight for that instrument.
All the subsystems are already volatility standardised (have the same expected standard deviation of returns).
- This means we can work out the subsystem weights via handcrafting.
The first step as always is to group together similar subsystems (those with high correlations to each other).
Note that technically we need subsystem correlations, not the correlations between the instruments on which the subsystems operate.
Rob says that trading subsystem correlations tend to be around 70% of those between the underlying instruments.
- So for instruments with correlation 0.5, the sub-system correlation would be 0.35.
This becomes important in the next section.
The handcrafted weights for the three asset portfolio would be 50% to the bond, and 25% each to the two equity indices.
Semi-automatic instrument weights
Semi-automatic traders hold a relatively small number of opportunistic positions (bets).
- The simplest approach is to allocate capital equally between bets.
Risk control works by limiting the number of bets that can be placed at any time.
Diversification multiplier
Diversification will reduce the overall risk of a portfolio.
- The lower the average correlation, the greater the reduction.
So we need a multiplier to get the risk back up to the expected level.
In the three asset system, the correlation between the bonds and the equities is 0.1, and that between the two equity indices is 0.75.
- Multiplying by 70% reduces these to 0.07 and 0.53 respectively.
So the average correlation (of 0.07, 0.07 and 0.53) is close to 0.25.
- From the earlier table of diversification multipliers, with three assets this gives a multiplier of 1.41.
Rob recommends capping the multiplier at 2.5.
For semi-automatic traders, the multiplier is the maximum number of bets divided by the average number.
- For example 6/5 = 1.2
Three asset portfolio
This section will be hard to follow without all of the charts and tables from the book.
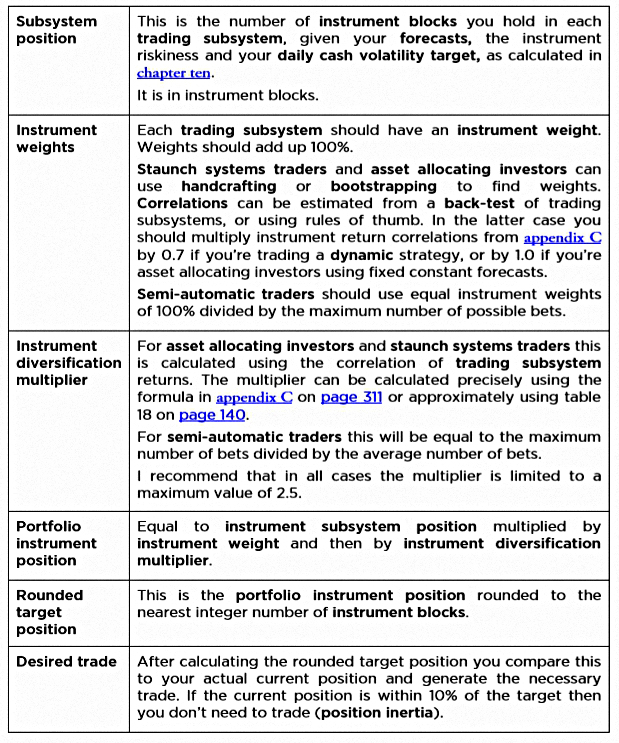
In the final part of the chapter, Rob runs through the steps for the three asset portfolio.
- He assumes an annual cash volatility target of €100K – somewhat smaller than we used earlier.
- This is a daily cash volatility target of €6,250.
The first chart shows the volatility of the three instruments.
- The second shows the positions for the three subsystems (assuming the entire capital was used for each subsystem).
The third table includes the instrument weights and the diversification multiplier to work out the real instrument positions.
- The fourth table converts this to trades (building from existing imaginary positions).
Rob uses a think called position inertia:
- If an existing position is within 10% of the target position, don’t trade.
This should significantly reduce trading costs without significantly impacting performance (returns).
Here’s Rob’s table summarising the process:
Conclusions
It’s been quite complicated today – there are a lot of steps to get from volatility targets to the trades that you should make.
The good news is that we are quite close to the end of the book:
- Next up is “Speed (of trading) and Size” (of portfolio).
The final section of the book ties the whole process together for Rob’s three kinds of investor.
- Until next time.
Mike Rawson
Mike is the owner of 7 Circles, and a private investor living in London. He has been managing his own money for 40 years, with some success.