The Balance Sheet – Fundamental Analysis 2

Today we’re going to look at the Balance Sheet, and what it can tell us about a company.
Contents
The Balance Sheet
The balance sheet is all about telling you whether a company is financially healthy.
People talk about strong balance sheets – with lots of cash and little debt – or weak balance sheets (the opposite).
A company with a strong balance sheet is better placed to survive a severe but temporary downturn in its business.
If you’ve ever worked out your personal net worth, you know what a company balance sheet looks like:
Things you own - things you owe = net worth
Or:
Assets - liabilities = equity
- Assets are subdivided into tangible (physical) and intangible assets (trademarks and patents etc).
- Assets and liabilities are divided between short-term (< 1 yr, known as Current) and long-term (> 1 yr)
In a nutshell, the balance sheet shows what a company owns and what it owes.
- It shows the company’s financial position at a specific point in time – a particular day, most importantly the end of the company’s financial year.
- It’s a snapshot of something that changes every day as the company trades.
- This year’s balance sheet is last year’s balance sheet with the effects of this year’s income statement added on.
Listed companies publish a balance sheet twice a year – once in the annual accounts and once in the interim accounts.
They Balance
Balance sheets always balance, as their name suggests:
Assets - Liabilities = Net Assets = Shareholder's Funds (Equity)
Phil Oakley uses a simple example of someone (John) buying a house for £100K, using £40K of his £50K of cash and £60K of mortgage borrowed from a bank.
John’s balance sheet looks like this:
Fixed assets (House) = £100,000
Current assets (Cash) = £10,000
Total assets £110,000
---------------------
Liabilities (Mortgage) = (£60,000)
Net assets = £50,000
=====================
Share capital = £50,000
Retained profits = £0
Equity = £50,000
- The top half of the balance sheet adds up the assets (what he owns) and subtracts the liabilities (what he owes), to give the net assets.
- The bottom half shows how those net assets have been financed by the companies shareholders – how much is share capital and how much is retained profits from earlier years (zero in this case).
Each transaction that a company makes will affect the top and bottom of the balance sheet equally, so that it still balances.
John now spends £5K carrying out improvements that boost the value of the house by £5K:
Fixed assets (House) = £100,000 + £5,000 = £105,000
Current assets (Cash) = £10,000 - £5,000 = £5,000
Total assets £110,000
---------------------
Liabilities (Mortgage) = (£60,000)
Net assets = £50,000
=====================
Share capital = £50,000
Retained profits = £0
Shareholders funds (equity) = £50,000
After renting the house out for a year, John has made a profit of £5K (after tax and expenses).
- He retains this profit in the company rather than paying it out as a dividend.
Here’s the new balance sheet:
Fixed assets (House) = £105,000
Current assets (Cash) = £5,000 + £5,000 = £10,000
Total assets £115,000
---------------------
Liabilities (Mortgage) = (£60,000)
Net assets = £55,000
=====================
Share capital = £50,000
Retained profits = £5,000
Shareholders funds (equity) = £55,000
Example Balance Sheet
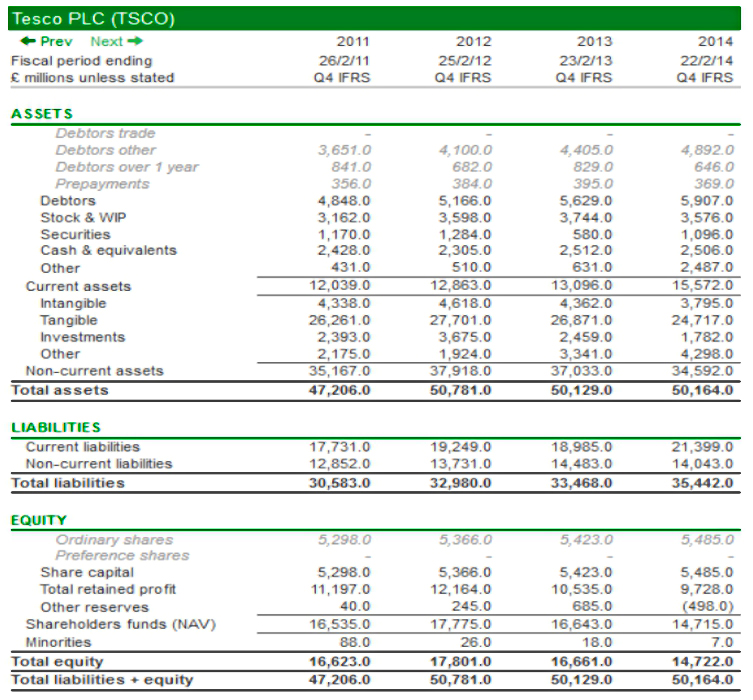
Below is the Tesco balance sheet from Phil Oakley’s SharePad article. For some reason, SharePad uses the US format for balance sheets:
Fixed Assets
Current Assets
--------------
Total Assets
Liabilities
Share Capital
Retained Profits
----------------
Equity
================
Equity + Liabilities (= Total Assets)
Re-basing
Some analysts like to re-state previous year’s financial statements as percentages of the current year’s numbers (ie. setting the current year to 100, and working out the numbers for earlier years.
- Others work from the other direction, setting the numbers from 5 or 10 years ago to 100, and working out what the numbers for later years would have been.
This can be useful for analysing trends, but the same effect can be gained by using graphs, or by comparing ratios (see below) across the years.
Balance Sheet Items
Now for the 2-minute accounting course. Let’s go through what all the items in the Balance Sheet mean.
First up are current assets, which are assets that are expected to be turned into cash within one year
- They include Stock (inventories) and work in progress (WIP), which can include raw materials).
- Debtors is money that is owed to the company.
- Sometimes trade debtors are separated out.
- This is money due from sales to customers on credit.
- Prepayments are money already paid out for things not yet received
- This might be for stock for example
- They are treated as if the company owns them (ie. they are an asset) even if not physically present or yet.
- Securities are investments, designed to produce a greater return than cash.
Non-current assets will be used in the business for longer than the next year.
- Intangible assets are things that you can’t physically touch
- They include intellectual property like patents and trademarks, plus brands and titles.
- They can be developed in-house or bought in.
- Intangibles includes Goodwill, which is the amount paid over net asset value when another company is purchased.
- Intangibles are a big factor in drug firms, software companies and consumer goods firms with lots of brands (like Tesco).
- Tangible assets are physical assets that you can touch.
- Land and buildings, Plant and machinery, Vehicles and Fixtures and fittings are the main categories.
- Asset values are listed after deducting depreciation / amortisation. The former term is usually used for tangible assets, and the latter for intangibles, but the concept is the same.
- Investments are a longer-term version of securities, but will also include any minority (< 50%) stakes in other companies or joint ventures.
Current liabilities are due within one year, and include Bank loans, tax and money owed to suppliers (Trade creditors)
- Accruals are goods and services that have been used but not yet paid for (the opposite of pre-payments).
Non-current liabilities are due after one year and include long-term debt, pension scheme deficits and provisions for events in the future (fines, deferred tax, compensation, plant decommissioning etc).
Equity is made up mainly from share capital and retained profits.
- There may be more than one kind of share, but ordinary shares are most common.
- Share premium is money raised above the face (par) value for a share.
- So if Tesco issued 5p shares at £2, then £1.95 per share would be added to the share premium account.
- Retained profits are profits from earlier years not paid out as dividends to shareholders.
Dilution
If a company issues too many shares, the claim on the companies profits of each share becomes smaller – it is diluted.
The reasons for issuing more shares include:
- buying another company using stock – when a company’s shares are highly valued, it makes sense for them to use them to fund acquisitions (there can also be tax advantages)
- stock options to executives – when exercised, these force the issue of new stock
- stock issues to reduce leverage (debt)
Of course, companies can also buy-back shares, especially when executive bonuses are linked to earnings-per-share numbers.
- this can be a good idea if the company’s shares are truly under-valued, and the buy-backs are made from cash
So analysts like to keep track of the number of shares in issue. Another approach is to make key calculations on a “per-share” basis.
Analysing the balance sheet
Balance sheet analysis, like the analysis of the other corporate financial statements, is done largely through the use of ratios which compare two or more numbers from the statement.
Obviously, ratios need to be interpreted in the context of the company’s history and trends, the sector it belongs to, and the wider market, but these numbers are the starting point for our evaluation.
- We’re looking for big changes in the ratios from one year to the next, or big differences in the ratios compared to their key competitors.
- We also want to know whether the trend over say five years is upwards, downwards or flat.
It’s also important to remember that the balance sheet is a snapshot on a particular day. For some companies and some industries more than others, things can change quickly.
- The more out-of-date your data, the more careful you need to be in its interpretation.
There’s also the risk that the companies accounts have been “tidied up” to look their best on a particular date. Perhaps earnings or profits have been flattered, or cash levels are unusually high. Certainly companies will want to report after their best trading period of the year.
The key here is that it’s difficult to flatter all the numbers at the same time. A careful consideration of all the numbers at the same time should enable you to work out whether they can be trusted.
In a later article we’ll look at where you can source these ratios, to save you the time and trouble of calculating them yourselves from the accounts.
We’ll also put together a spreadsheet which will automatically calculate the key ratios from the minimum input information.
But for today, we’ll concentrate on what the key ratios are, how they are calculated, and what they could mean.
Types of ratios
We can split ratios into three groups:
- Liquidity ratios, which analyse the ability of a company to pay its liabilities when they fall due
- Gearing ratios, which look at the level of borrowings compared to shareholders equity, or to total capital
- Asset calculations, which look at asset values and capital levels
Liquidity
Liquid just means “close to cash”. A company with low liquidity could be profitable and have a lot of capital, but have limited access to it in the short-term.
- It’s like a pensioner waiting for the next pension payment to pay the gas bill, even though their house is worth £1M.
So liquidity ratios are designed to spot companies that might find it difficult to pay their bills.
Now let’s look at some of the ratios. Take a deep breath – there’s a lot to get through and it’s all a bit dry.
Current ratio
This compares a company’s current assets (assets that can be turned into cash within one year) to its current liabilities (payments that are due within one year).
Current ratio = Current Assets / Current Liabilities
Generally a current ratio below 1 means trouble ahead, and many analysts would like to see a value of 1.5 or more.
Things to note about the current ratio:
- it assumes stock can be turned into cash, which might not be possible – so a high stock level can be bad news
- it assumes that bank overdrafts need to be repaid within a year, which rarely happens
- it makes no distinction between one day from now and one year from now – so if you have extra information on timings, factor it in
Quick ratio (acid test)
The quick ratio solves the stock problem:
Quick ratio = (current assets - stock) / current liabilities
As before, a score below 1 usually means trouble.
Working capital
This is a variation on the current ratio using subtraction rather than division:
Working capital = Current assets - Current liabilities
Working capital is the money that a company needs to operate on a day-to-day basis. It’s difficult to interpret because some companies need more of it than others (to hold stock, or sell on credit).
But sometimes low or negative working capital can be a good thing.
- In the case of Tesco (above), negative working capital demonstrates its market power to get other companies to finance its day-to-day expenses.
Stock days (stock turnover)
This shows how quickly a company is selling its stock. There is no correct figure – it varies by industry.
- Some analysts use the raw percentage figure without converting it to days.
Stock days = (Stock / Cost of sales) x 365
Companies may use different definitions of cost of sales, or not even disclose it. Turnover can be used instead, though it can limit comparisons to competitors.
Another issue is that this ratio uses data from both the balance sheet (a single day snapshot) and the income statement (a year-long summary).
One variation on this kind of ratio is to use an average figure for the stock, by taking opening stock from the previous balance sheet and closing stock from the current balance sheet.
Debtor days
This tells you how quickly customers are paying their bills. Again, it will vary by industry depending on what proportion of sales are made on credit.
Debtor days = (trade debtors / Turnover) x 365
If trade debtors are not disclosed, total debtors can be used instead, with some limitations.
Creditor days
This tells you how long the company takes to pay its suppliers.
A large number tells you that the suppliers are financing the company’s business.
- Will the company have the power to maintain this arrangement into the future?
- If not, the company will have to borrow more to finance its working capital.
Creditor days = (trade creditors / cost of sales) x 365
Working capital cycle
This ratio looks at the speed of cash around the company, and is made up from three other ratios:
Working capital cycle = Stock days + (trade) debtor days - (trade) creditor days
A small (or even negative number) means that the company was able to sell its stock and collect its debtors by the time it had to pay its creditors.
So a small number is good for the company (and bad for its suppliers). A large figure means the company needs a lot of working capital.
Gearing
Gearing just means debt as a proportion of the company’s capital. Americans call this leverage.
The name comes from the effect of debt on profits (and losses) – it multiplies them, like a high gear in a car makes it travel faster for the same revs.
- The downside is that high gearing means more risk – if things go badly, highly geared companies will suffer first.
- The “ideal” amount of gearing will as usual vary by industry.
To understand how gearing works, think of buying a house with a mortgage. Let’s say the house cost £200K and you have a £100K mortgage.
- So your equity in the house is the other £100K. You have 50% gearing.
- If the house price goes up by 10% to £220K, you now have £120K of equity. Your equity has gone up by 20%, not 10%.
- If the house price falls by 10% to £180K, you now have £80K of equity. Your equity has gone down by 20%, not 10%.
So gearing just amplifies the effects, in either direction.
Many people start off with 95% mortgages, which means that even a 6% fall in value can put them into negative equity.
For companies, the other effect is that gearing is debt, which comes with an annual interest bill. So the long-term effects of profits are diminished by having to pay this bill first.
Whenever a company takes on more debt, it needs to be confident that it will make much more profit from that capital that the cost of servicing the debt.
This may all seem academic in these days of near-zero interest rates, but for many decades, the cost of capital was an important consideration
Assets to Equity
This looks at gearing from the other direction – the smaller the number, the more the business is financed by shareholder equity rather than debt. A small number here means low gearing.
- In the house example above, the total assets are the £200K that the house is worth, and the equity is £100K. That’s a 2:1 ratio.
- With a 95% mortgage, assets are still £200K, but equity is only £10K. That’s a 20:1 ratio.
Assets to Equity = Total Assets / Equity
Gross gearing
This looks at borrowings versus shareholders’ equity. A high number means lots of gearing (and potentially lost of risk).
Gross gearing = Total borrowings / Equity
Some analysts prefer to remove intangible assets (goodwill, brands and patents) from the equity figure, as they might not be easy to sell if the company was to be wound up.
Net gearing
This is the most commonly used measure of gearing, and subtracts cash from the total borrowings to produce net borrowings.
Net gearing = Net borrowings / Equity
As previously discussed, most companies draw up their accounts at a time that shows them in the best possible light.
- This would include a lower than average gearing and higher than average cash.
Off-balance sheet debt
Another issue with gearing is off balance sheet debt.
When companies rent rather than own assets (for example shops), these don’t show up in the balance sheet, despite long-term commitments to rental agreements (debts). Thus gearing is understated.
- One approach to this is a ratio called the fixed charge cover, which is an income statement ratio.
- Steps are being taken to force companies to disclose long-term contracts on their balance sheets.
Debt maturities
Another way to analyse debt is to look at when it needs to be repaid (or in practice, re-financed).
The more time a company has to find / earn the money to repay its debts, the better.
Net asset value
Net asset value (NAV) is the company’s total assets less its total liabilities. It must also equal the total shareholders’ equity.
- It is usually calculated per share, to see what a company would be worth if it was liquidated.
- It has extra significance for asset-rich companies (property companies, house builders and financial companies).
NAV per share = NAV / Number of shares in issue
As with other asset calculations, some analysts prefer to exclude intangible assets, where the sale value is dubious. This is net tangible asset value (NTAV).
NTAV per share = (NAV less intangible assets) / Number of shares in issue
The closer the share price is to the NTAV, the cheaper the share (all things being equal).
Capital Employed
This is the amount of money invested in the company. It is used as the basis of “return on capital” calculations, particularly – return on capital employed (ROCE).
We will come back to this ration when we look at analysing company returns.
Calculating capital employed is not straightforward. Here is how SharePad calculates the number for Tesco from the balance sheet above:
Total Assets 50,164
  less cash (2,506)
  less securities (1,096)
  less current liabilities (21,399)
  add back short-term borrowings in current liabilities 1,910
  Total Capital Employed 27,073
- From the asset side, capital employed is total assets less current liabilities, cash and securities.
- Short-term borrowings are financing the assets and need to be added back.
Total Equity 14,722
 Non-current liabilities 14,043
 Short-term borrowings 1,910
 less cash (2,506)
 less securities (1,096)
 Total Capital Employed 27,073
- From the financing side, it’s the opposite process.
- They take total equity, then add non-current liabilities (debts, pension fund deficits, provisions) and short-term borrowings
- and take away cash and securities.
Some analysts will also exclude cash from both calculations.
I think the financing version is easier to follow, as the logic is clear – it’s equity plus debt minus cash.
Conclusions
We’ve covered a lot today, and it’s unreasonable to expect everything to go in at once.
- When we’ve been over the basic theory of fundamental analysis, we’ll loop back to look at some examples of company analysis, from different industry sectors.
So to summarise:
- A balance sheet is a snapshot of a company’s financial position
- it shows what a company owns and what it owes, like a personal net worth statement
- A company with a strong balance sheet (high cash, low debts) is better placed to survive a temporary downturn
- Balance sheets always balance: Assets – Liabilities = Equity
- Items are divided between short-term (Current, < 1 yr) and long-term (> 1 yr )
- Assets are divided into tangible (physical) and intangible (patents, trademarks and brands)
- Equity is Share Capital plus retained Profits from earlier years (not distributed as Dividends)
- We analyse the Balance Sheet using ratios
- We look for trends (up / down / flat), big changes from last year, and big differences with competitors
- The main calculations look at liquidity, gearing and asset values
Until next time.
Mike Rawson
Mike is the owner of 7 Circles, and a private investor living in London. He has been managing his own money for 40 years, with some success.