Man on Asset Drawdowns

Today’s post looks at a recent paper from Man Group on Drawdowns across asset classes.
Contents
Man Group
Man Group is one of the most well-known hedge fund groups and is listed on the UK stock exchange.
The paper we are looking at today is from their “The Road Ahead” series and was published in May 2026. Its full title is “Don’t Look Down: Reflections on Cross-Asset Drawdowns” and the author is Henry Neville.
The paper reports that drawdown (DD) profiles vary a lot across asset classes and that choosing the right pairings of assets can help with diversification.
Drawdowns
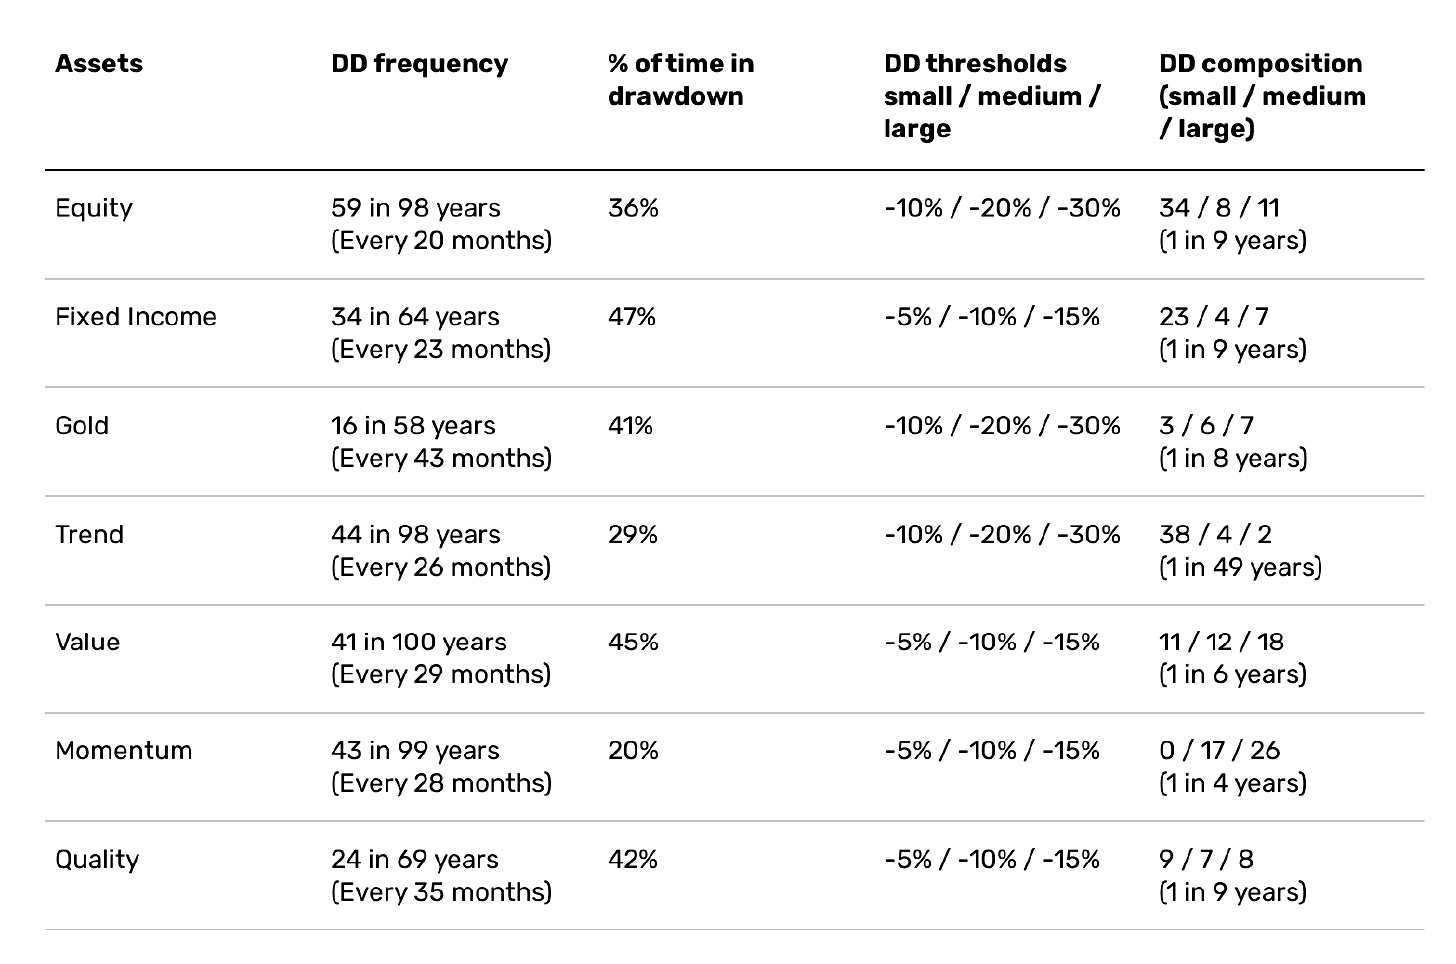
Henry defines a drawdown as a fall of 50% of the asset’s annual volatility (though the DD can occur over any length of time).
- A fall of twice that size is a medium DD, and three times makes it a large DD.
For stocks, this makes the thresholds 10%, 20% and 30%.
Henry provides data on seven “assets” / portfolio building blocks:
- Stocks
- Bonds
- Gold
- Trend
- Value
- Momentum and
- Quality
As well as the tables, Henry offers a diagrammatic profile of the typical drawdown for each asset.
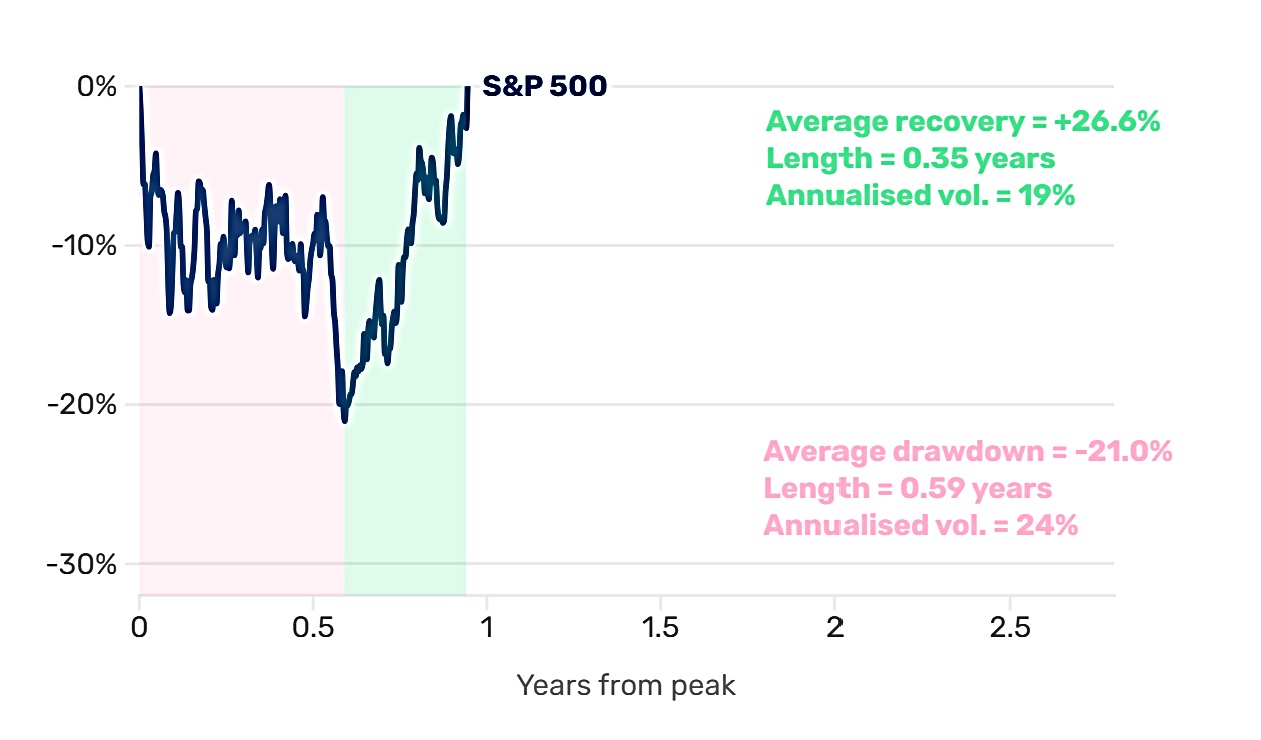
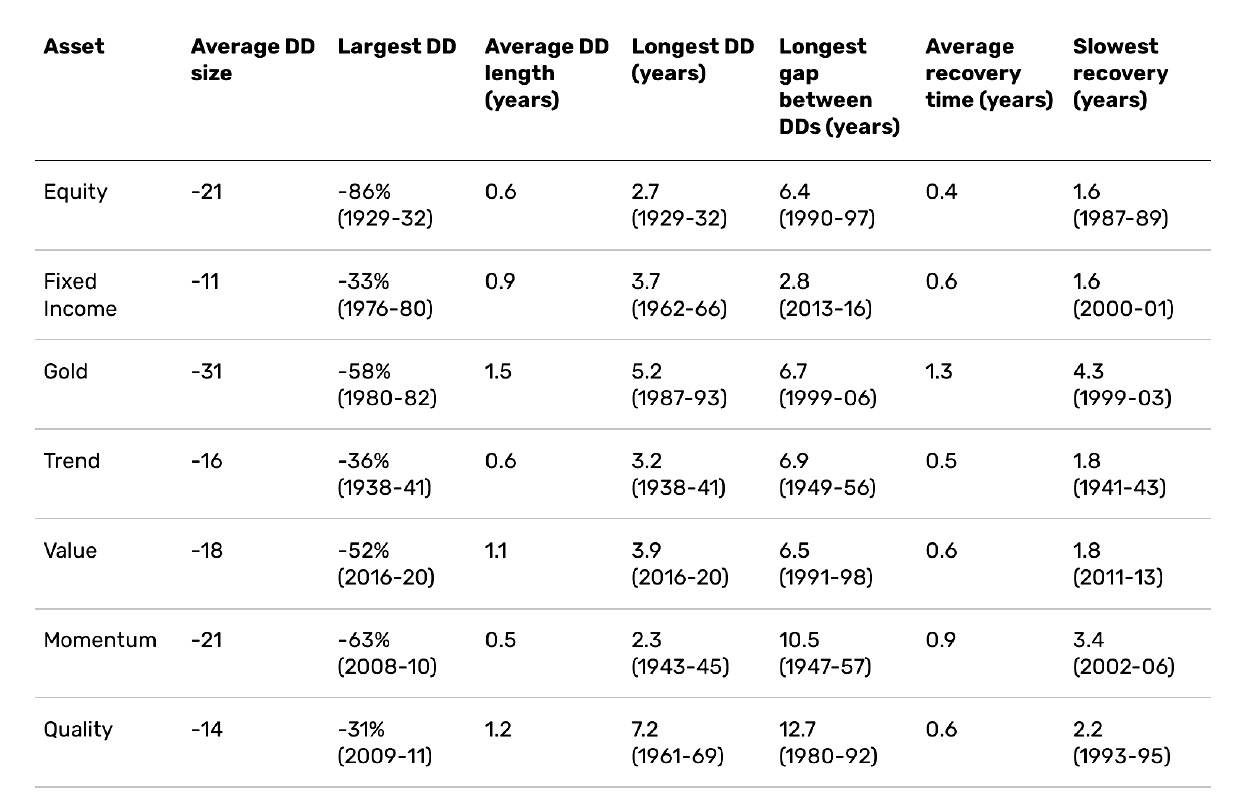
Equity drawdowns are relatively severe, but brief. They are unrivalled in terms of the speed of the recovery, at less than five months on average. Taking the fall and the bounce back as one combined event, their average episode is the shortest of all the assets.
They are also distinctive in the contrast between volatility in the drawdown, and outside of it. Stocks run at 15% volatility in normal times, but 24% in sell-offs. Investors should be particularly wary of false dawns during red zones.
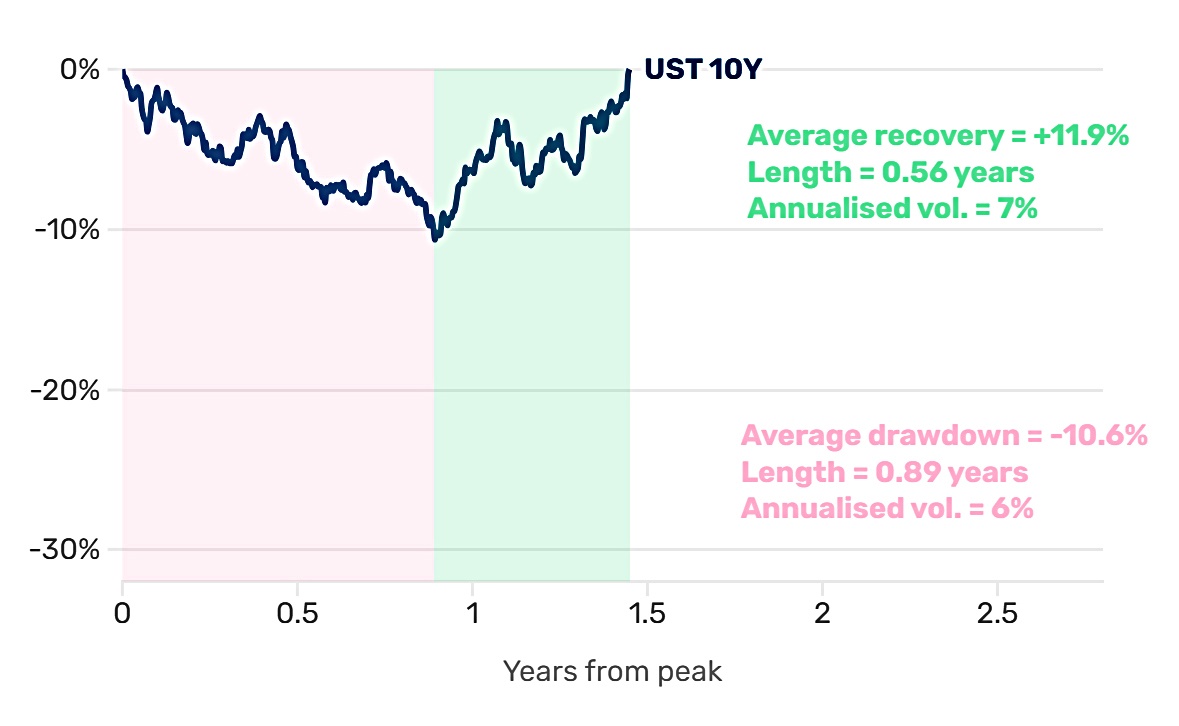
Bonds are in an episode almost half the time. These declines tend to be moderate, and not particularly volatile. This tallies with the market folklore that bonds grind lower and crash up. Monetary tightening tends to be well telegraphed (while loosenings often come by surprise).
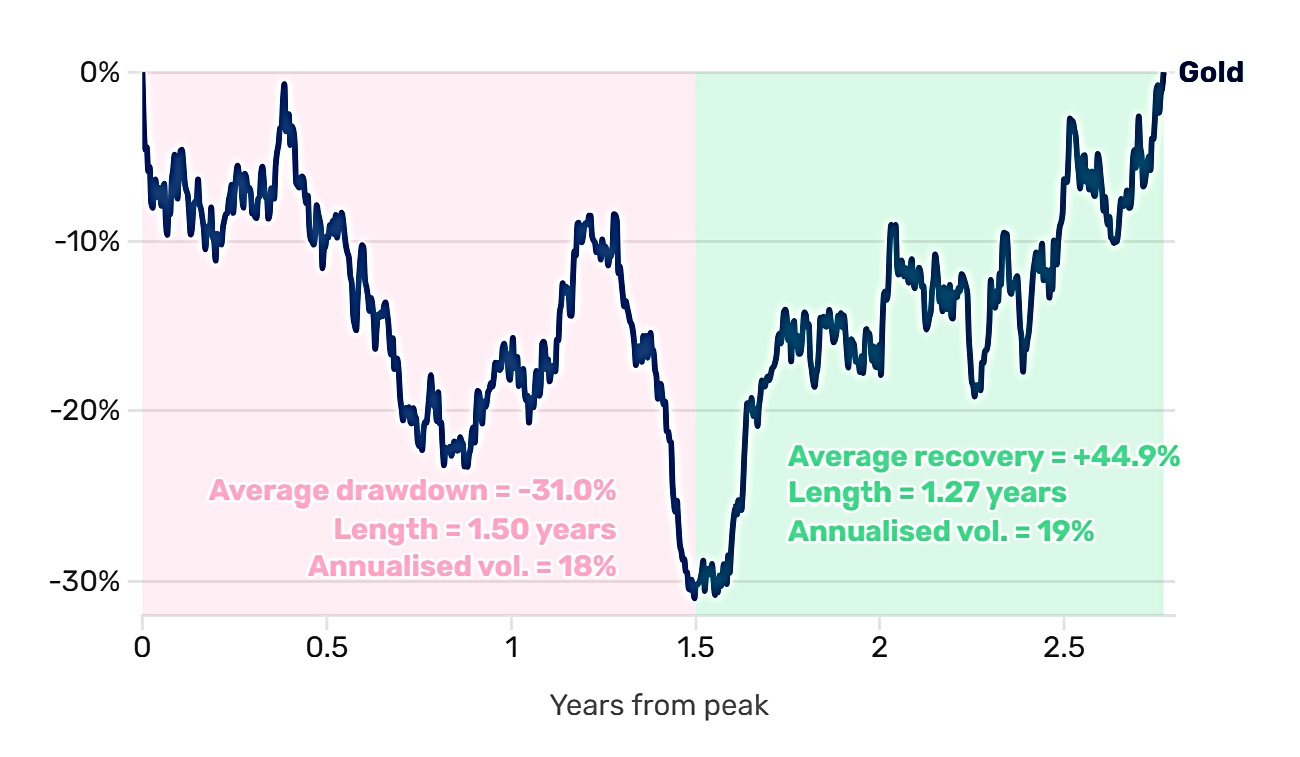
Gold drawdowns are both longer (1.5 years on average) and deeper (down almost a third) than other assets. Moreover, recovery time is significantly slower; a mean of 1.3 years is double any of the others, with the exception of Momentum (0.9).
The downdraft tends to be relatively orderly. The volatility of the yellow metal in the drawdown (18%) is actually lower than in normal times (20%). These characteristics make sense for an asset largely lacking in economic fundamentals, and therefore highly susceptible to real or perceived regimes, and narrative trading.
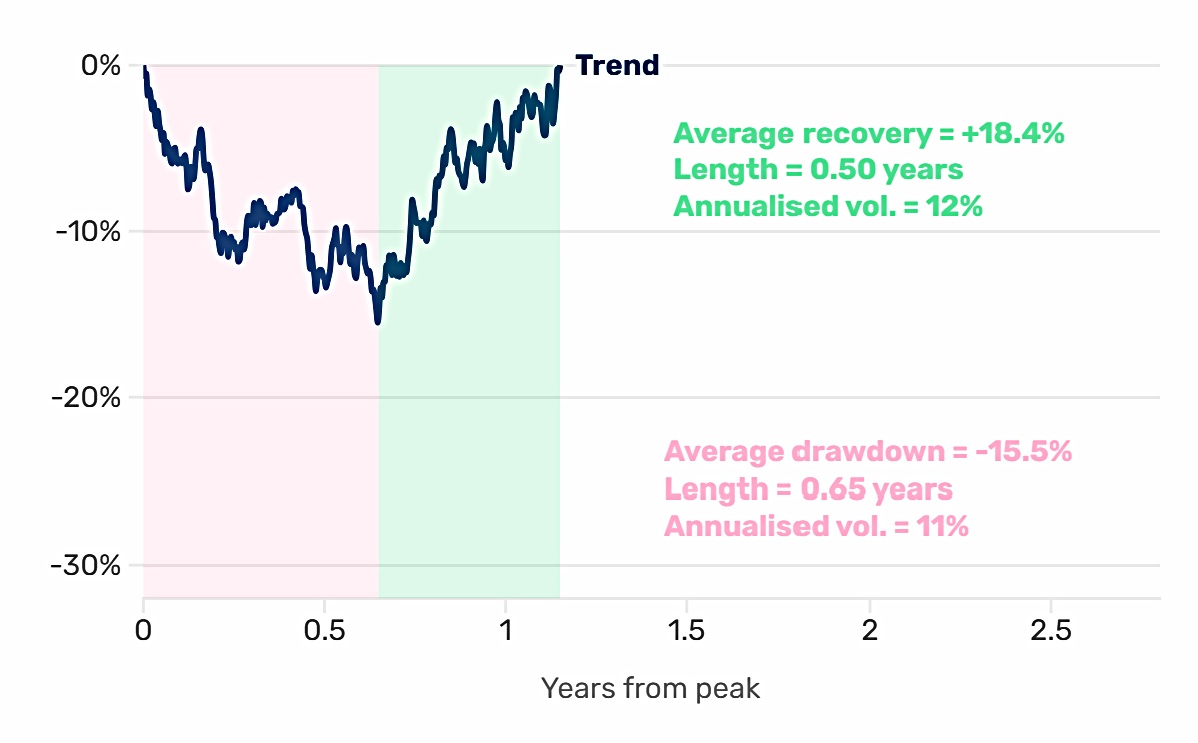
Trend drawdowns are heavily tilted toward smaller sell-offs – almost 90% [are] in the ‘small’ category. This likely speaks to the dynamic nature of the strategy: like Kipling’s leopard, it can change its spots as the environment Changes.
Its few large bear markets come around major regime inflection points. Volatility within down-moves tends to be less than that outside them. This is largely by design, given that vol. scaling is meant to reduce exposures as the market’s overall risk patina increases.
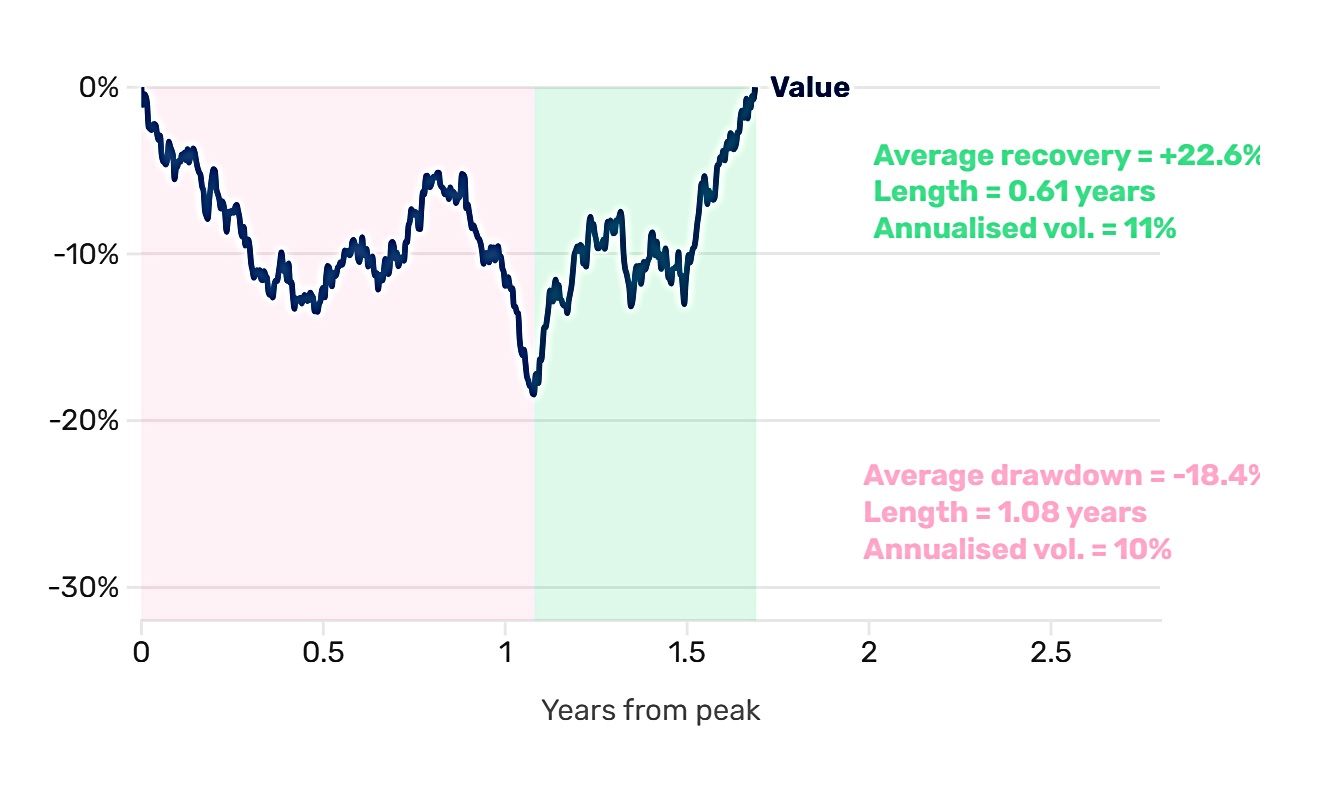
Like Fixed Income, Value tends to spend a lot of its time in drawdown, at 45%. Value-investing is a contrarian bet on intrinsic book value being recognised in market value, and with greater emphasis than long-term expected cash flows. Most of the time, being contrarian doesn’t work, even if the few times it does are spectacular.
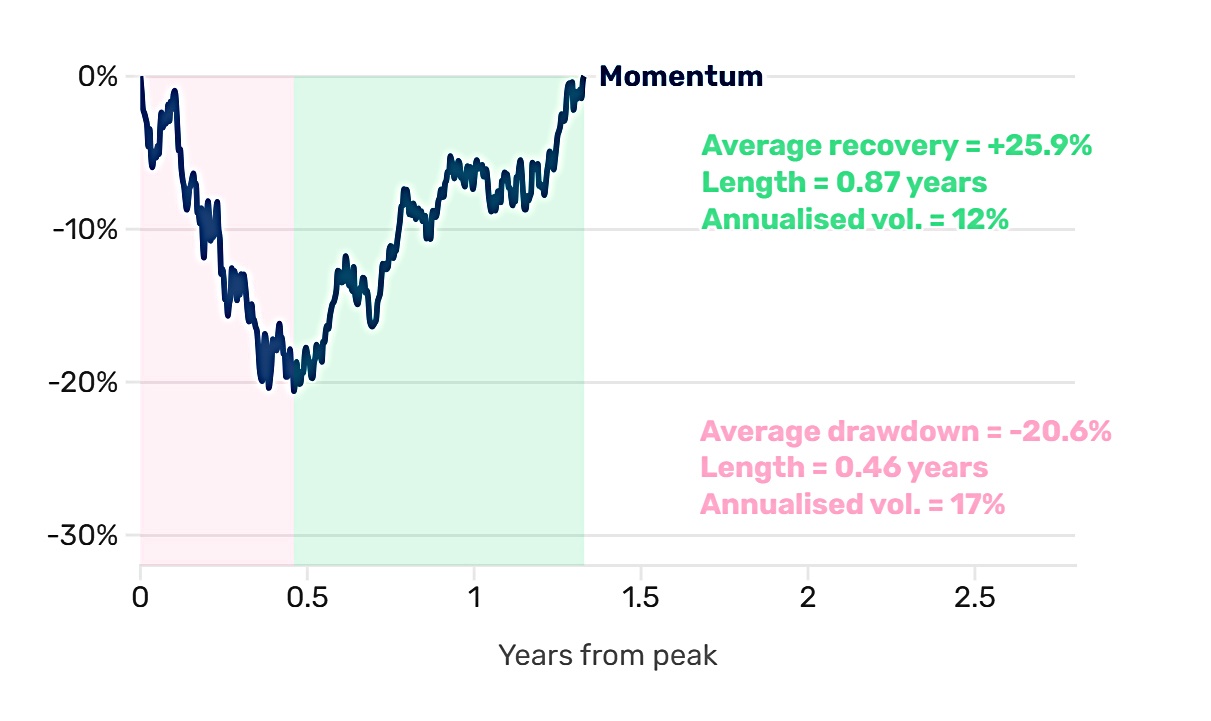
Momentum spends the least proportion of its time in drawdown (20%). Unlike Trend, its drawdown profile is skewed towards the larger nadirs (which represent 60% of the total). These tend to be extremely short and sharp, with the average length of six months – the quickest in our list.
The average magnitude is in line with stocks, and the biggest fall of 63% (the market pivot at the tail-end of the Global Financial Crisis [GFC]) was deeper than any, bar equity.
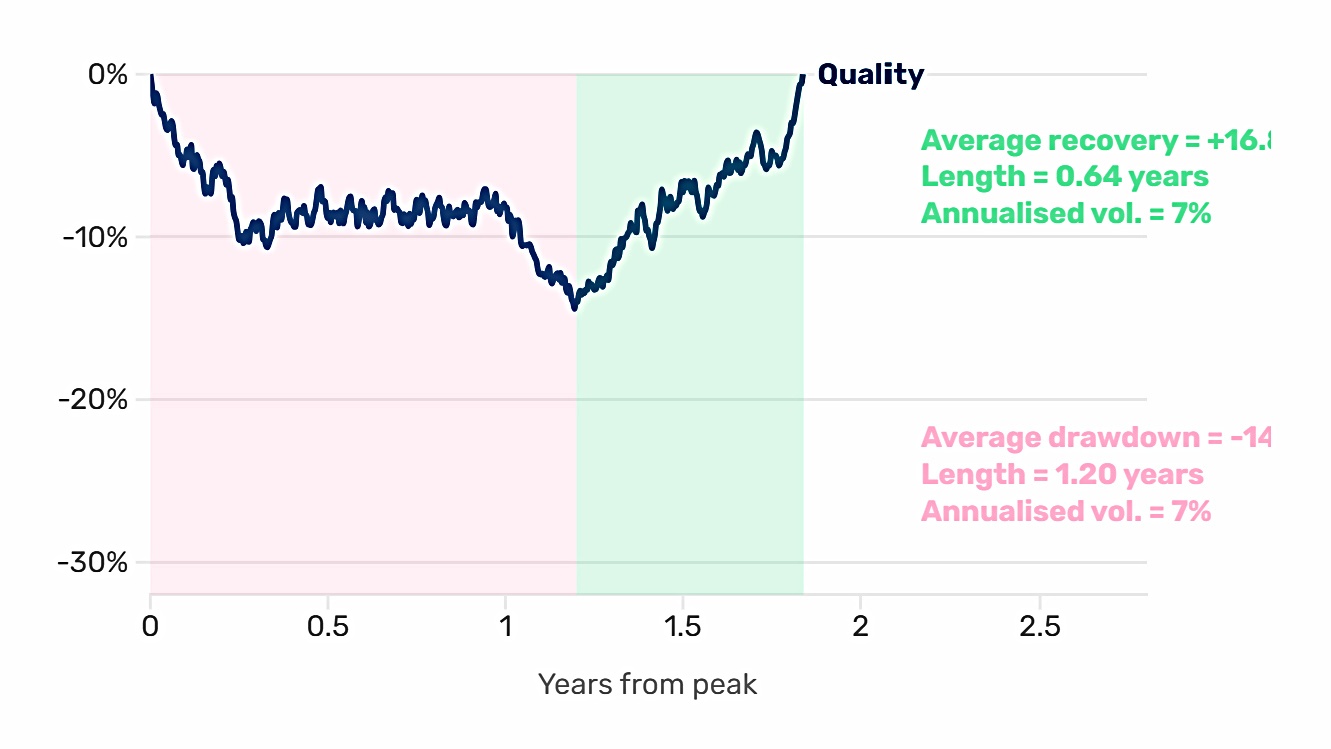
Quality has both the longest drawdown (the seven years in the 1960’s tech hype cycle prior to the Nifty Fifty boom) and the longest gap between drawdowns (over a decade, from 1980 to 1992). Its largest decline (the 31% fall through the post-GFC recovery) is smaller than any of the other maximums.
Interactions
First, Henry looks at the number of assets in drawdown at the same time:
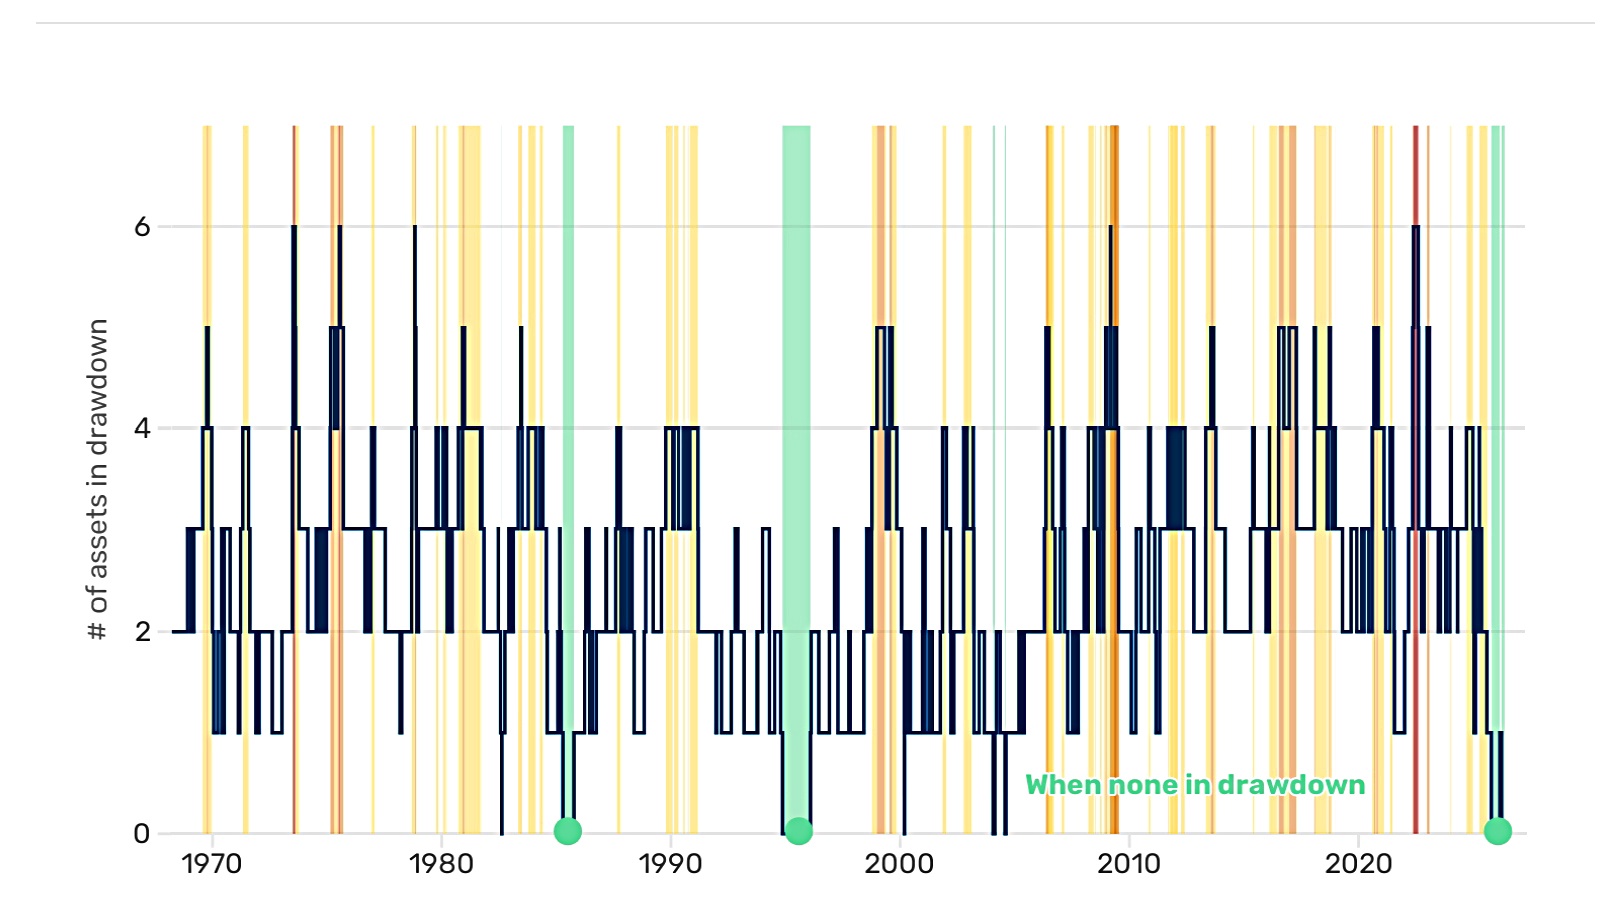
There has never been a time where all seven have been in the doldrums. The times where even six are there are vanishingly rare, at 0.6% of history. Worth noting that four of the five (three in the 1970s and one in 2022) come in the context of large inflation accelerations.
Times where nothing is in drawdown are little more than 4% of history. Only three times in any protracted sense: the mid-1980s (the vanquishing of inflation and Reagan’s ‘Morning in America’), the mid-1990s (the foothills of the DotCom boom) and now.
Next, he looks at correlations:
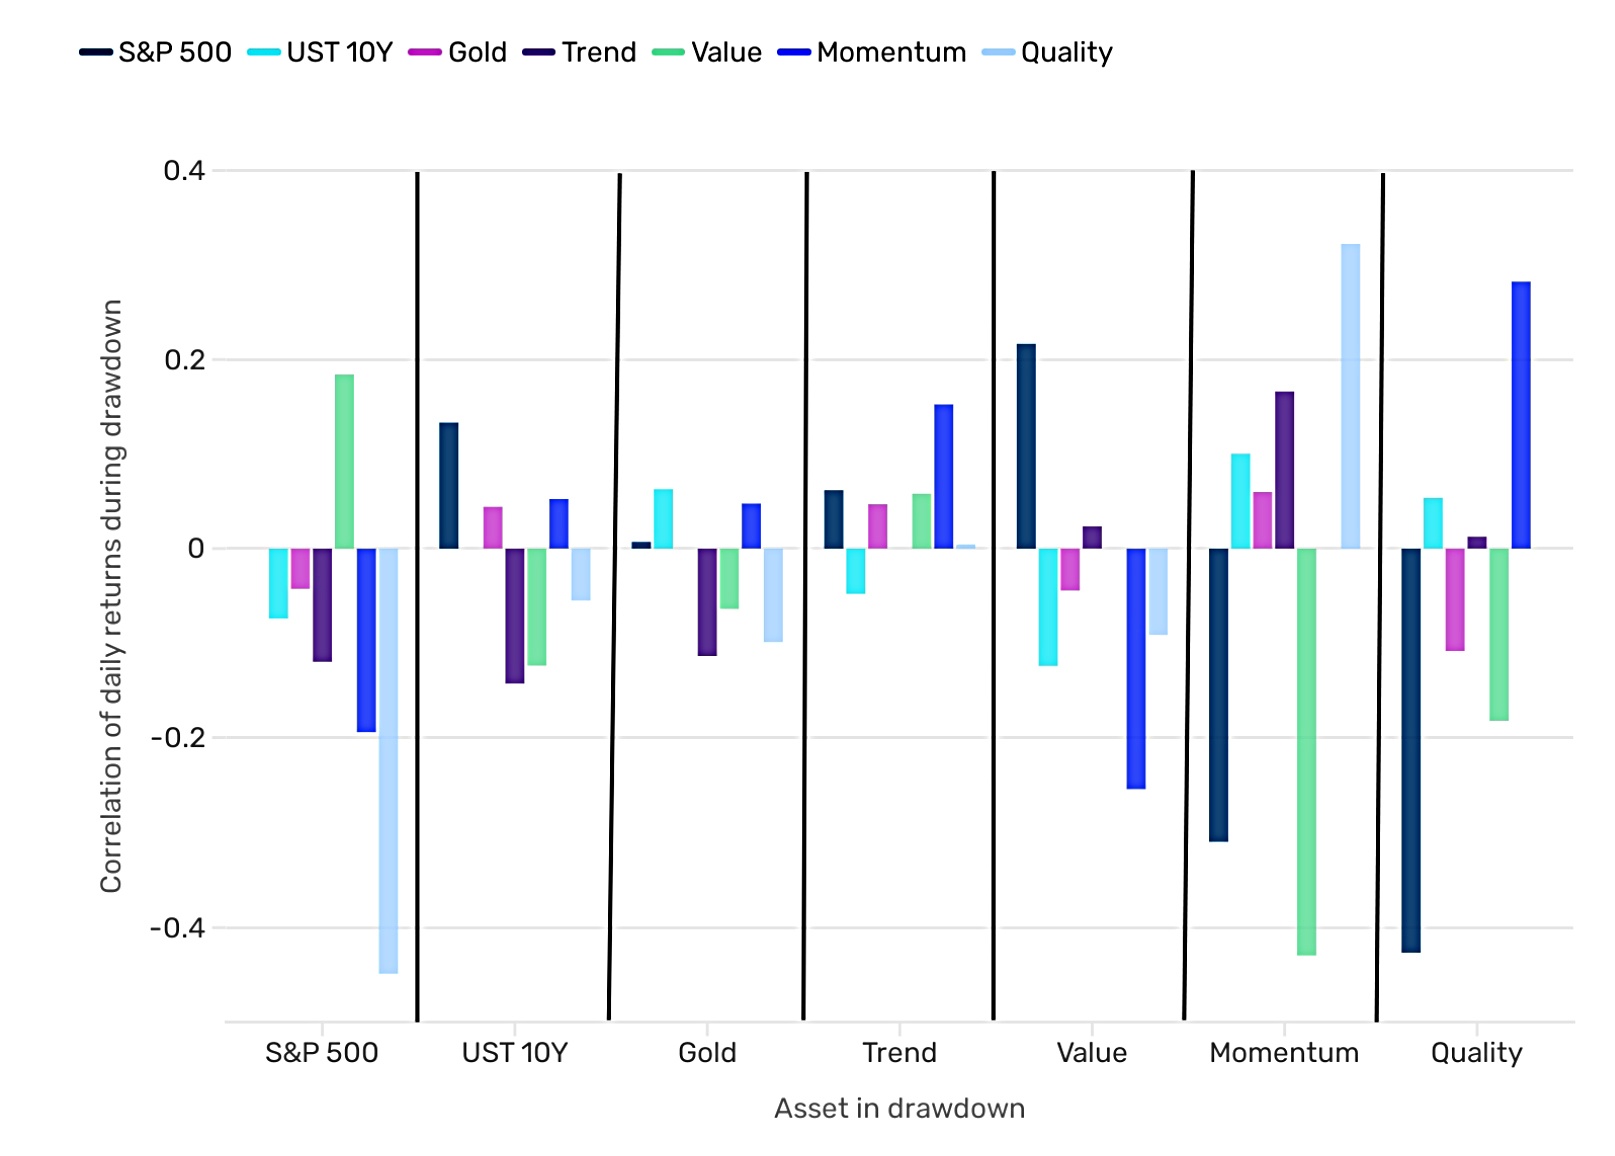
Henry discusses all of the extremes, but we’re really interested in what works when stocks are in trouble (since stocks are our foundation risk asset). In order of helpfulness:
- Quality
- Momentum
- Trend
- Bonds
- Gold
Value is the only “asset” that makes things worse.
Finally, he looks at combinations of three assets:
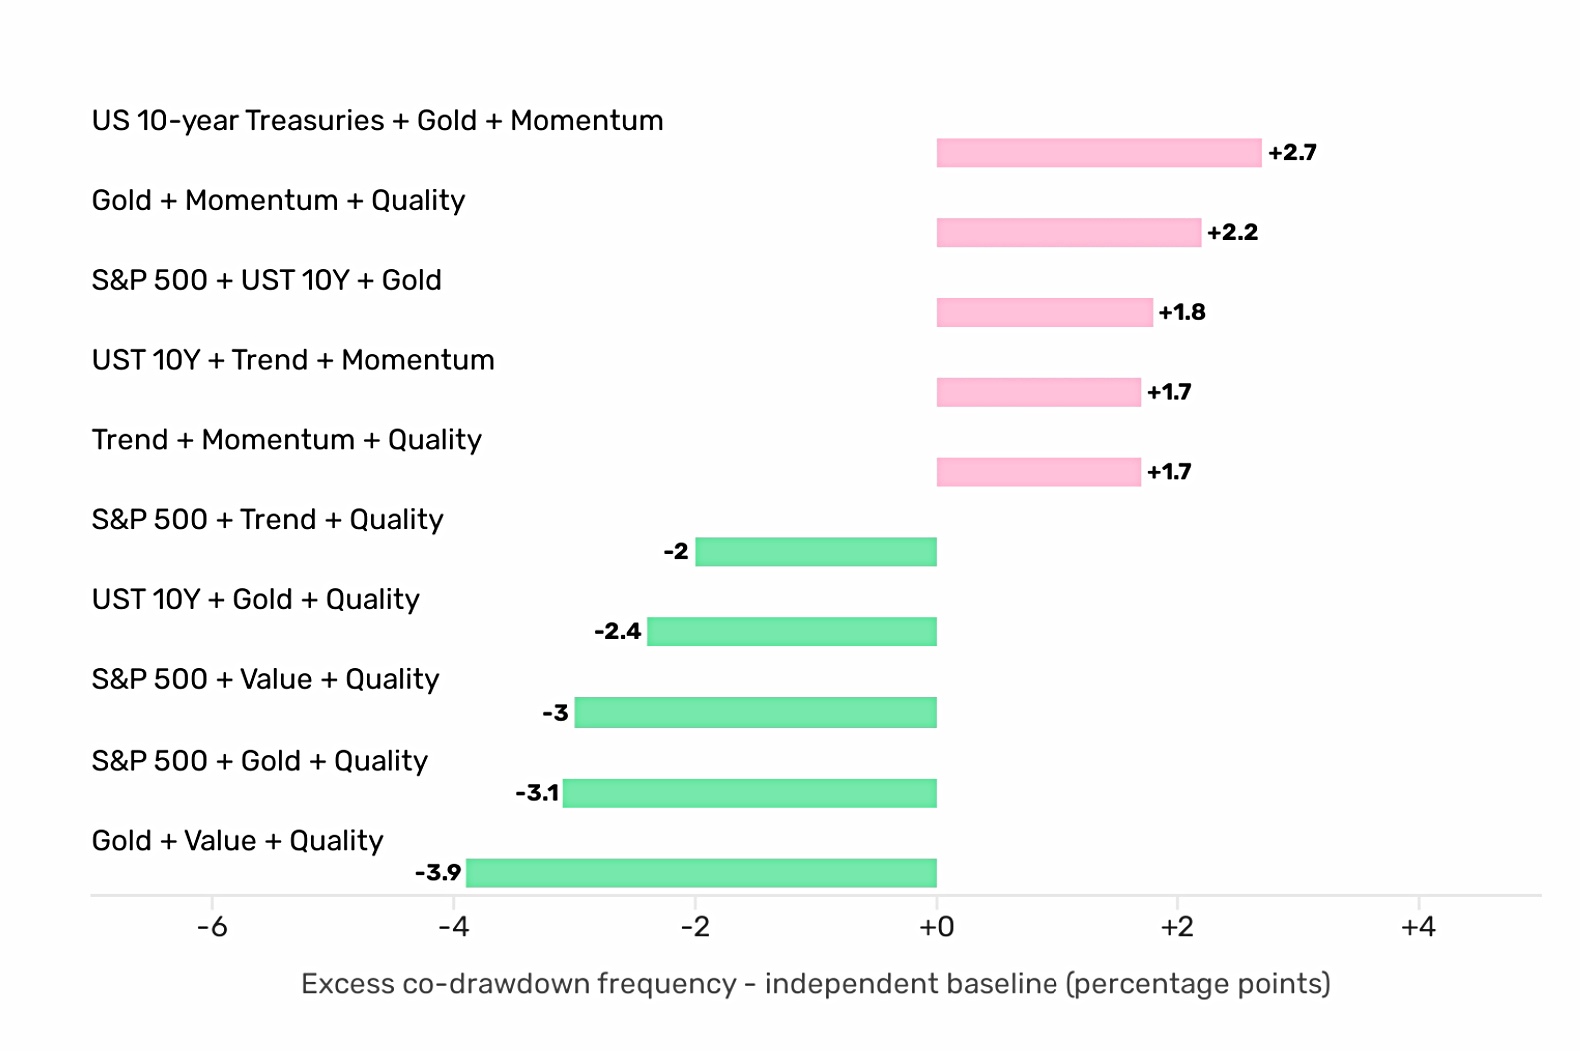
The three winning sets that feature stocks also include:
- Gold and Quality
- Value and Quality
- Trend and Quality
I’m surprised to see Value in there, and also surprised that the other two winning combinations match Gold and Quality with either Value or Bonds.
I must admit I’m not sure how best to interpret these sets of three assets, so I’ll focus on the two asset correlations instead.
That’s it for today.
- Until next time.
Mike Rawson
Mike is the owner of 7 Circles, and a private investor living in London. He has been managing his own money for 40 years, with some success.