Hawk and Serpent #2 – Rise of the Dragon
Today’s post is about an update to an asset allocation paper we looked at last year – Hawk and Serpent, from Artemis Capital in Texas.
Contents
Hawk and Serpent

Artemis is run by volatility trader Christopher Cole.

The purpose of the original paper was to design an asset allocation that will preserve wealth over a 100-year timescale.
- You might see it as a new spin on the Lazy Portfolios approach.
The Hawk and Serpent themselves are an allegory borrowed from history.
- In the investment context, the serpent represents the secular growth cycle (rising asset prices followed by fiat devaluation and debt expansion) and the Hawk’s wings represent the forces of destruction.
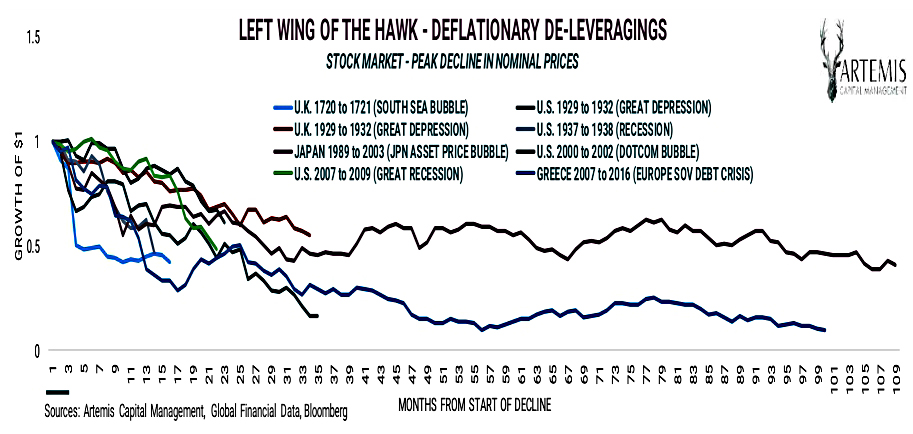
The left-wing is deflation, though an ageing population, low growth and debt default.
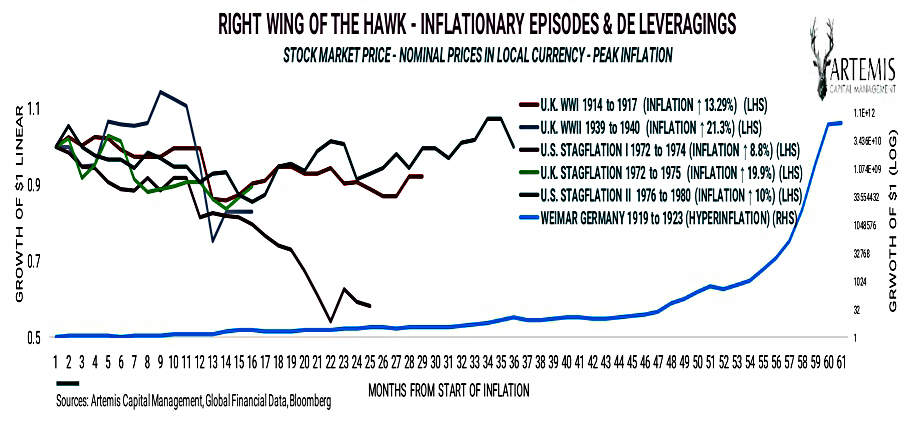
The right-wing is inflation, fiat default and helicopter money.
The 100-year portfolio needs to work through these booms and busts.
- Traditionally diversified portfolios (including my own) are mostly long-growth, with a modest allocation to crash protection in order to reduce volatility and increase the Sharpe ratio.
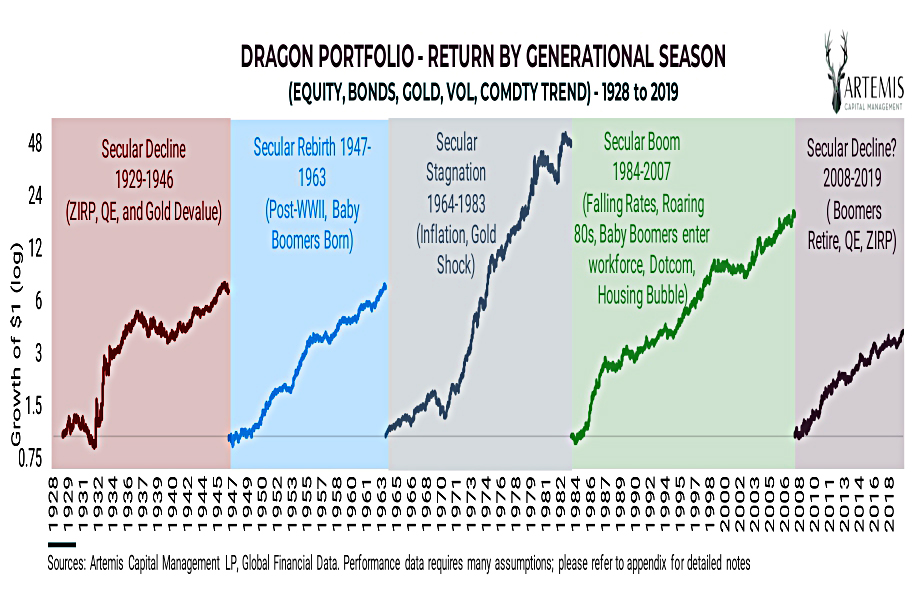
Seasons
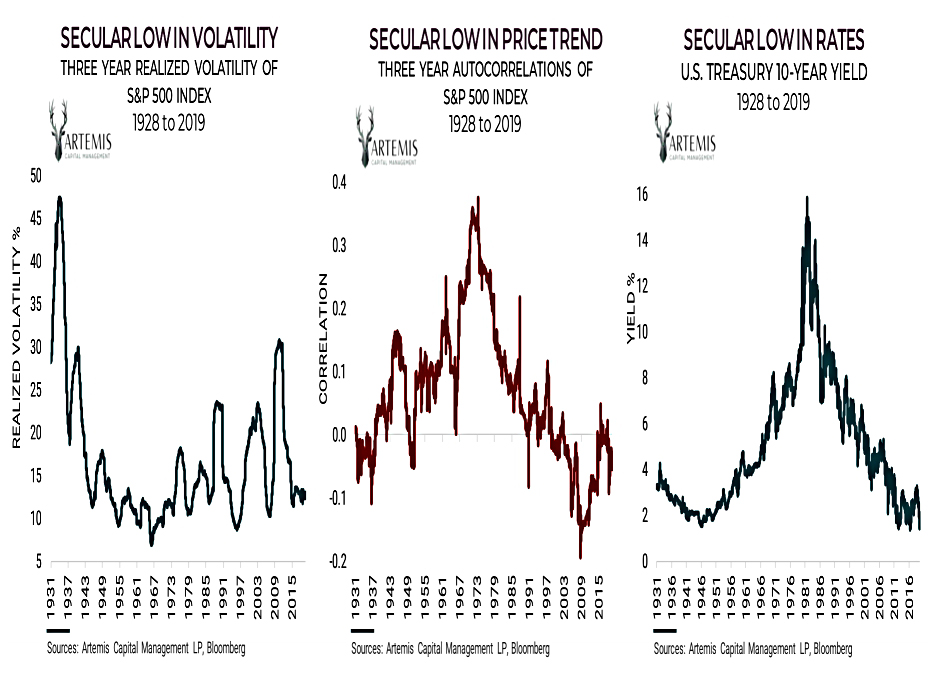
Artemis divide the last 100 years into five “generational seasons”.
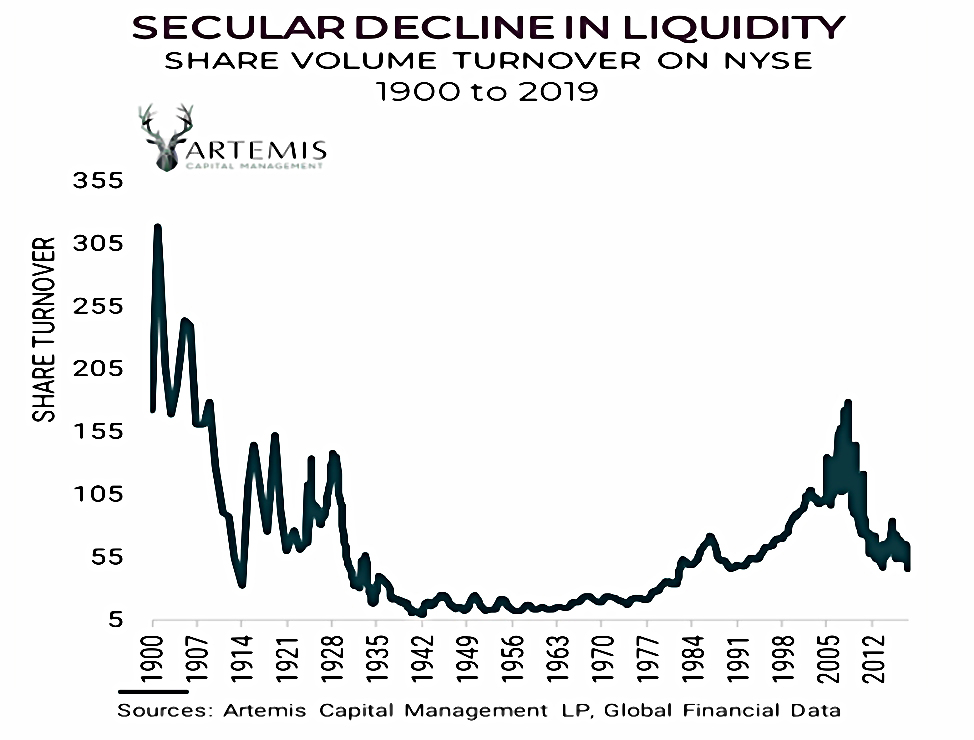
After a tremendous boom from 1984 to 2007, Artemis believes that we are now into a secular decline.
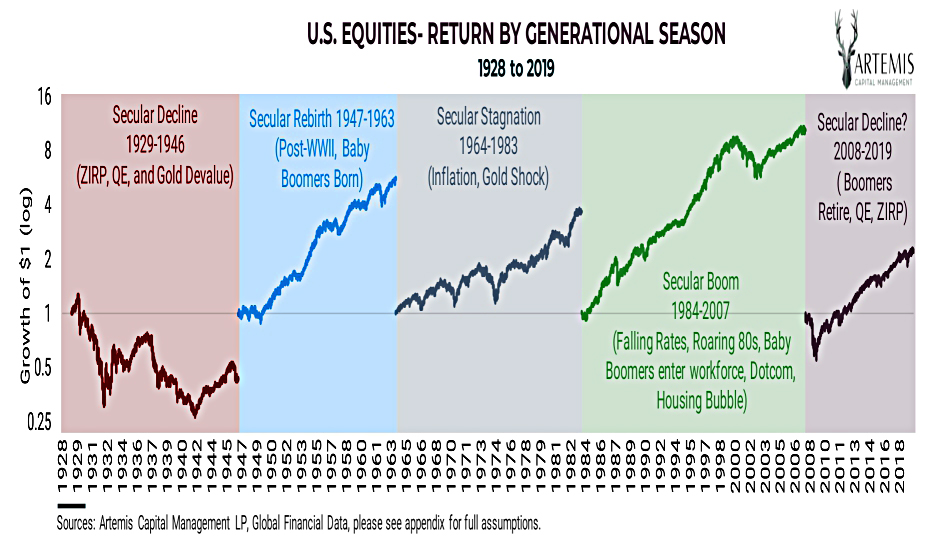
You wouldn’t know it from looking at stock returns.
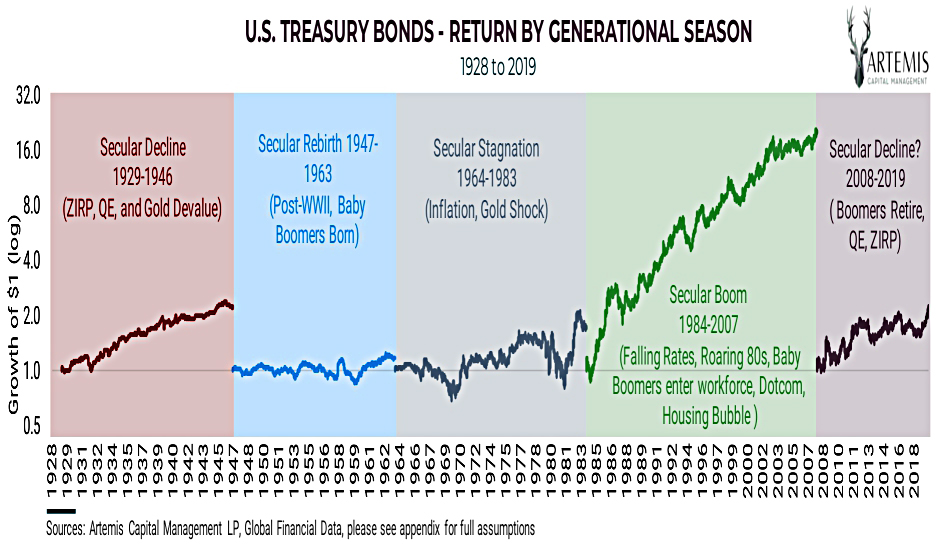
Treasuries also seem to be doing fine.
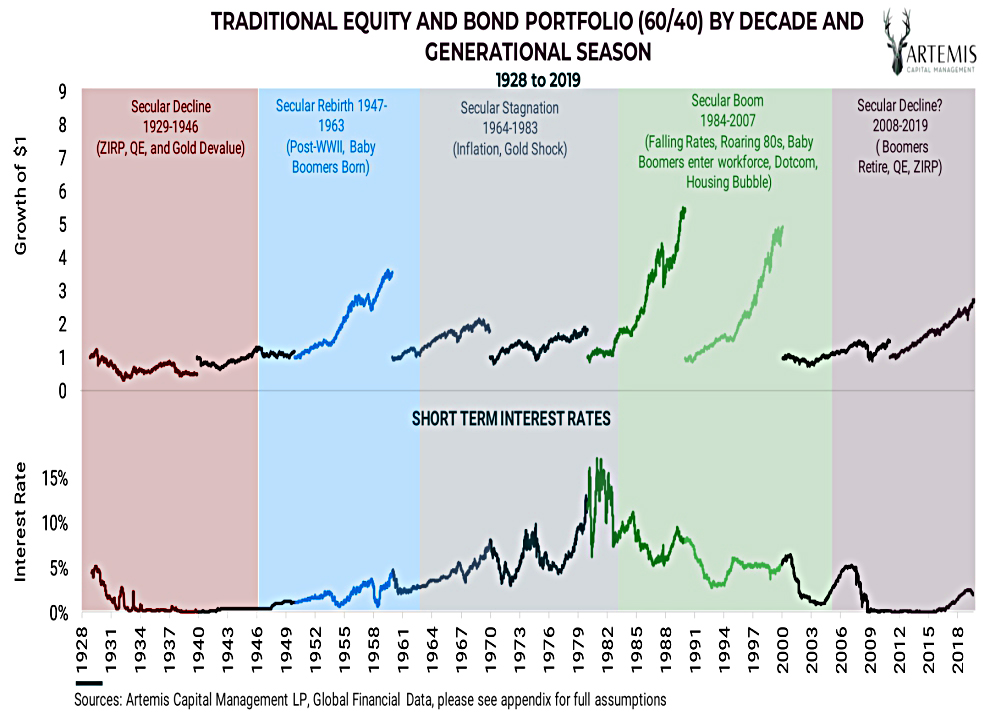
And the industry-standard 60-40 stock-bond portfolio also seems to have coped.
Losing long-term strategies
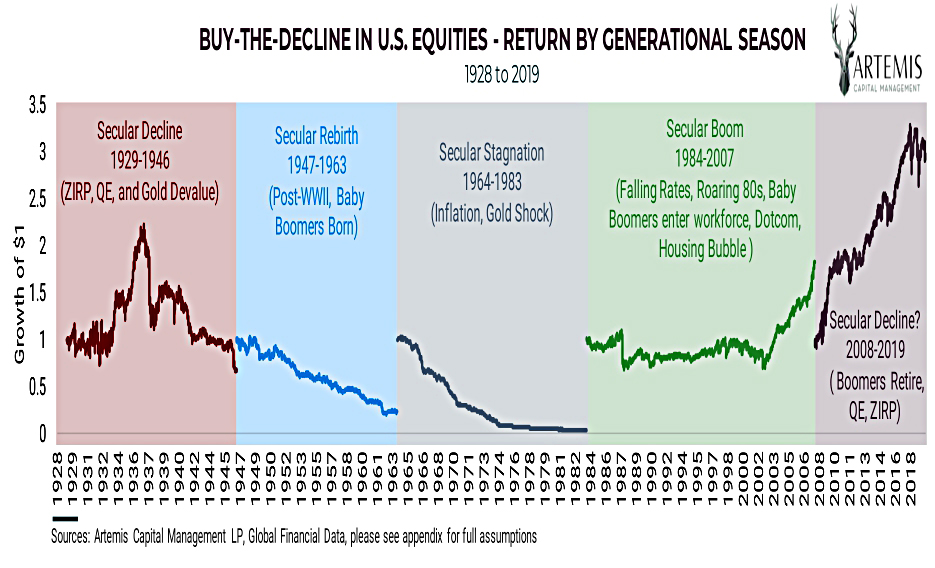
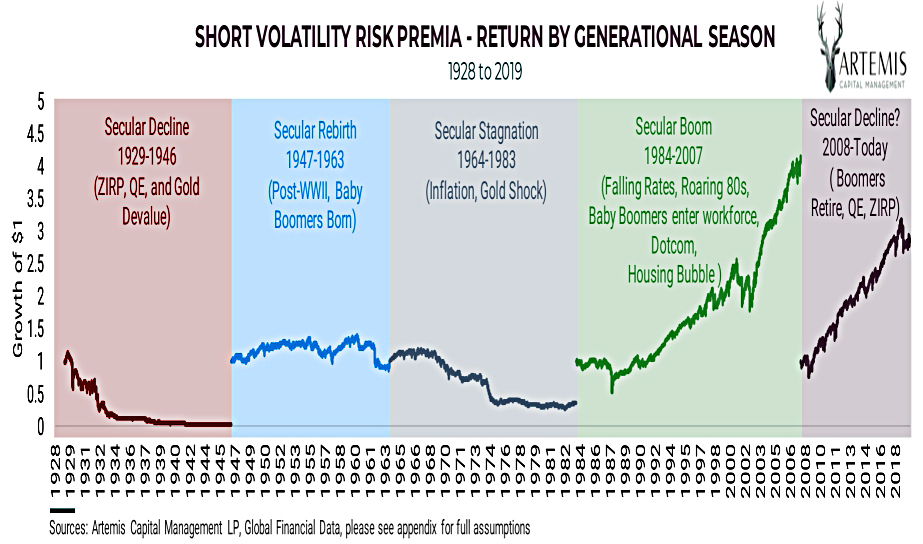
Artemis pointed out that several strategies that have worked well in recent years have lead to total capital depletion at various points during the past century.
- These include “buy the dip” and “short vol”.
Anti-correlation
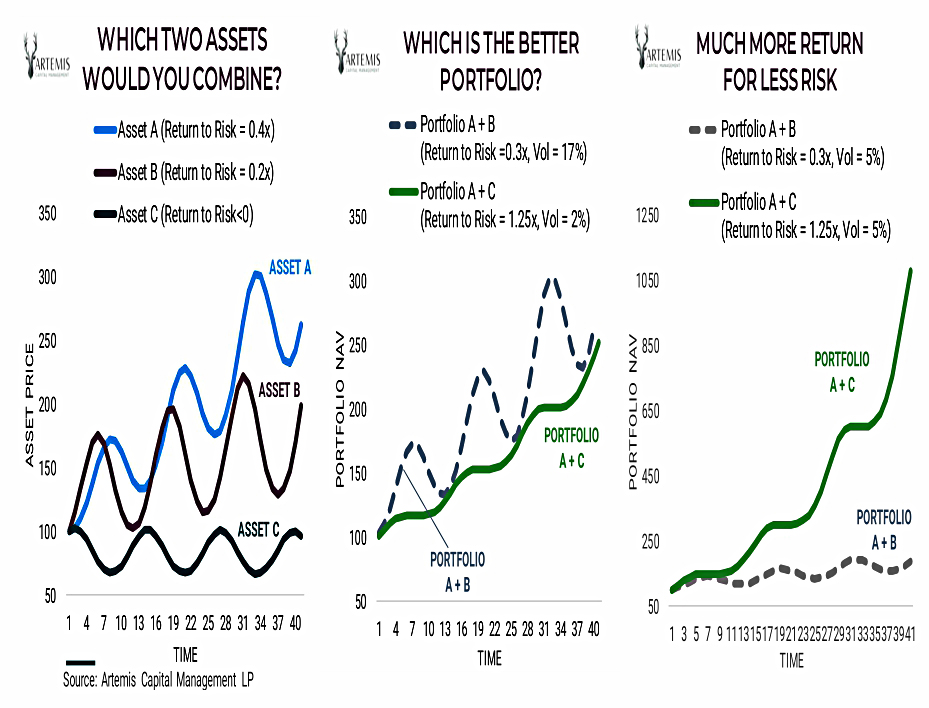
The paper emphasises the benefits of low and negative correlations.
- In the chart above, A and B are too closely correlated.
Asset C has much lower returns than B but is still a better partner for A.
Anti-correlation is worth more than excess return. A defensive asset can be precious to the total portfolio, even if it fails to make money consistently.
Here’s a useful table of correlations from the Appendix:

And here’s one showing that the current negative stock-bond correlation is not typical:
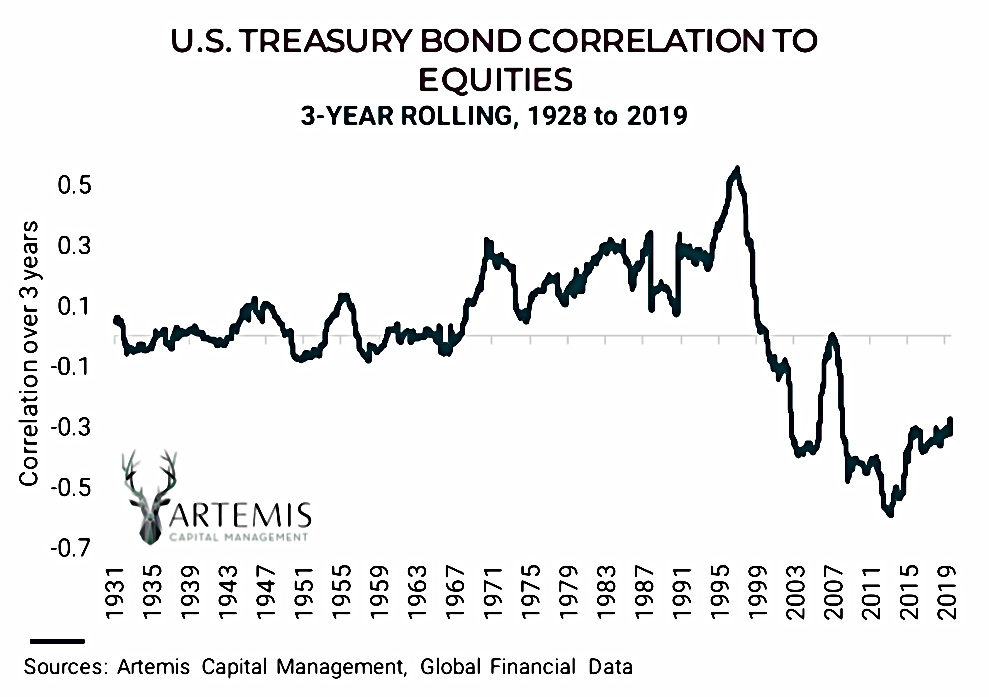
This is why Treasuries don’t work as a stock diversifier over a 100-year time scale.
- We’ve looked at this recently in our posts on revisiting 60-40.
Extra assets
Artemis look a several other traditional and non-traditional assets in order to build up their 100-year portfolio.
- Serpent assets (Stocks, Real Estate, Corporate Bonds) benefit from secular growth and stability.
- Hawk assets benefit from secular chance (Long vol, Commodity trend) or from monetary debasement (Gold).
Corporate bonds look remarkably similar to Treasuries.
- Real estate is something like stocks.
Gold looks interesting, as does commodity trend following, and long vol.
The dragon portfolio
Artemis calls their winning 100-year portfolio the Dragon.
The Dragon Portfolio’s theory of risk corrects a fatal flaw in conventional portfolios: dangerous over-reliance on a stable relationship between Stocks and Bonds and their performance.
The Dragon is designed to cope with both inflation and deflation.
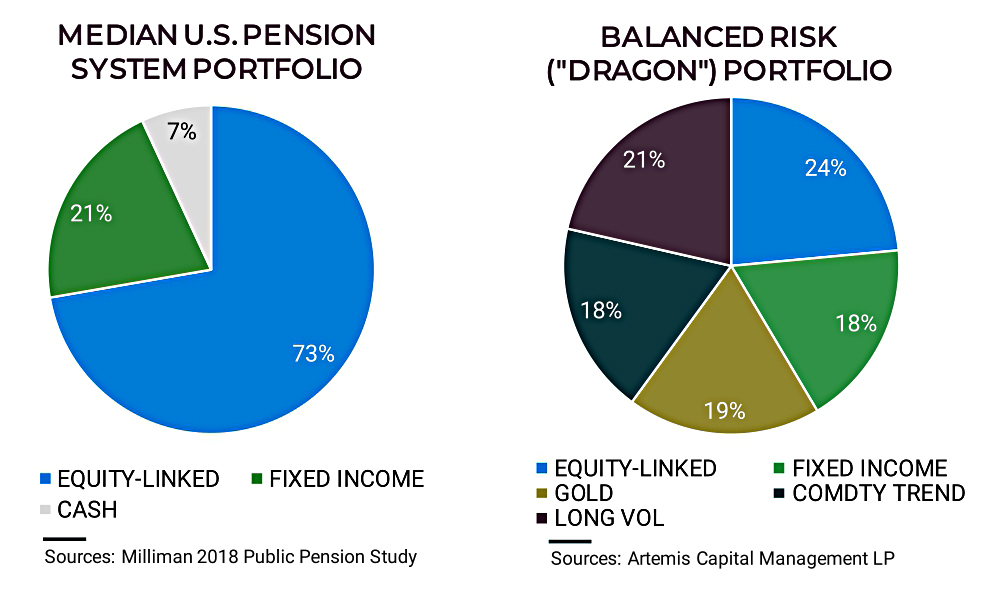
It’s a strange beast:
- 24% stocks
- 18% bonds
- 19% gold
- 18% commodity trend
- 21% long vol
But it performs well under all of the five “generational season” regimes.
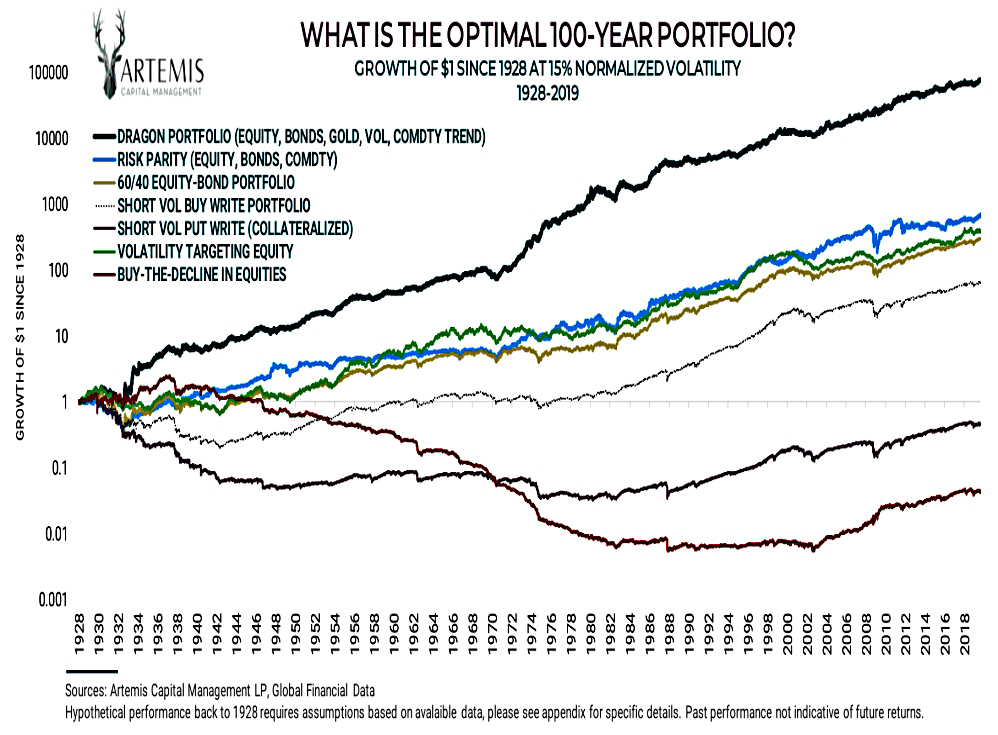
And it beats all of the competition over the last 90 years.
On an unadjusted basis, the Dragon Portfolio generates approximately the same returns as a Traditional 60/40 Portfolio with half the risk.
I was pleased to see that risk parity (the core of my own approach) came second.
Implications
According to the paper, my portfolio (in common with most people’s, I would imagine) is:
- Overweight stocks and bonds
- Underweight gold, trend and vol
There are a few things to think about here:
- Leverage
- Over-fitting
- Implementation
The chart showing the outperformance of the dragon portfolio is standardised to 15% volatility.
- This means that many of the portfolios use leverage (since their natural volatility will be lower than that).
I’m unwilling to use much leverage (I’m too old and don’t have an income stream, plus I can’t borrow cheaply)
- My leverage is usually between zero and 3%, though I can imagine using 10% leverage under certain circumstances.
This means that I have to hold a higher equity allocation than the maths requires, in order to hit my return target (my hypothetical SWR). (( In practice, my real withdrawal rate is much lower, but I stick to my investing principles ))
- I would need to do something similar to adapt the Dragon portfolio.
The second issue is over-fitting.
- The Dragon portfolio fits the last 90 years, but the next 40 years might be different.
My takeaway is that I should consider upping my allocation to my Dragon underweights (gold, trend and long vol).
This brings us to implementation.
- More gold is easy, and I have a version of trend/momentum, but long vol is trickier (and many solutions won’t be available to the private investor).
I have an open action from last year’s post to dig into the technical appendices of the paper and work out I can use any of the methods that Artemis did.
- But first, the follow-up paper.
Rise of the Dragon
The new paper looks at how the Dragon portfolio performed through a “turbulent” 2020.
Artemis explores what an investable product would look like. We discuss challenges to implementing the Dragon Portfolio and why it is an important tool during the next phase of global markets.
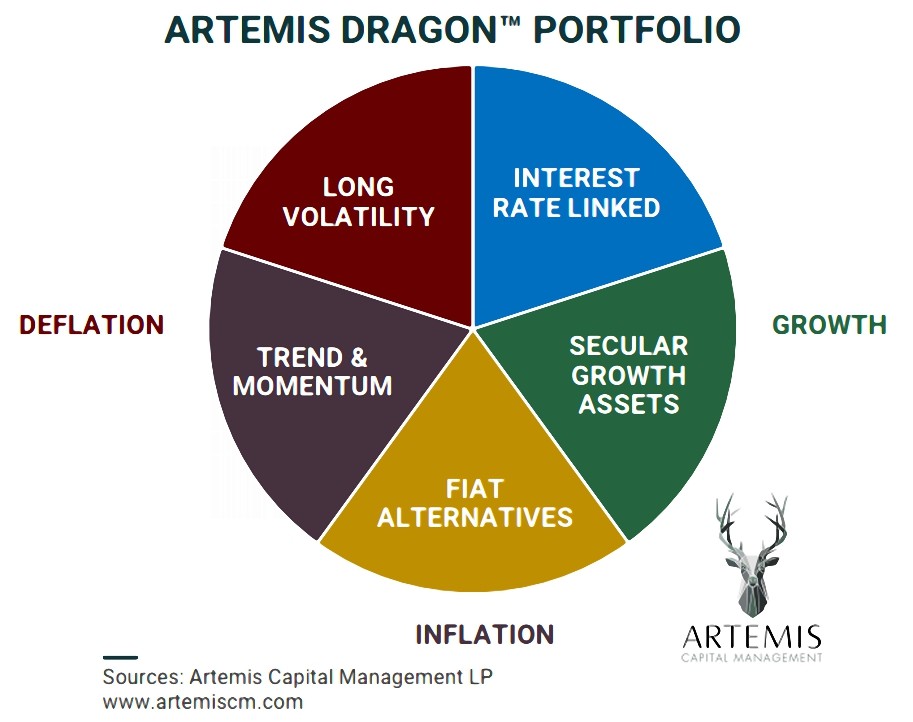
Artemis have an updated pie chart of the portfolio, with revised labelling:
- Secular growth = international equity
- Interest rate linked = US Treasuries
- Fiat Alternatives = Gold but now also some Crypto
- Long Vol remains
- Trend & Momentum remains
Over 100 years of market cycles, performance from at least two of the five regime classes led to gains in the Dragon Portfolio regardless of the environment, eliminating the need to predict the business cycle or inflation.
2020 performance
2020 was the ultimate trial, representing an entire business cycle condensed into twelve months ranging from the deflation in the spring, fiat devaluation and asset price boom in the summer, and reflation by winter. In effect, we went from a 1930s deflation to a 1999 speculative mania in just a few months.
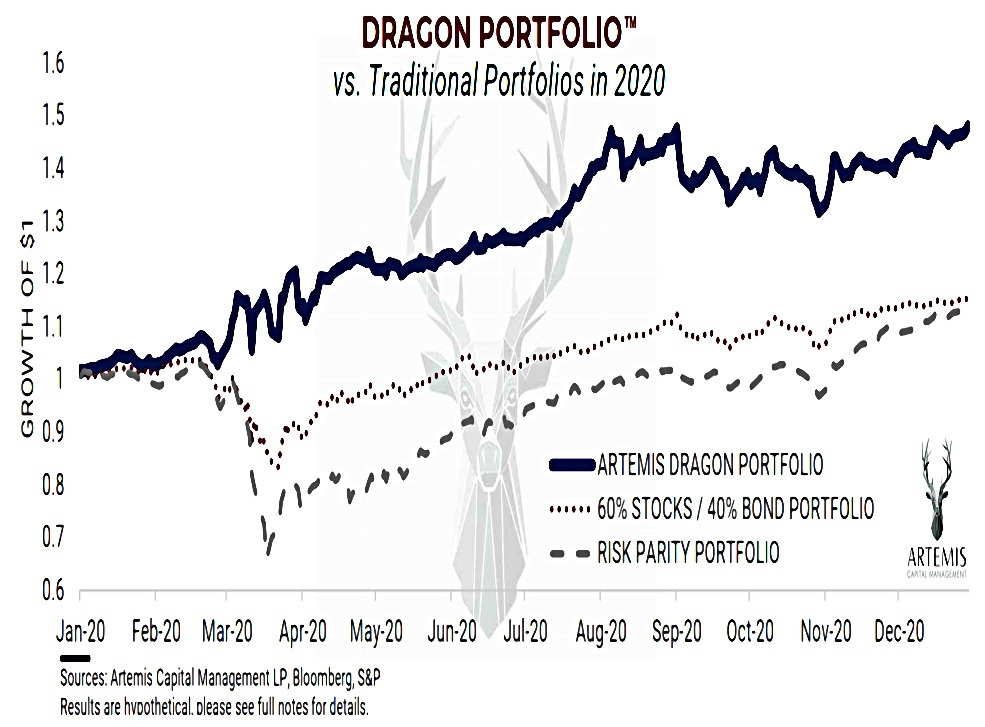
The Dragon Portfolio gained +52% gross in 2020 with a -11% maximum decline while traditional portfolios (60/40 Stock-Bond and Risk Parity) stumbled. The classic portfolios achieved less than one-third of the return with three times the drawdown.
This analysis was based on real performance data from third-party managers and strategies, net of fees and transaction costs.
- Only gold was used as the Fiat Alternative and Artemis’ own Long Vol strategies were included.

The Dragon was up every quarter and in 10 out of 12 months.
- Big gains relative to the traditional portfolios came during the March crisis.
Reflation was the worst relative performance regime for the Dragon.
Implementation again
In this paper, Artemis looks at the problems with implementing a DIY version of the Dragon.
They highlight four issues:
- Dead Cash
- Long vol and Trend strategies use only 1% to 20% of the capital allocated to their strategies at any one time.
- Artemis recommends using managers with centralised cash management, though it might be possible to design a DIY version of such an approach.
- Access to the best managers
- Long Vol and Trend are not easy to access via ETFs/ETPs (particularly in the UK) and funds that are available are likely to be inferior to the corresponding hedge funds.
- Volatility is particularly tricky in this regard.
- Diversification
- Since many of the hedge funds Artemis recommend have high minimums, diversifying across several managers requires even more money.
- Rebalancing
- The first issue here is the illiquidity of some of the underlying assets, though this is more of a problem for the true Dragon portfolio than for a DIY version using ETFs.
- The second issue is behavioural – it’s important to only rebalance back to the target allocations for each asset class, rather than lumping on to whichever asset appears likely to do best under the macro regime which has recently arrived.
At the lows in March 2020, investors may have been tempted to transfer all their monies into Long Volatility. Likewise, as Equity markets reached speculative fervor by the end of the year, it was tempting to over-allocate Equity or Crypto.
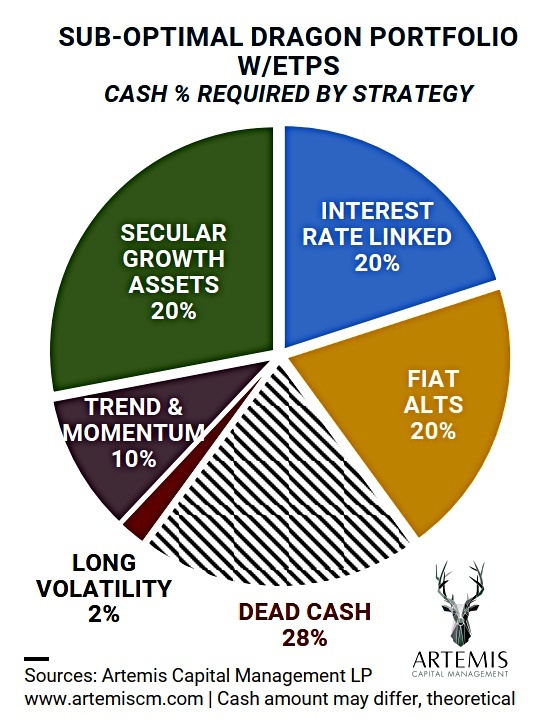
There’s a chart of the DIY Dragon allocation.
Recency bias

Artemis once again warn against overconfidence from recency bias towards a period in which the 60/40 portfolio has done extremely well.
The last four decades were among the most considerable Equity and Bond price appreciation periods in 2,000 years of economic history. This tremendous performance in stocks and bonds is from a self-reinforcing spiral led by falling interest rates (17% to 0%), favorable demographics, falling taxes, globalization, unprecedented monetary policy, and historic debt issuance.
In contrast, looking ahead:
Debt is at all-time highs, taxes are rising, interest rates can’t go much lower, and demographics are lacking across the developed world.
Conclusions
- The Dragon portfolio coped well in 2020 with a stiff test (of short duration)
- I still think a DIY implementation of something approaching the Dragon is feasible.
- I would expect my watered-down dragon to carry less cash, gold and long vol and more stocks.
- I still need to dig into the appendix of the earlier paper to see if I can implement the Artemis Long Vol strategies
- If not, I’ll need to do a wider trawl around approaches to Long Vol.
Until next time.
Mike Rawson
Mike is the owner of 7 Circles, and a private investor living in London. He has been managing his own money for 40 years, with some success.