Tail Risk Strategies – State Street

Today’s post looks at an old paper from State Street Global Advisors on Tail Risk Strategies.
Contents
Tail risk strategies
The report is called “A Comparison of Tail Risk Protection Strategies in the US Market”.
- It was authored by Robert Benson, Robert Shapiro, Dane Smith and Ric Thomas, and appeared in the Alternative Investment Analyst Review way back in 2013.
Tail risk is the chance of a rare event occurring – something that would be in one of the tails of the probability distribution of all events.
- A common definition is an event that is more than three standard deviations from the mean – and sometimes, a market move of three standard deviations or more.
But in the report:
We define portfolio tail risk as the conditional mean portfolio return in months where equity returns exceed a loss of five percent.
There are three points to note:
- Investment returns are not normally distributed – the tails are larger (“fatter”) than would be expected.
- We are primarily interested in the left tail (losses) – investors tend to be relaxed about extraordinarily large gains.
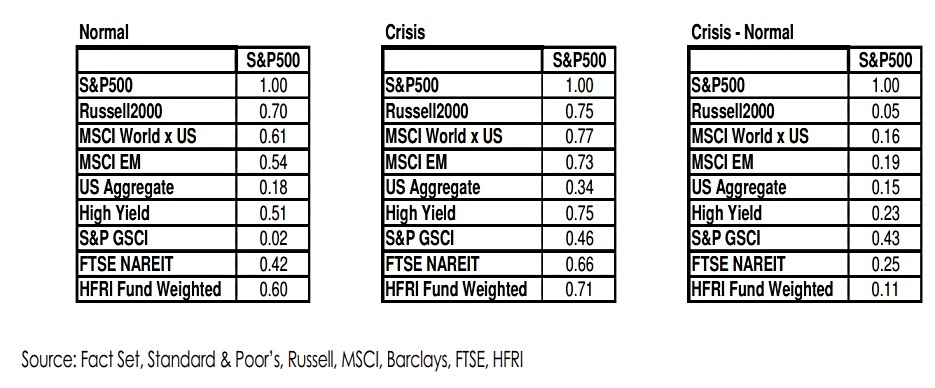
- Correlations (with the stock market) tend to increase during times of crisis what is sometimes called a contagion effect.
- This means that traditional diversification won’t work as tail risk protection.
We define a normal state as any month when the S&P 500 returned greater (more positive) than -5%, and a crisis state as any month when the S&P 500 fell -5% or worse.

Tail events are often confused with black swans as popularized by Nassim Nicholas Taleb, but black swans must be entirely unpredicted and surprising, whereas stock market crashes are all too predictable (though timing them is hard).
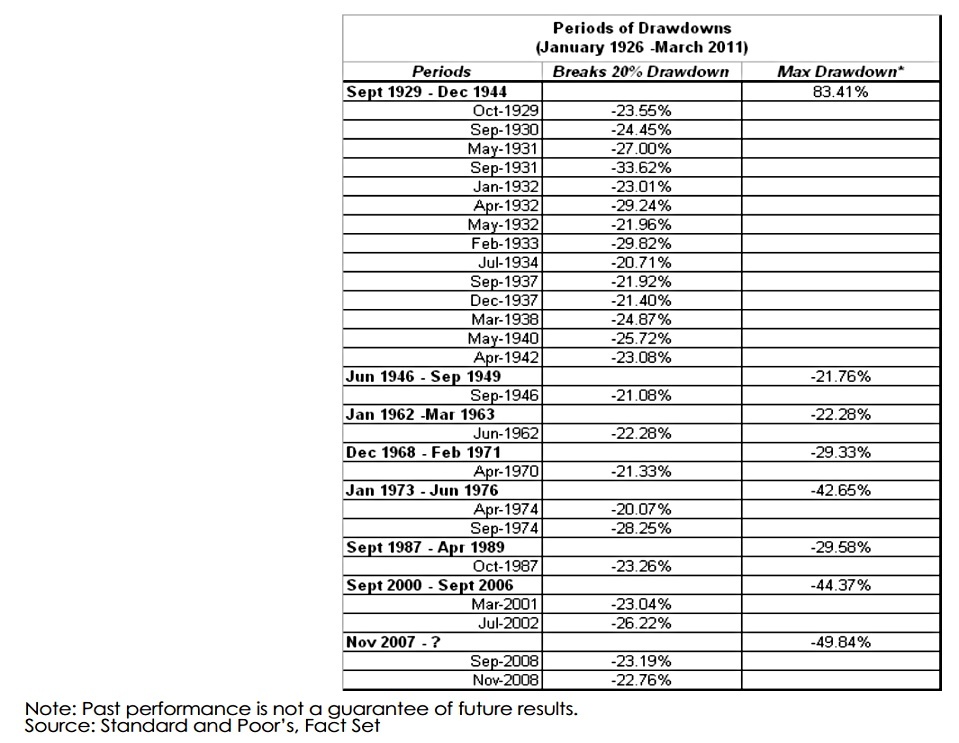
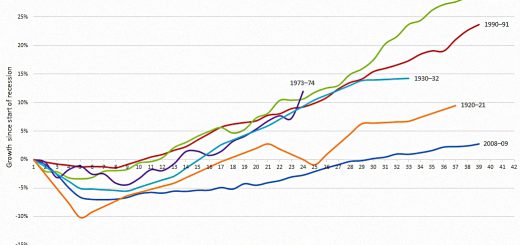
The S&P 500 has experienced 24 drawdown events of 20% or more since 1926, averaging one event every 3.54 years. Excluding depression-era stock market performance, we find that a drawdown event of 20% or greater occurred every 7.08 years since 1940.
Techniques
The paper looks at four popular techniques for managing tail risk:
- long volatility
- low volatility equity
- trend following, and
- equity exposure management
The authors want to find out three things:
- the fixed allocation to the strategy (portfolio percentage) which reduces tail risk by a given proportion
- the cost of protection (performance drag)
- the certainty (consistency) of the protection
The ideal tail risk strategy combines a low performance drag with a high certainty of protection.
Benefits
Tail risk strategies reduce overall volatility and enable investors to hang on to a portfolio with a higher risk level through the downturns.
- With more “dry powder” at the bottom, brave investors can reallocate to the bargains thrown up by the crisis.
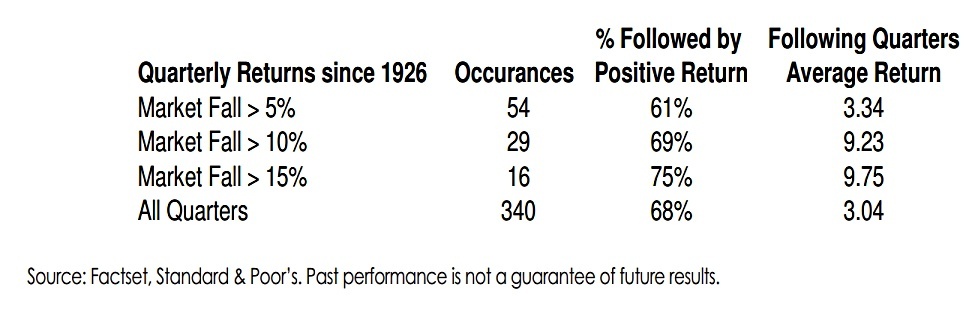
The market often rebounds significantly in the quarter following a sharp decline. Both the average return and the probability of a positive return rises as the magnitude of the prior market decline increases.
Performance

Let’s run through the strategies:
- VIX1m is a 1-month VIX future (NYSE:VXX)
- VIX5m is a 5-month VIX future (NYSE:VXZ)
- VARSWP1m is a 1-month variance swap
- VARSWP3m6m is a variance swap that receives the six months’ realized variance over the period starting at three months’ time
- LBMHB is long the low-beta quintile of the Russell 3000 and shorts the high-beta quintile
- DSB tracks the HFSI Short Bias Index of fund managers who short
- MGDFUT is the Barclays CTA index (trend-following futures)
- PUT buys one month to maturity 8.5% out-of-the-money puts on the S&P 500 index and liquidates one day prior to the expiration
- TACT buys the S&P 500 when it’s above its 10-month moving average and shorts it below the MA
Monthly returns to the S&P 500 are very negatively correlated (-0.63) to monthly percent changes in the CBOE VIX index. Most tail risk strategies exhibit negative correlation with equity returns and positive correlations to changes in VIX.
At this stage, the tail-risk protection strategies don’t look promising, since they have low or negative returns.
- But what are their returns like in a crisis?
Crisis performance
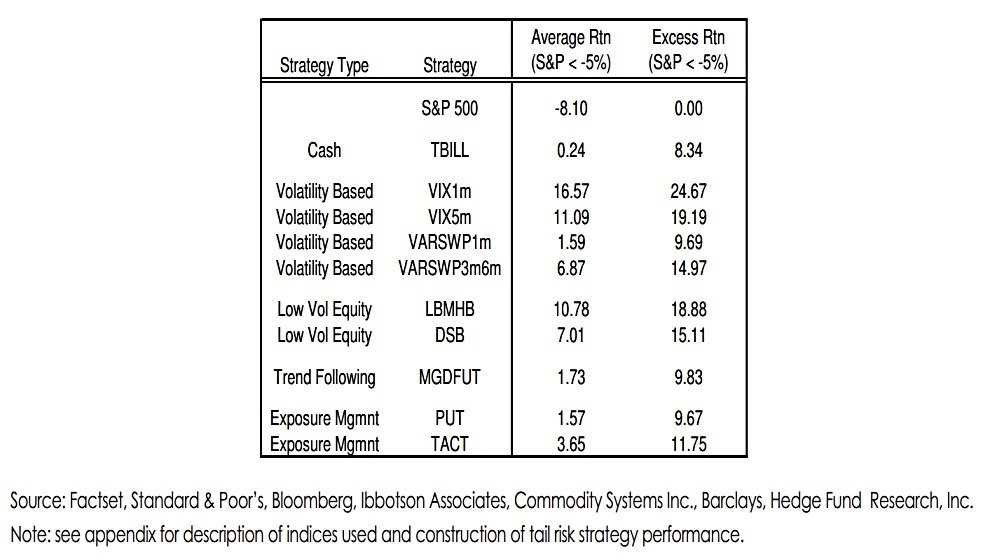
During crisis months between March 1990 and March 2011, the average return for the S&P 500 is -8.10% while average return to all of the tail risk strategies is positive. The two VIX futures strategies have the greatest hedging power, outperforming the S&P 500 by 24.7% and 19.2%. All strategies have stronger tail risk hedging power than a Cash allocation (TBILL) which outperforms by 8.3%.
The next chart shows the weightings to each strategy required to reduce the tail risk loss (baseline -8.1%) by a given percentage:
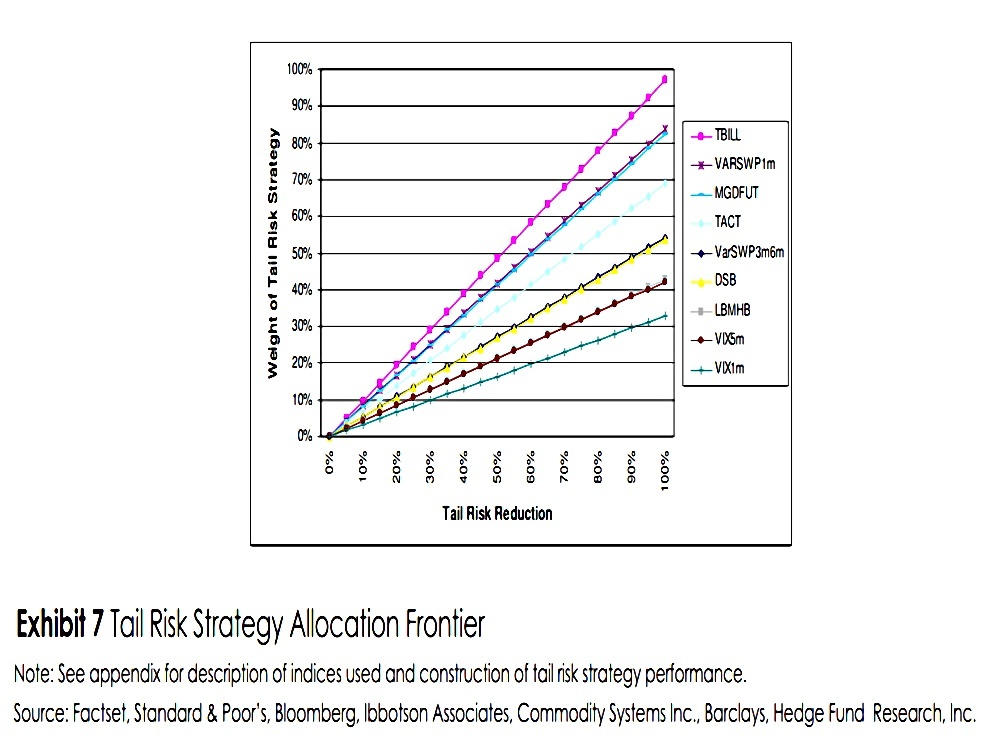
TBILL requires the largest and VIX1m the smallest allocation to reduce portfolio tail risk by a given amount. A higher required weight signifies a higher opportunity cost to the total portfolio, since less weight can be devoted to growth-seeking asset classes. Using this metric, cash (TBILL) is an expensive tail-risk hedge.
Performance drag
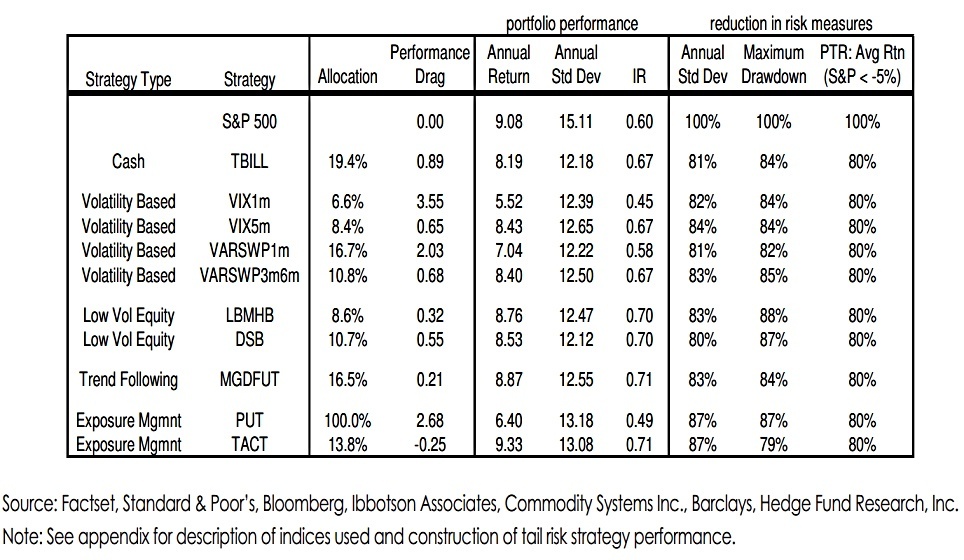
The paper next analyses the profile of sufficient allocation to each strategy to reduce the tail impact by 20% (from 8.1% to 6.5%).
For the put option strategy, we chose the 8.5% out of the money options as the strike that exactly achieves 20% portfolio tail risk reduction and so the allocation is given as 100%.
The performance drag from cash (T-bills) is 89 basis points – this is a hurdle for the other strategies to clear.
The long volatility strategies with allocations to VIX1m and VARSWP1m have performance drags of 355 and 203 basis points respectively, both worse than Cash. The strategy allocating to put options (PUT) also has a large performance drag of 268 basis points per year.
The paper explains the poor performance of VARSWP1m and PUT through the volatility risk premium.
- Equity index options are priced via implied volatility, which is usually higher than realised volatility.
VIX1m underperforms due to a prevailing contango relationship in VIX futures ( short term VIX futures usually trade at a premium to spot VIX).
But several strategies did well:
- VIX5m – 65 bp
- VARSWP3m6m – 68
- LBMHB – 32
- DSB – 55
- MGDFUT – 21
- TACT – 25
So trend-following comes out of this well.
Of the 24 months with greater than 5% loss in the S&P 500 between March 1990 and March 2011, 17 of them (or 71%) occurred with the S&P 500 below its 10-month moving average.
Certainty

The certainty measure used by the paper is “the conditional information ratio of the tail risk strategy’s excess return to the S&P 500” during crisis months.
- This is the excess return divided by its standard deviation, similar to a Sharpe ratio.
The information ratio measures the risk-adjusted returns relative to a benchmark while the Sharpe ratio compares the returns to the risk-free rate.
- In addition, the paper looked at the likelihood that each strategy produced a positive return in a crisis month.
Cash (TBILL) was the most consistent hedge.
The VIX-based strategies have the largest variability in excess return and the long volatility strategies fare the worst as a group. Strategies that provide highly consistent protection are the two low volatility equity (stock selection) strategies and managed futures, all of which feature certainty measures above 2.0
Drag vs certainty
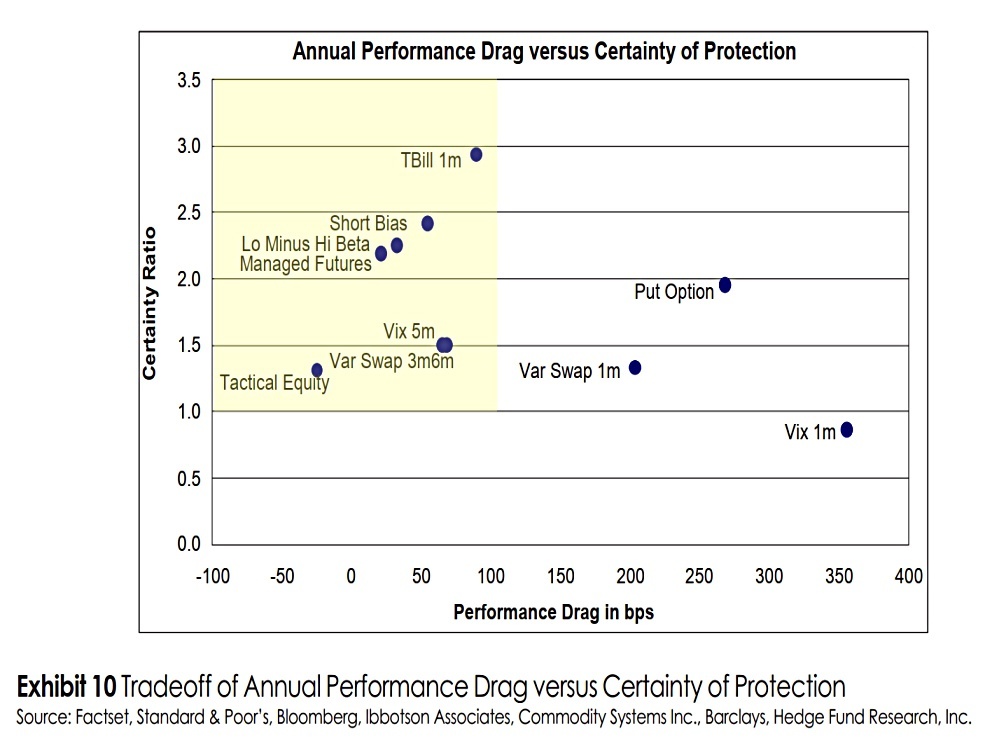
Plotting drag against certainty, the strategies within the yellow box performed best:
- Short bias, Low minus High Beta, Managed Futures and Tactical Equity.
Conclusions
Despite being a few years old, this remains an interesting paper.
Of the most successful tail risk strategies, managed futures (trend) and tactical equity (more trend) are probably the easiest for the private investor to implement by hand.
- Lo minus Hi beta would be a lot of work, but there are Smart Beta funds to help.
I’ll also keep my eyes peeled for ways to access Short Bias.
- And I’ll look at some alternative ways to access long vol.
Until next time.
Mike Rawson
Mike is the owner of 7 Circles, and a private investor living in London. He has been managing his own money for 40 years, with some success.