Copy Trader Selection
Today’s post looks at selecting traders to copy on eToro.
Copy Trading
Last time out, I opened an eToro account after a minor delay of six and a half years.
- I’m here for copy trading, so let’s have a look at the interface.
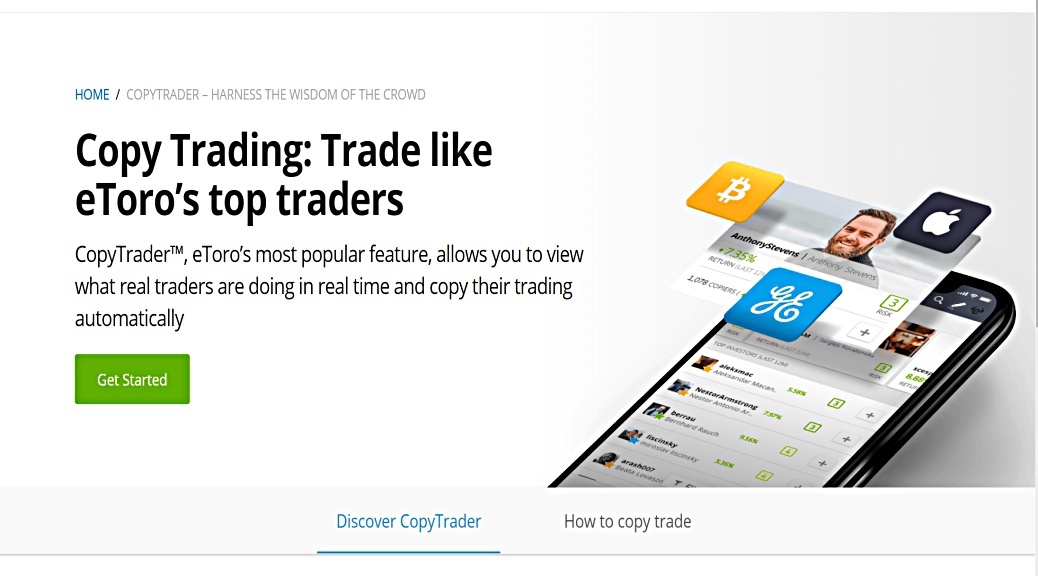
The landing page has a table of the top (most popular and profitable) traders.
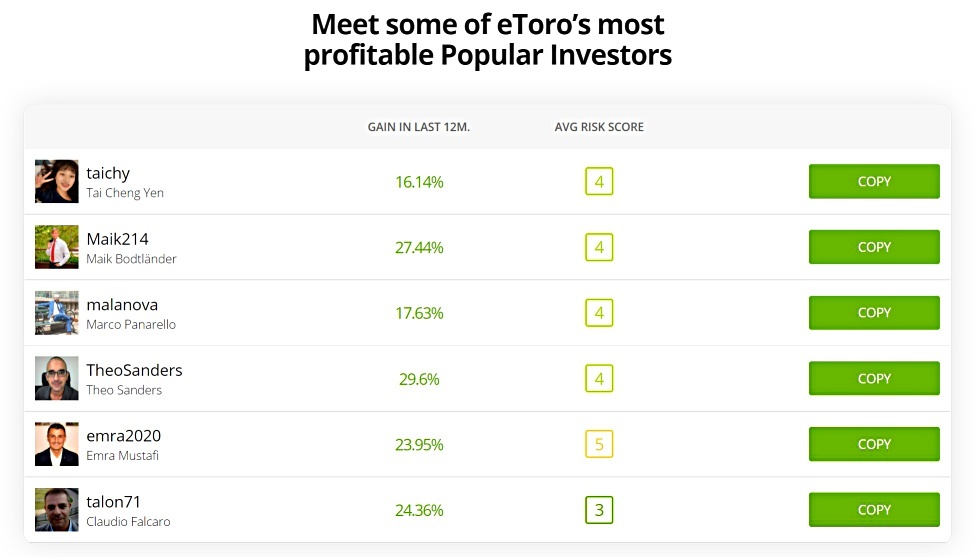
The table just shows the 12-month gains and an average risk score (more on that later).
- We’re going to need more information in order to make our selection.

Once I’m logged into the app, the Copy People page starts with three lists of traders:
- Editor’s choice
- Most copied
- Trending
Too subjective and/or social for me.
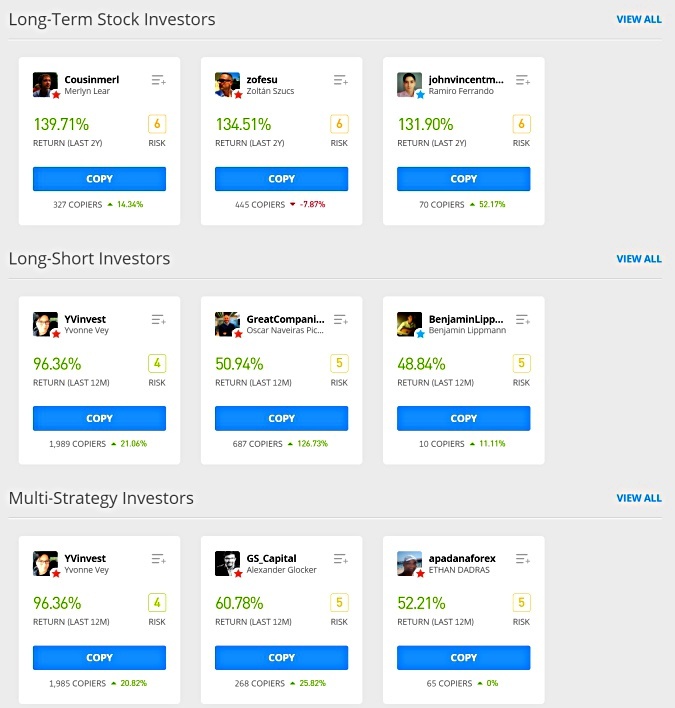
Below that are another three lists:
- Long-term stock investors
- Long-short investors
- Multi-strategy investors
That’s a bit better – we’re looking at asset classes and investing strategies now.
Each trader’s card shows a bit more information than the landing page list:
- 12-month return and risk level, as before
- but also the number of copiers and how that has changed (over an unspecified period of time)
We’ll drill down into an individual trader in a moment, but first, we’ll look at the filter bar at the top of the page.
![]()
We have four drop-down tabs:
- Location
- Markets
- Gains
- Lookback period
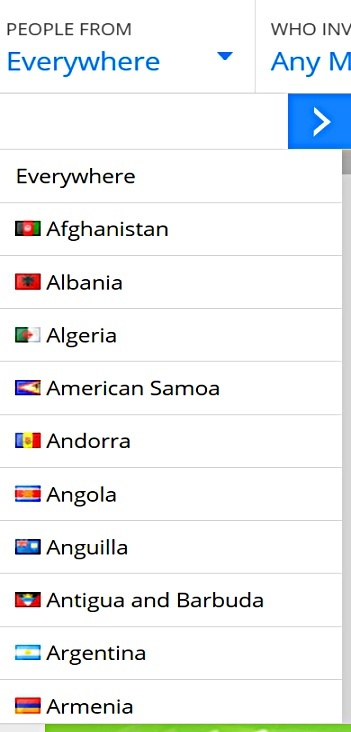
Location is a straightforward country list, from which you can make only a single selection.
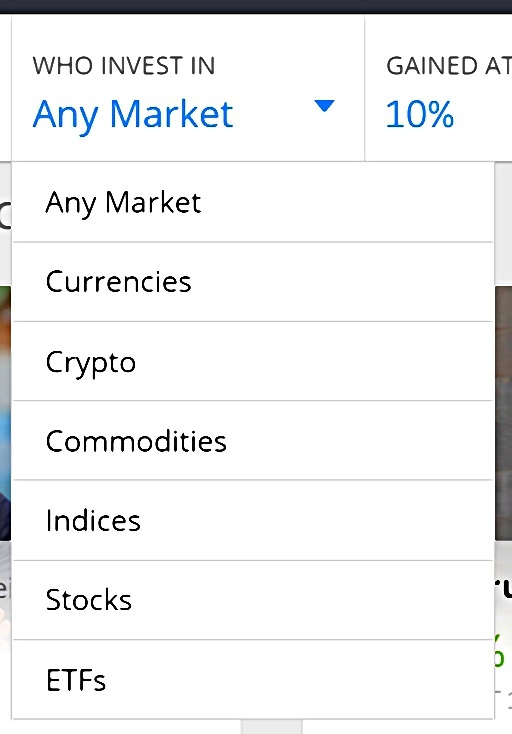
The market tab is a list of asset classes.
- Since portfolios can include multiple asset classes, presumably traders with partial exposure to the market you select will be included in your filtered list.
Gains will let you set any percentage number.

The lookback period is less flexible – you can have 3, 6 or 12 months, or 2 years max.

Finally, we have the refine tab, which looks a lot more useful.
- As well as the number of copiers, we have AUM.
- We also have allocation and active weeks – I’ll need to dig into what these mean.
- We can specify the number of trades and percentage of profitable trades.
- We have the average position size (in percentage terms, no doubt) and the daily and weekly drawdowns.
Lots to analyse there.
Risk
Before we dig into the information available on an individual trader, let’s look at how eToro assesses risk.
- The risk score is based on historical daily volatility.
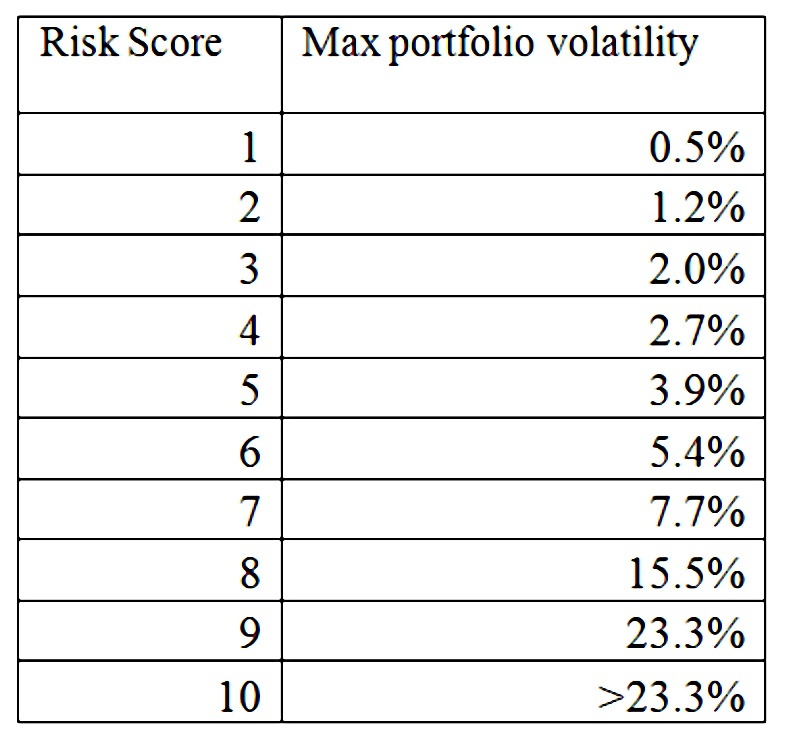
So this volatility is one standard deviation which means that the asset/portfolio should move by less than that on two-thirds of trading days.
- If we multiply this volatility by 3, we have a three-SD range, which means that the asset should move by less than this on 99% of trading days.
So if the daily volatility is 1%, the 3-SD range would be 3%.
- eToro calls this the “max portfolio volatility”, but it’s really just a 3-SD range.
eToro takes account of leverage (which increases volatility), and at the portfolio level (ie. at the Copy Trader level) also takes account of correlations,
- The example they use is that holding EUR/USD and USD/JPY simultaneously would reduce risk since they hedge each other to an extent.
eToro also looks at correlations between the traders you copy in order to work out your own risk score:
Whenever you add a new investment to your portfolio (be it an instrument or a copied trader), your risk will be recalculated and you will see your decision’s impact on your risk score.
At the moment this only happens when you actually invest, but it’s planned to show you what the impact of adding an instrument/trader would be on your risk score before you commit.
We should also benchmark these volatility ranges back to the real world.
- A relatively safe instrument would be the S&P 500, which has had daily volatility of around 1% in recent years (slightly less over the very long term).
That means that the 3-SD range is 3% which would give the S&P an eToro risk score of between 4 and 5.
A riskier asset would be bitcoin, which tends to have daily volatility of between 2% and 3% (though there are regular spikes into the 6% to 10 % range).
- This gives a 3-SD range of 6% to 9%, and an eToro risk score of between 6 and 8.
So as a starting point, I will target traders with risk scores of less than five.
- If that proves too restrictive, we can think about notching the maximum risk score up to six.
My understanding is that only traders with risk scores of six or less are eligible for payments from the copy trading system, though riskier traders can be copied.
User stats
Each trader has a stats page, made up of five tables (which eToro calls cards):
- Performance
- Risk
- Copiers
- Trading
- Additional info
I’ll use the first trader on eToro’s list as an example, who happens to be James Helliwell (TradesWithJames).
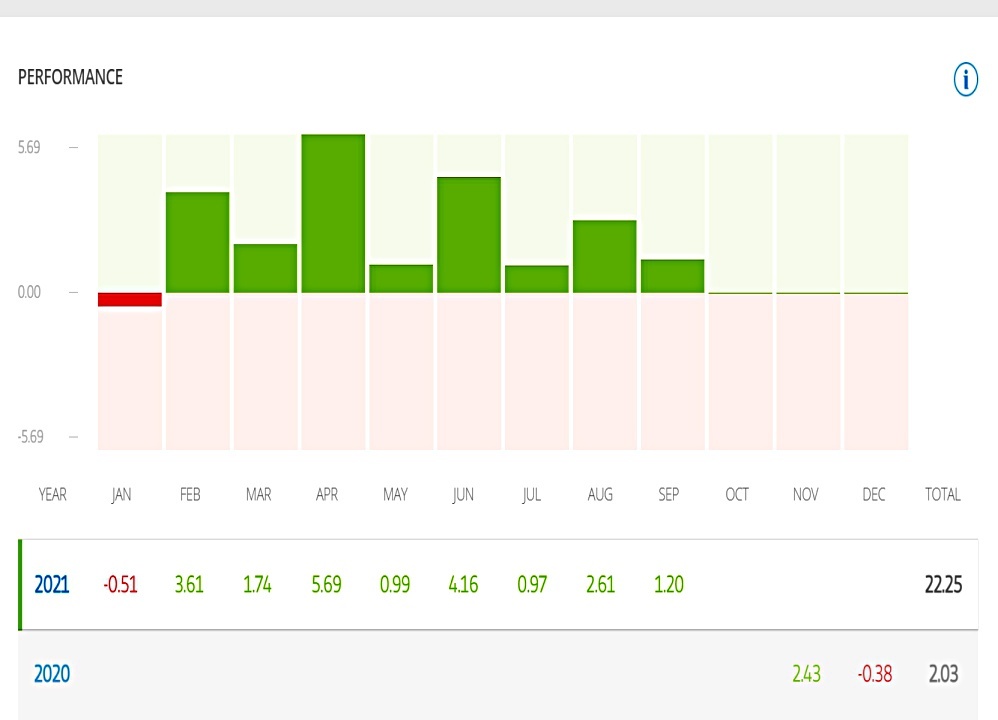
The performance card shows monthly bars for the current calendar year (not the trailing 12 months) and monthly and annual gains/losses for all months and years.
- The monthly figure takes account of cash flows in and out of the account.
The annual figure is derived by multiplying the monthly changes (not by adding them).
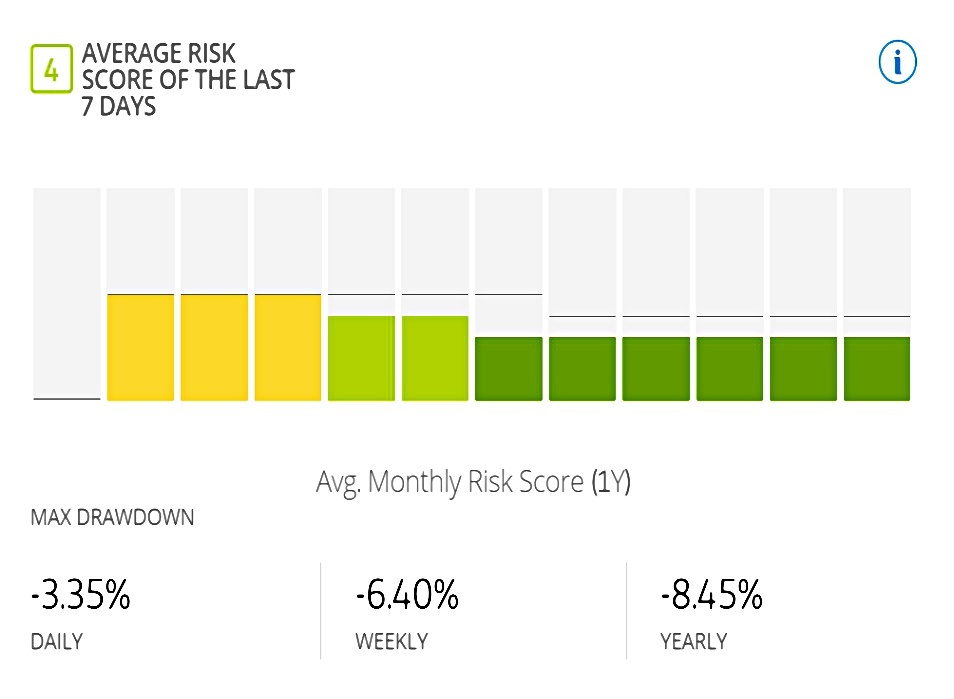
The risk card shows a chart of monthly risk scores for the past year and the past week’s risk score.
- It also has daily weekly and yearly max drawdowns.

I’m not very interested in the number of copiers that a trader has, or even the AUM.
- But I suspect I won’t be following anyone whose copiers are trending down, as presumably, I will be able to do a bit of digging and find out why.

The trading card shows the total number of trades (unfortunately over all-time rather than per year), the average profit and loss (though not the ratio) and the proportion of profitable trades.
- From these last three numbers, we can (manually) calculate the expected profit per trade, though this requires the heroic assumption that all trades are of equal size.
There’s also a useful breakdown of the assets that have been traded.
- James is basically a stock trader, with a bit of ETFs, indices and crypto.
The missing assets are currencies, commodities and people (ie. copying other traders).
There’s also more detail on the three most commonly traded assets.
- James has made an awful lot of trades in his favourites.
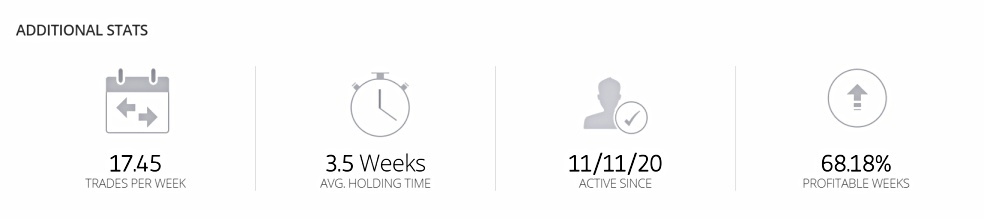
The Additional stats card shows the number of trades per week, the average holding time, the start date and the percentage of profitable weeks.
That’s it for the main trader tab, but each trader has three additional tabs.
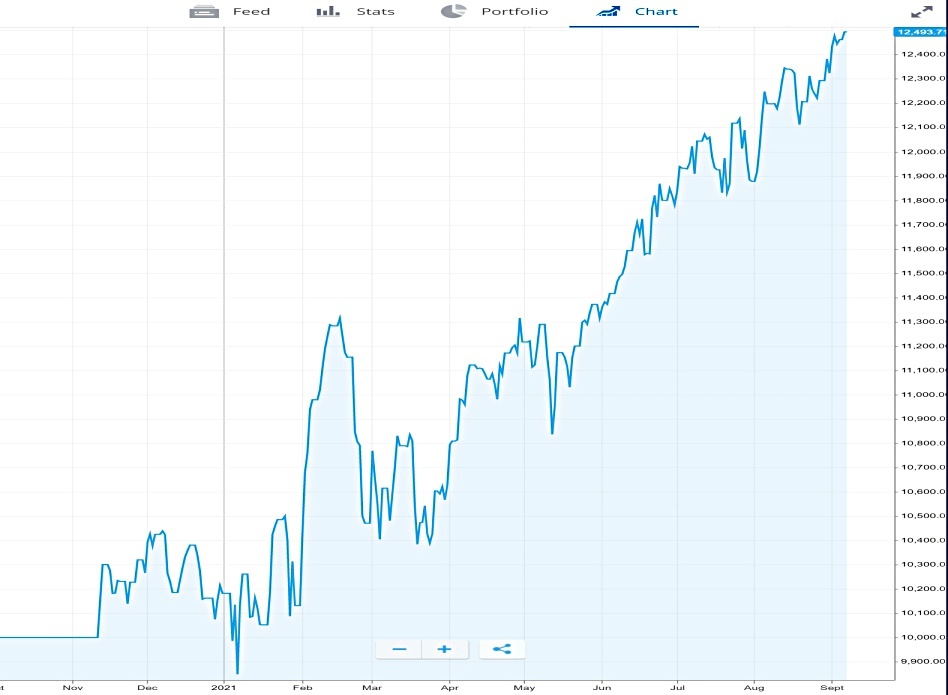
There’s a basic chart but you can’t add a benchmark.

There’s a portfolio breakdown, of which perhaps the most useful part is the count of holdings (here labelled market).
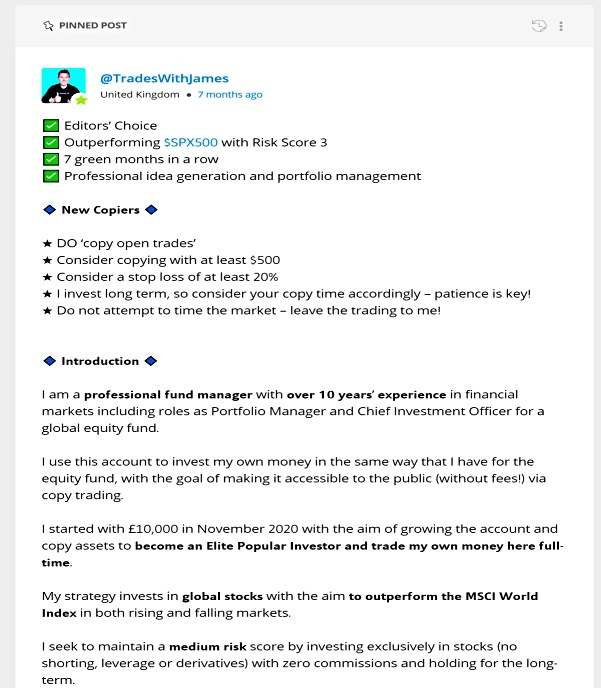
Each trader also has a feed – a mini-blog.
- James has a pinned post explaining his trading philosophy at the top of his feed.
Trading size
eToro provides the average trading size used by each trader.
- This is the proportion of their portfolio allocated to a position.
What we really need to know is the minimum trading size.
- That’s because, alongside the $200 minimum needed to copy a trader, any trades under $1 won’t be placed.
This means that at the $200 minimum, any trades for less than 0.5% of the trader’s portfolio won’t be copied.
- We can probably use the average trade size as a proxy for the minimum trade size, but there will be some trial and error involved.
Filters
At this stage, these are the filters I’m planning to dig into:
- Return – deciding on a suitable threshold won’t be easy
- Risk score
- Max drawdown (probably yearly)
- Portfolio size (20 to 50 holdings would be ideal) (( This might sound hypocritical given my own 400+ positions, but my portfolio is large and diversified, and follows a core & satellite approach. It’s best thought of as ten portfolios of 40 holdings each. Traders who want to be copied on eToro should in general be more focused ))
- Age of account (at least a year)
- Total number of trades (say a minimum of 50)
- Average/minimum position size (less than 10%/more than 0.5%)
- Number of trades per week (1 to 5 would be ideal)
- Average holding time
- Percentage of profitable weeks
- Expected profit per trade (if I can work out how to calculate this easily)
Diversification
And these are the dimensions that I will try to diversify across:
- Country
- Assets
- Declared trading strategies
- Time horizon (long-term/swing/day traders)
I think that’s enough for today.
- I’ll be back in a couple of weeks with a deeper dive into trader selection.
Until next time.
Mike Rawson
Mike is the owner of 7 Circles, and a private investor living in London. He has been managing his own money for 40 years, with some success.