FCA Investment Platforms Market Study
Today’s post looks at last year’s report from the FCA on how people use investment platforms in the UK.
Contents
Purpose
The purpose of the FCA research was to assess whether consumers can make good choices in the platform market and whether there is effective competition between platforms.
- The FCA wants to understand the extent to which consumers are shopping around and choosing platforms that reflect their preferences and provide value for money.
The survey covered more than 3,000 users of platforms that hold more than 90% of the assets under management in the UK.
- Note that although the report is from 2018, the research took place in 2017, which was a good year for UK investors.
- The FTSE-100 rose by 8% and ended the year at an all-time high.
People
Respondents were largely male, affluent (£67K household income, £260K in assets) and over-55.
- That corresponds well with the attendees of investment conferences and groups that I have attended (and indeed, I fit into this demographic).
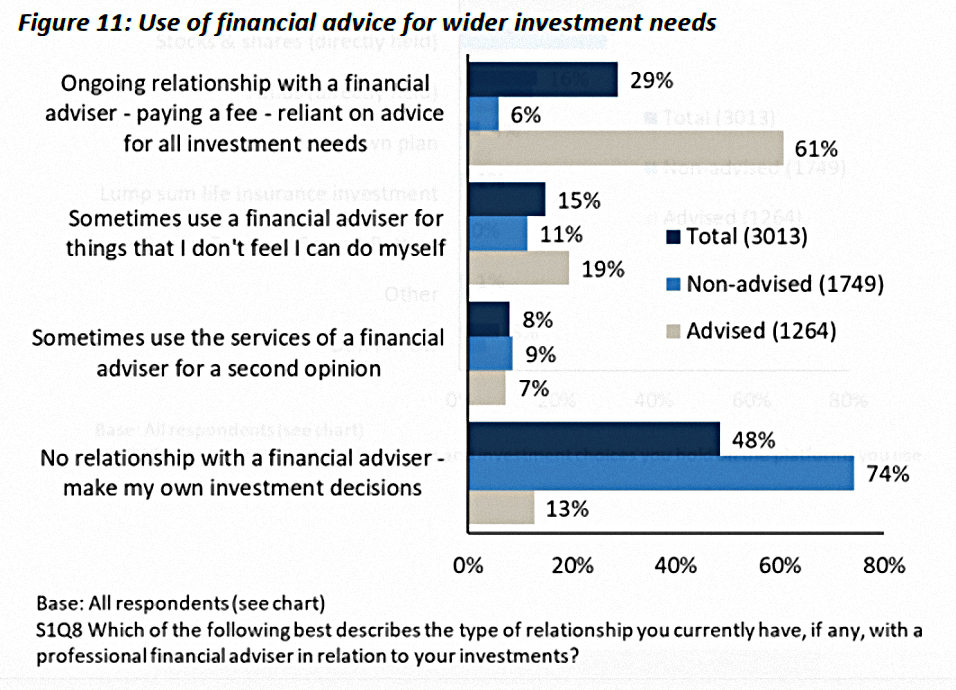
The main sub-groups are the advised (42%) versus the non-advised (58% – DIY investors as we would call them) and the confident versus the less confident and/or unengaged.
- Advised investors are slightly older, with lower incomes and more assets (probably because more are retired).
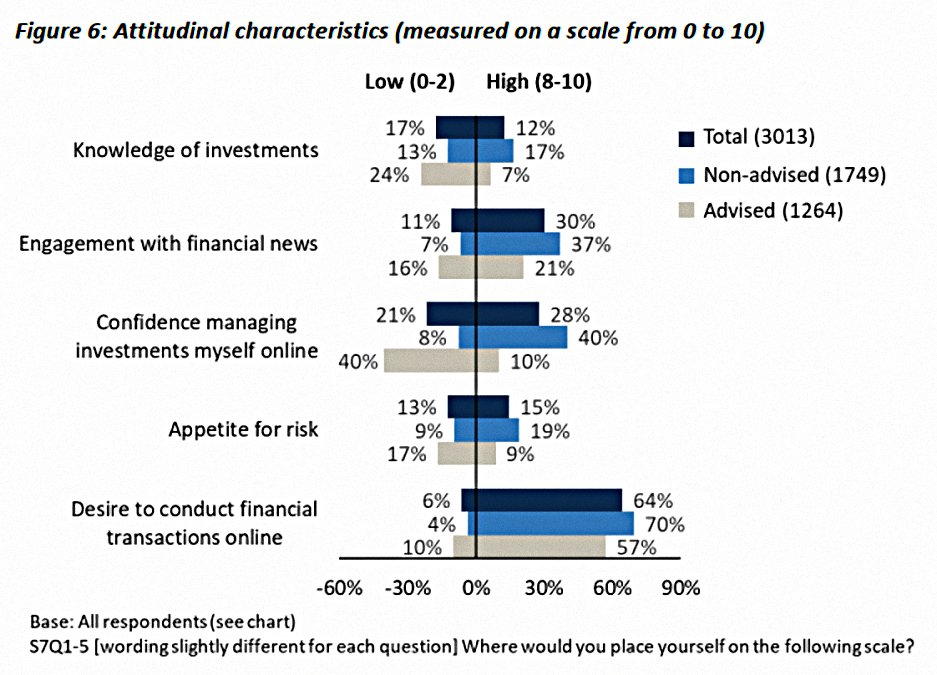
Unsurprisingly, non-advised investors tend to be more confident and engaged.
- Investors with advisors tend to delegate decision-making to their advisor.
I’m surprised by the advised/non-advised split – I was under the impression that less than 10% of the UK population paid for advice.
- According to the report, the only quotas used in the sampling were by platform, so that no provider was over-represented.
Since respondents to the survey were self-selecting, the more engaged are likely to be over-represented.
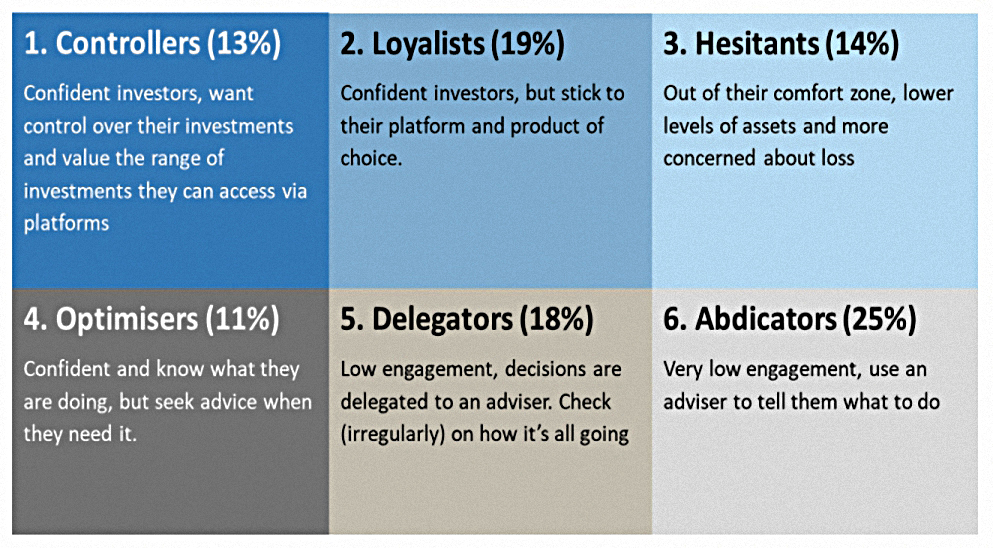
The FCA has broken investors down into six tribes:
Platforms and usage
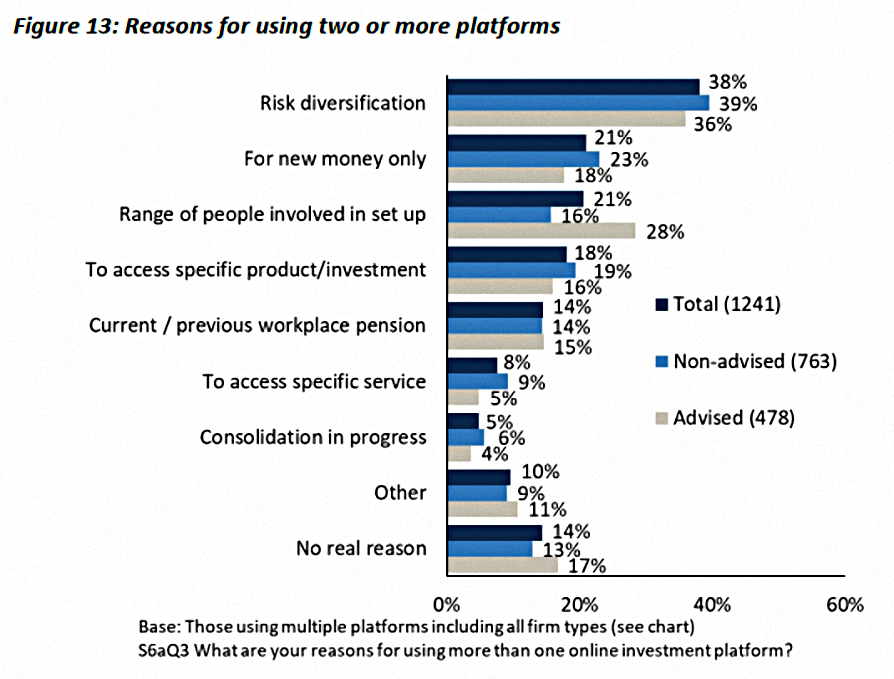
More than a third of investors (37%) use multiple platforms, a figure that I find very low.
- Also surprising is the use of one platform via an advisor and another on a DIY basis (14% of investors).
“Multi-homers” have higher incomes and more assets.
- They tend to direct new money to one in particular, rather than transferring money across.
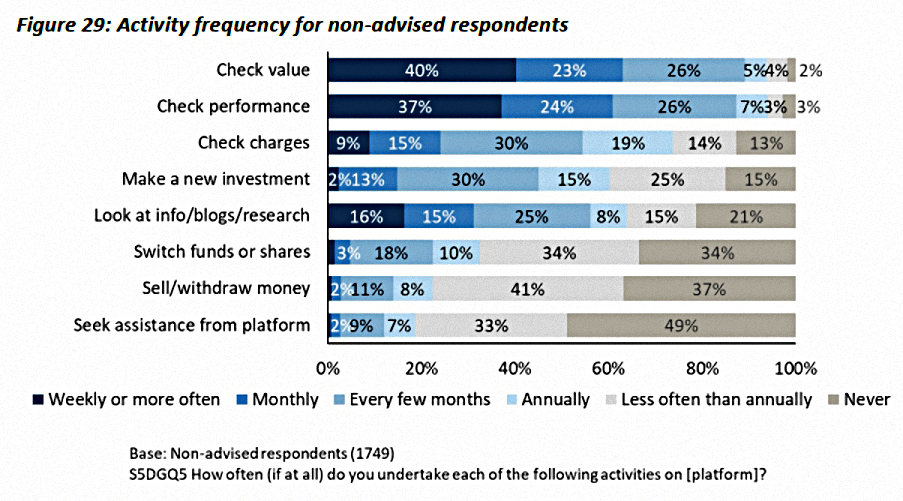
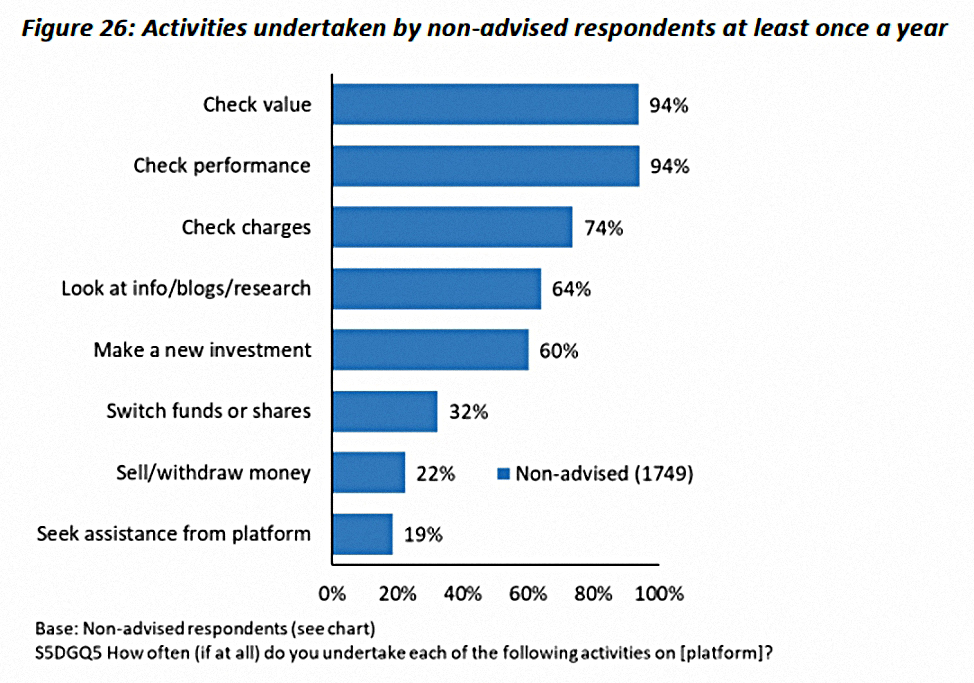
The key ongoing activity is checking the value and performance of investments.
- 42% of non-advised investors check at least weekly.
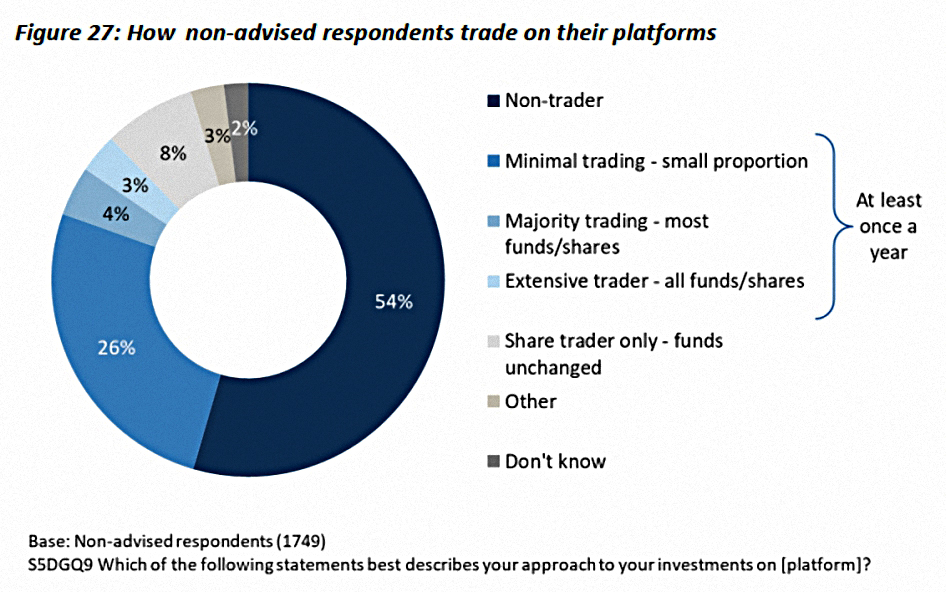
Trading is not common – 80% trade never or minimally.
Contributions
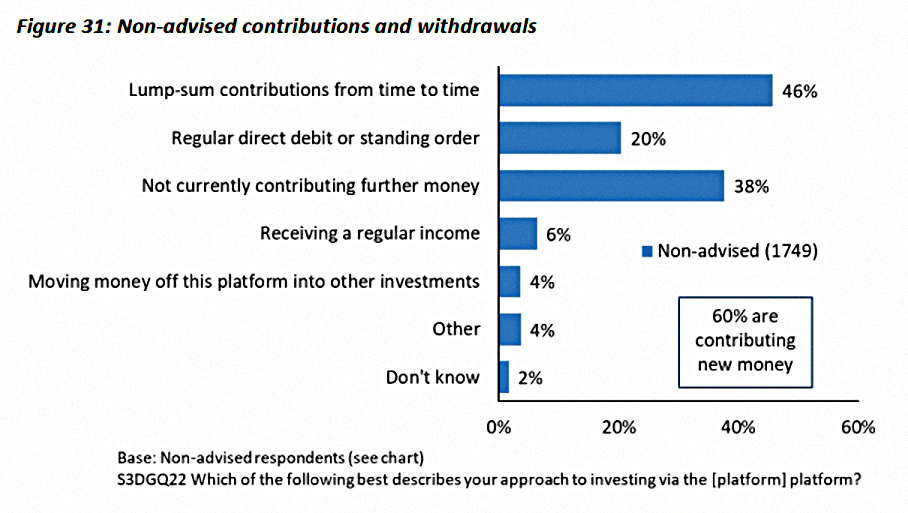
Non-advised investors mostly contributors, largely through lump sums but also through regular payments.
- Few are taking an income.
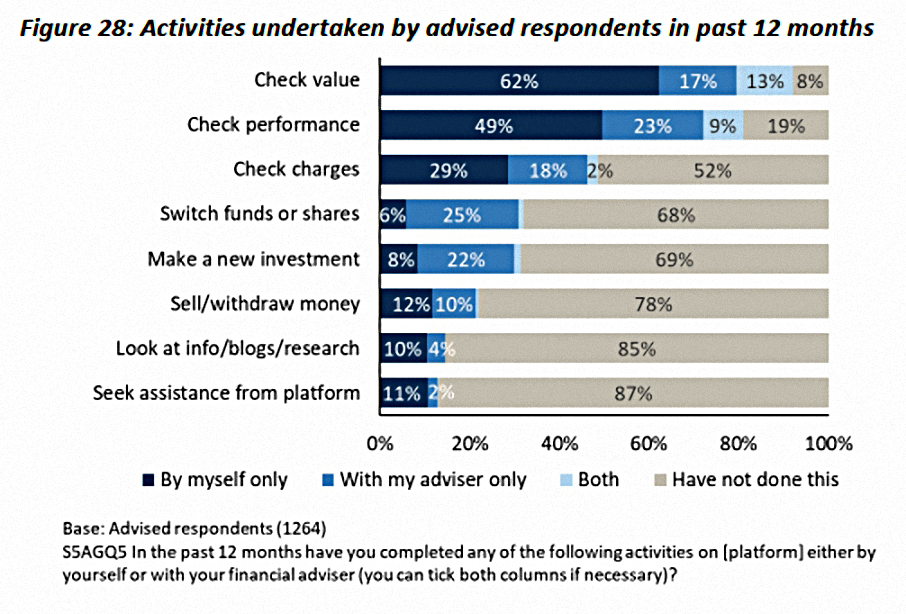
Advised investors are paying in less, most frequently via regular payments, and more are receiving an income.

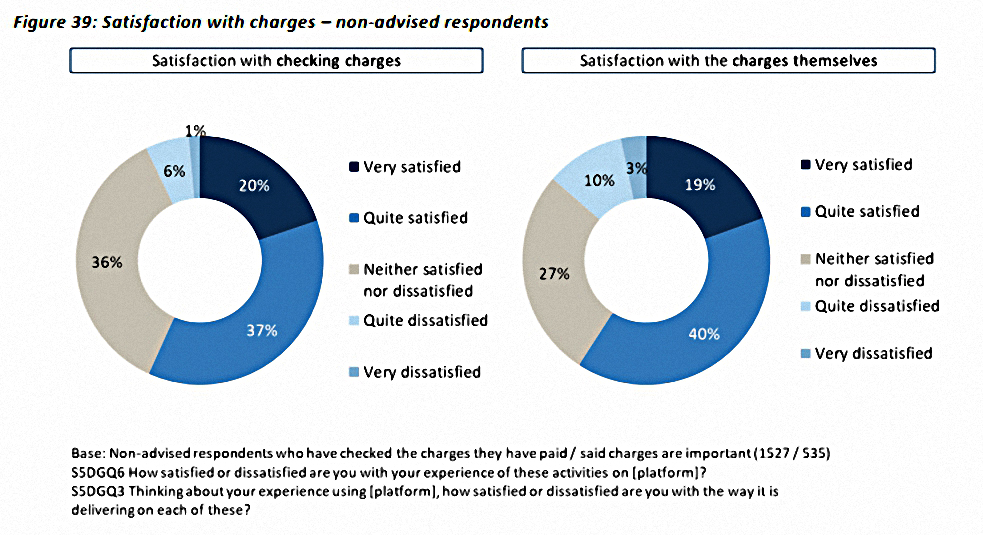
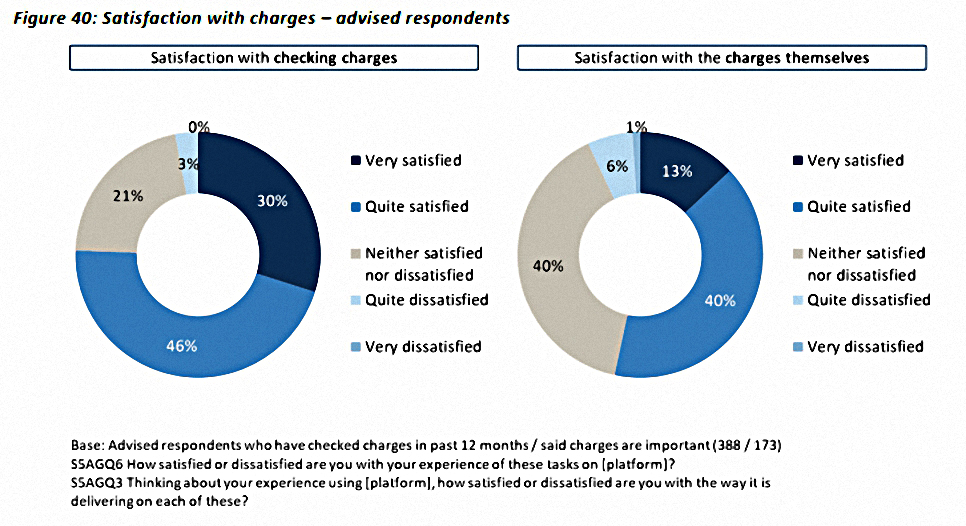
Charges

Understanding of charges is very variable.
- 33% say charges are important, but only 20% can say what they are.
- 19% don’t know if they are paying platform charges and another 10% believe they are not paying charges.

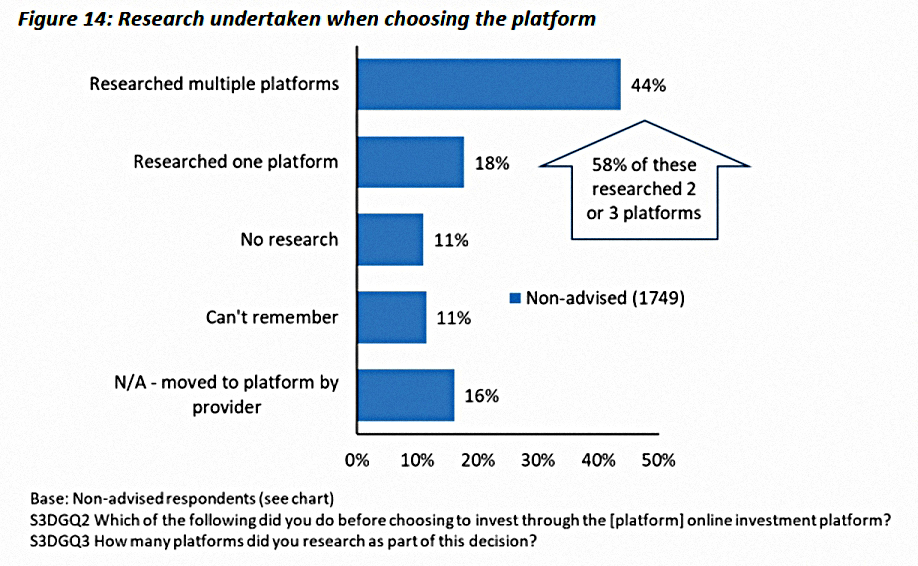
Choosing platforms

Less than half (44%) of investors research multiple platforms before choosing one.
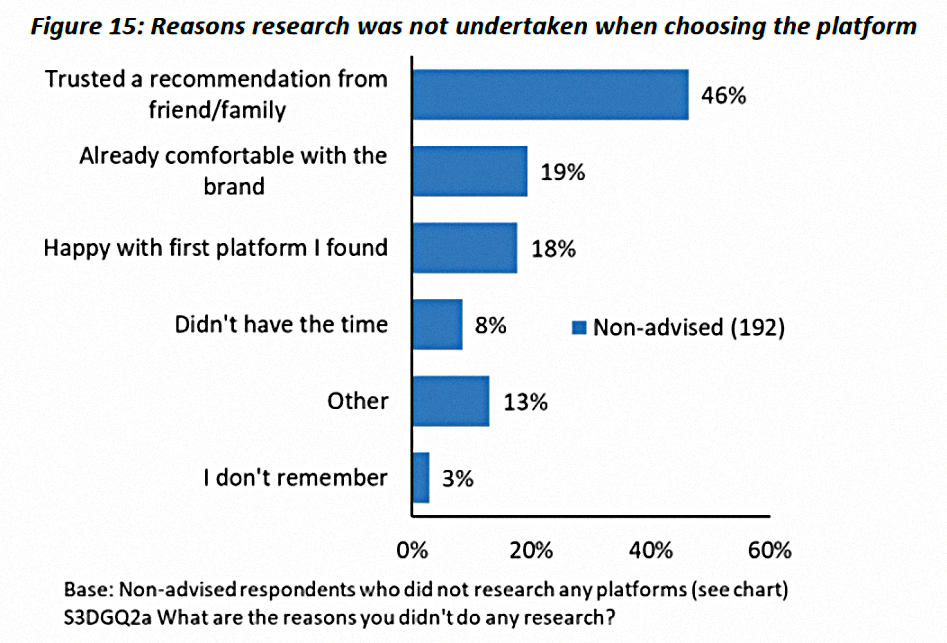
- Others simply use the first they look at or take advice from IFAs or friends.
- Branding and marketing are important here.
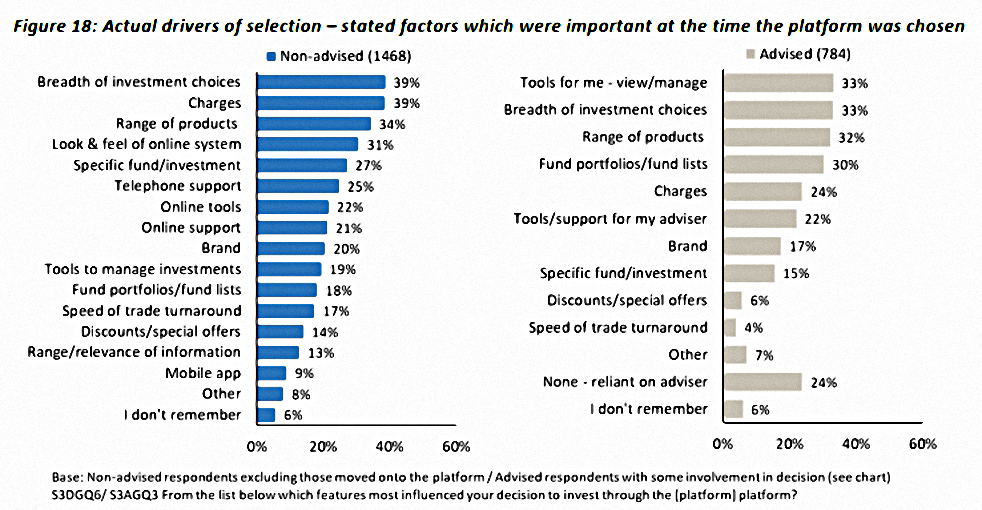
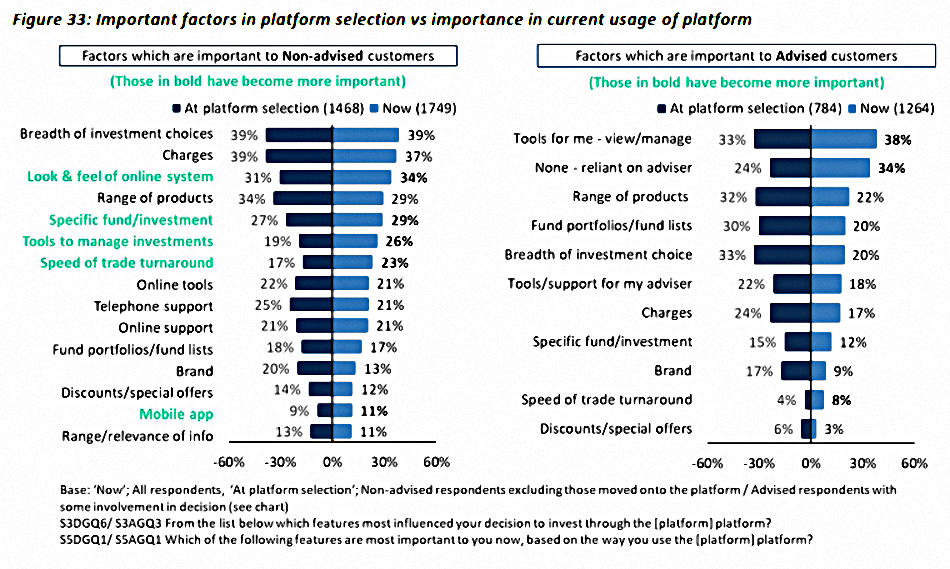
Non-advised investors choose on the basis of costs and available investment choice.
- Advised investors are also interested in choice, but also in the tools that allow them to monitor and manage their investments.
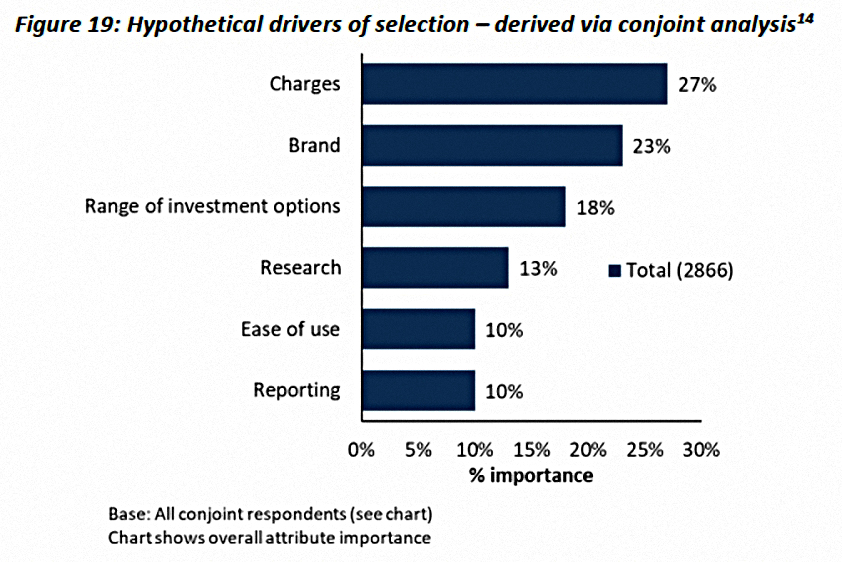
Conjoint analysis (( A survey technique in which respondents are asked to choose several times between hypothetical options to work out true drivers of choice )) suggested that brand is a larger influence than people think, and charges are less influential than investors believe.
Products
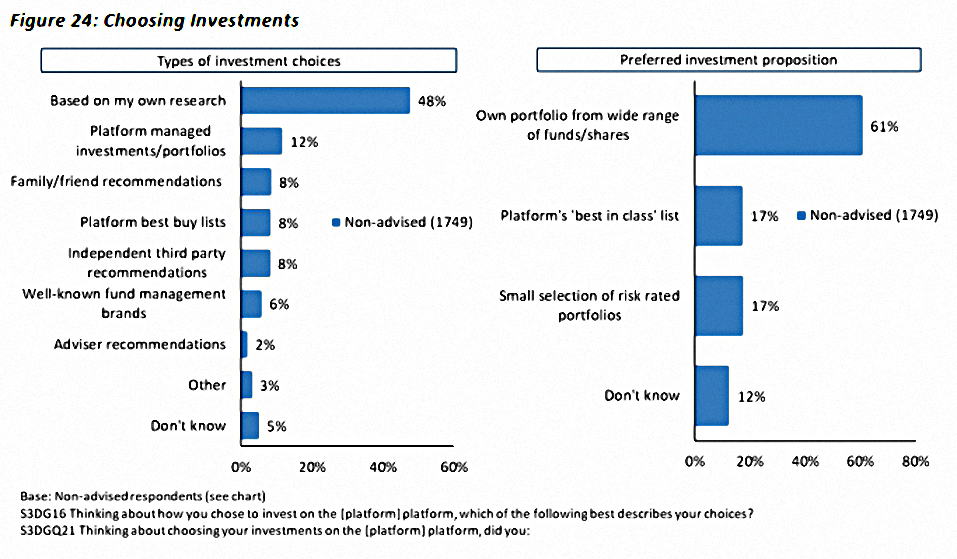
Non-advised investors tend to research and construct their own share portfolios.
- Advised investors rarely choose investments.

One-third of non-advised investors use model portfolios and/or fund lists.
- These tend to be the younger, less affluent and less experienced investors.
Satisfaction
Satisfaction levels are remarkably high.
- People feel that have greater control access and convenience than they used to.
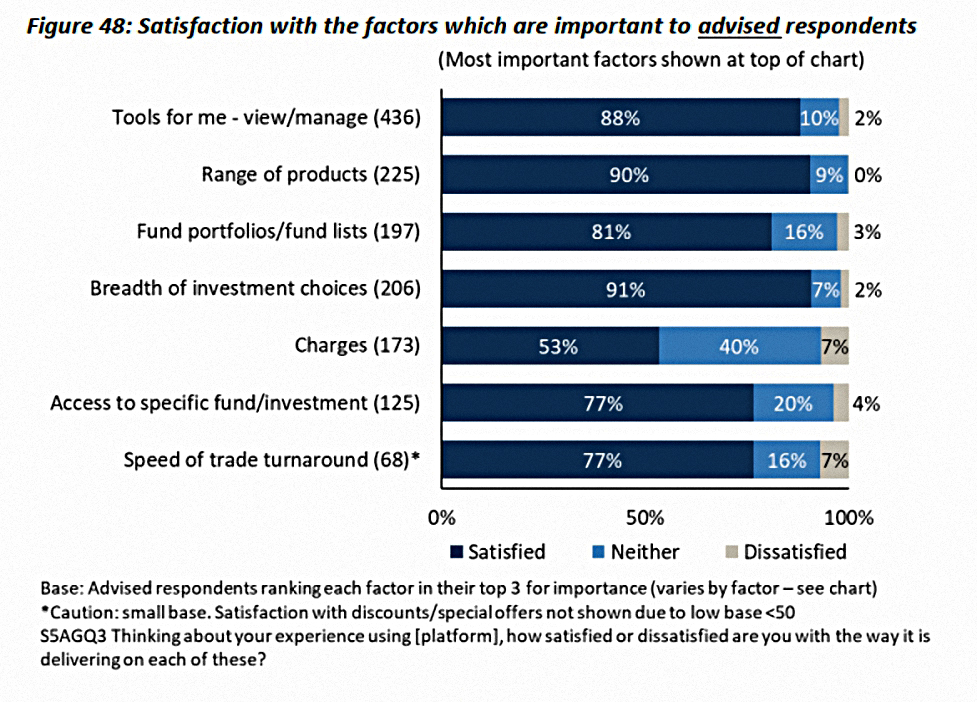
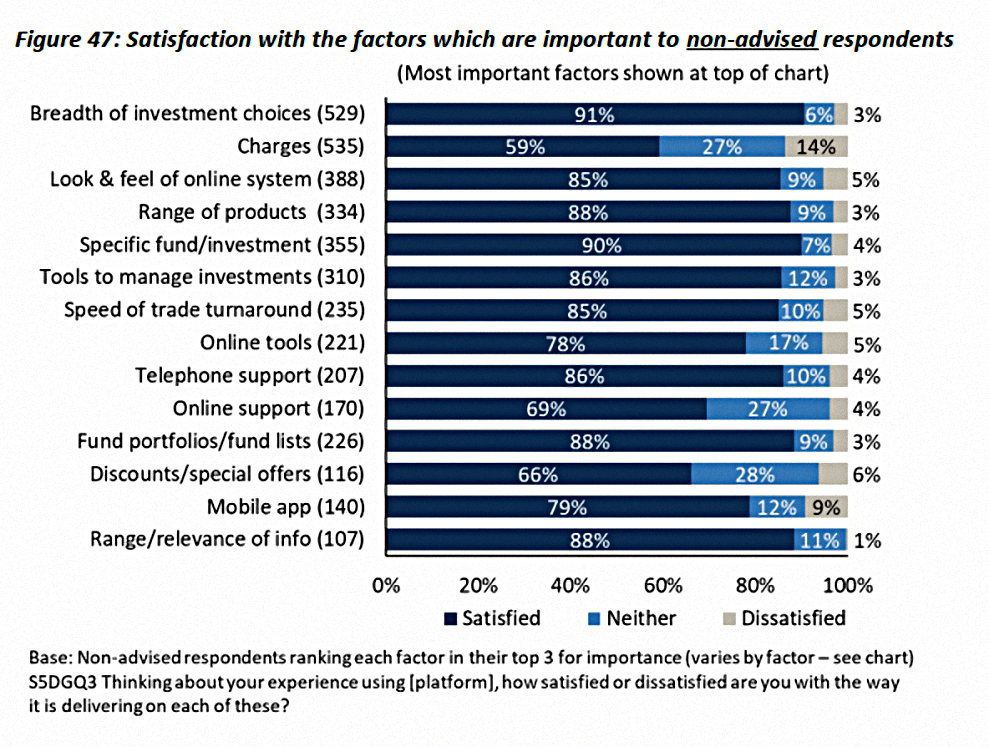
Investment choice is the highest rated factor (91% positive).
- Charges have the lowest rating (59% positive), though more people are neutral than negative.
Most people think they are getting value for money.
Note that since activity levels are generally low, most investors are happy about a limited range of features.
- Active and engaged investors are more likely to be dissatisfied.
Switching
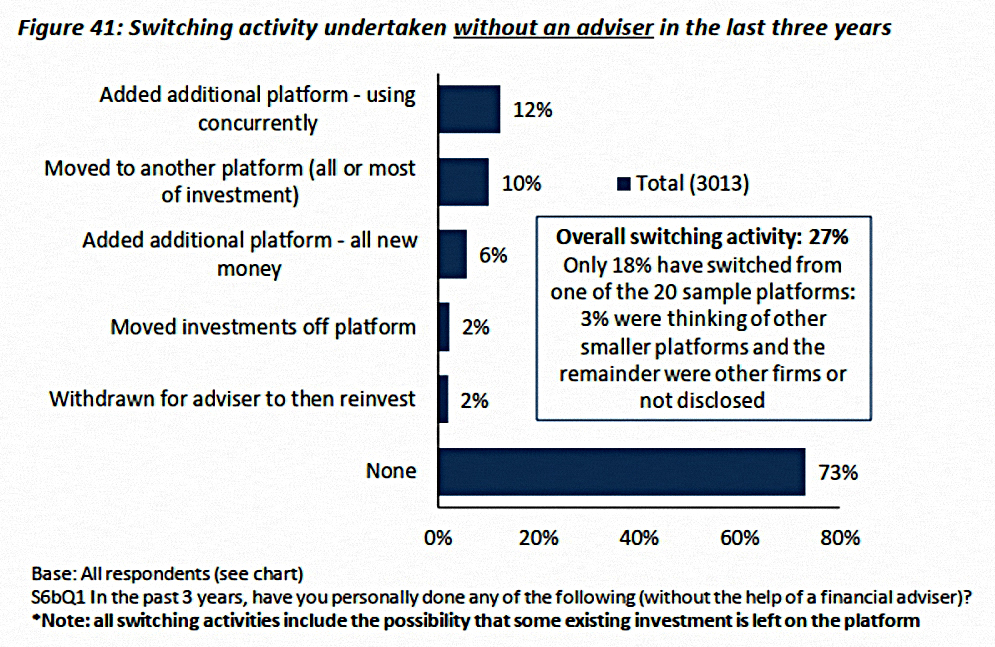
Only 10% of investors had switched platforms in the past three years (other than as directed by an advisor).
- Almost as many (7%) had tried to switch but failed/given up.

61% found switching easy and 11% found it difficult.
- 69% have not considered switching.

Low switching rates are partly because of high platform satisfaction, but also because of the time involved (including time out of the market), the complexity and exit fees.
- The most likely to switch are the engaged non-advised – for them, the key driver is lower charges.
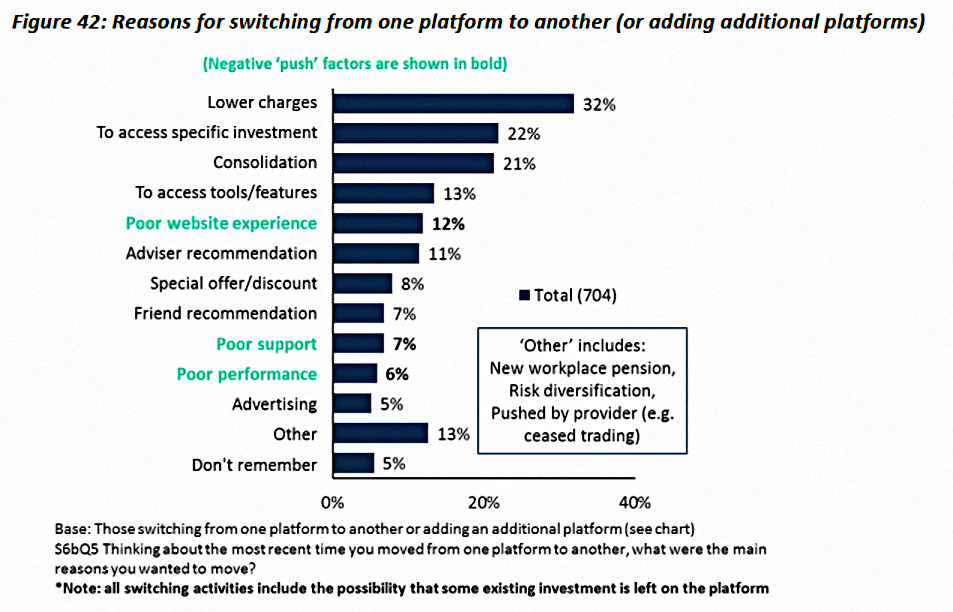
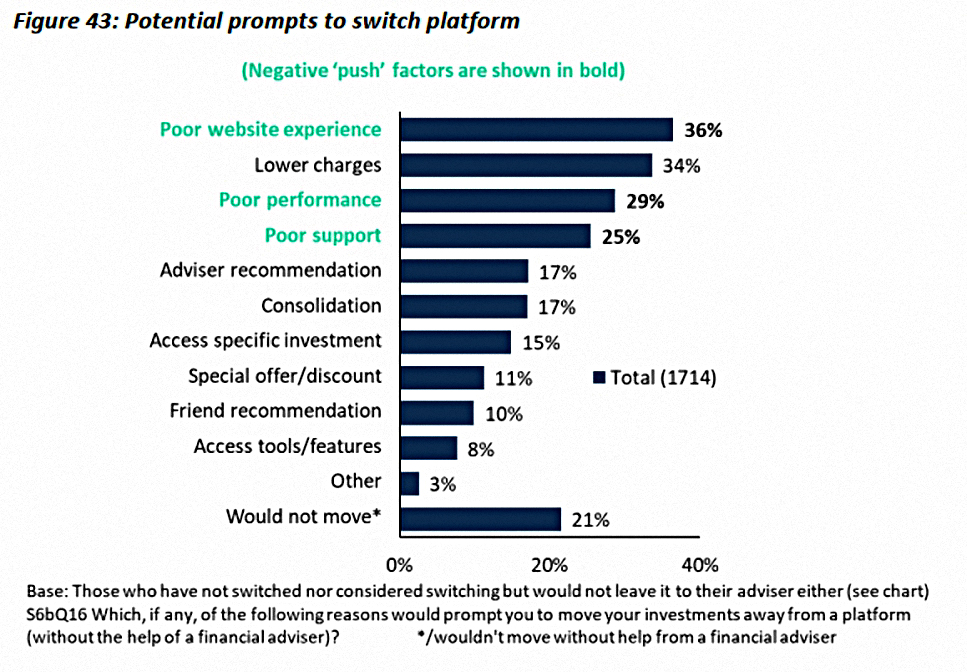
Negative experiences with a current platform are more likely to prompt a switch than are positive attributes of the future platform.
- But because of barriers to switching, problems need to be significant and sustained in order to trigger a switch.
Changes
Investors were also asked what they would change about platforms and the platform environment.
Here’s what they asked for:
- Increased visibility of charges – a personalised bill in pounds each year.
- More comparability of charges.
- Consistent pricing structures across platforms.
- A central source to compare platforms, and especially their charges.
- Faster transaction times – both trading and transfers.
- Simpler switching.
- More streamline user experiences and better apps.
- More information on fund performance.
- More clarity around the relationships between funds and platforms.
- Very topical in the light of the recent Woodford scandal.
Not a bad list to end on.
That’s it for today.
- Until next time.
Mike Rawson
Mike is the owner of 7 Circles, and a private investor living in London. He has been managing his own money for 40 years, with some success.