Interactive Investor on Pensions
Today’s post looks at a report from interactive investor on UK Pensions.
Show me my money
The report was published in April, and is called “Are you being kept in the dark?”
- The subtitle is “Show me my money 2022”, because there was a similar survey back in 2020 (which we didn’t cover here).
The focus of the report is the lack of investor engagement with pensions, as evidenced by a user survey.
- The survey of 2,000 people was carried out by Opinium between 26 and 29 November 2021,
Interactive Investor (II) feels that the industry lacks a commercial incentive to improve things:
The pensions world remains made up of large life companies, who have taken on more than 20 million workplace pensions from employers through auto-enrolment, and who might see no need to ‘shift the dial’, as there is very little movement between providers. Engagement might mean losing customers and revenue.
Moving pensions is also a hassle:
The difference between 1% and 0.5% charges may be thousands of pounds a year; but if moving that pension to another, lower cost provider is going to take 8 weeks and involve a lot of hassle – if it can happen at all, then perhaps you feel less inclined to make that switch.
Richard Wilson from II said:
Potential savings of over £100,000 over a working life, just by dialling up your risk appetite and finding a better value provider might seem like the stuff of dreams, but it’s one of the pension industry’s best kept secrets.
Two years ago, we called on life company pensions to up their game on transparency. But old habits die hard from an industry that has benefitted from pension blind spots for many years.
More and more people are switching from life companies to investment platforms such as interactive investor – they are the biggest source of transfers into the ii SIPP. But most people are still completely in the dark, and it can have a devastating impact on retirement outcomes.
Headlines
- Younger people know more about their pot size, fees and investment funds
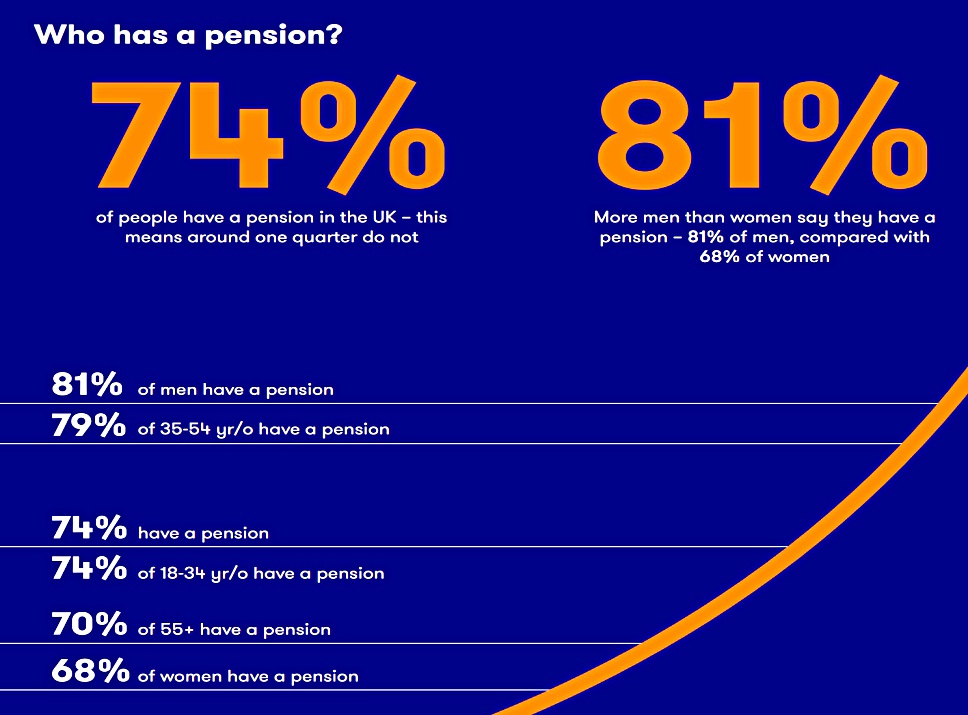
- 26% of people say they do not have a pension
- Almost half (48%) don’t know how much is in their pension
- The average pot size is £86,232.
- The average pot size for over 55s is £132,464.
- 2% of the over 55s (and 1% overall) have a pot bigger than £1M
- Around half (48%) know how much they contribute.
- The average monthly contribution is £240 (£3K pa).
- Men contribute £309 a month, women just £172
- 35 to 54-year olds contribute the most (£261 a month)
- Employee contributions (including tax relief) average 11.2%
- Most people contribute between 6% and 10%.
- Almost one in five said their employers did not contribute to their pensions
- 77% of people (and 90% of over 55s) don’t know what fee they pay
Who has a pension?
Most of the report is concerned with demographics – it looks at how responses to questions are broken down across age groups, gender and regions.
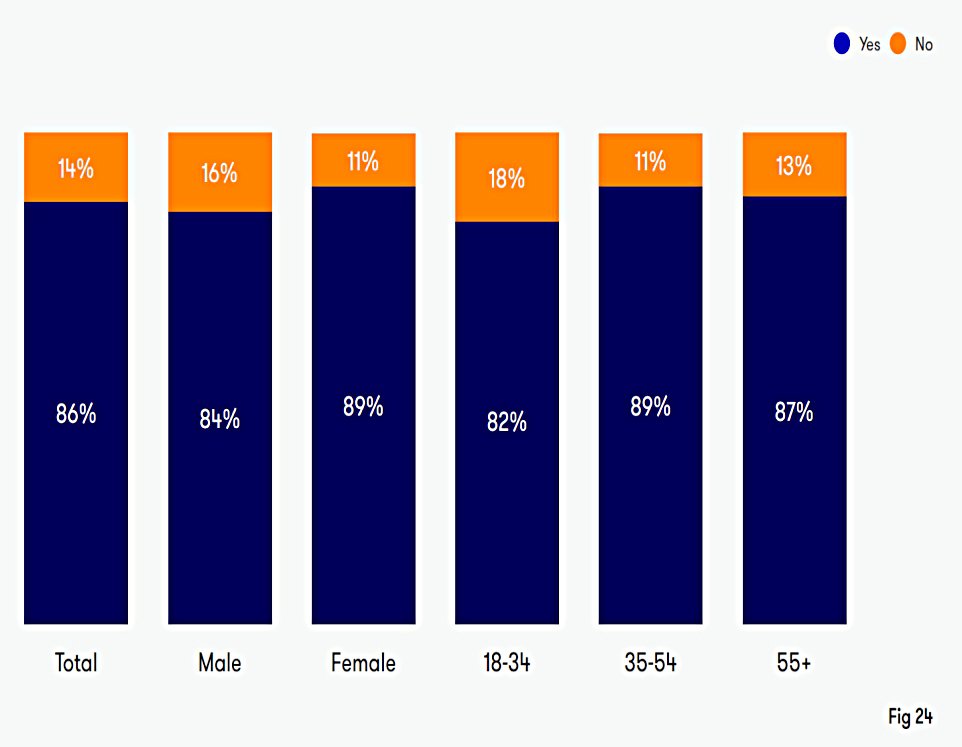
- The chart above looks at who has a pension.
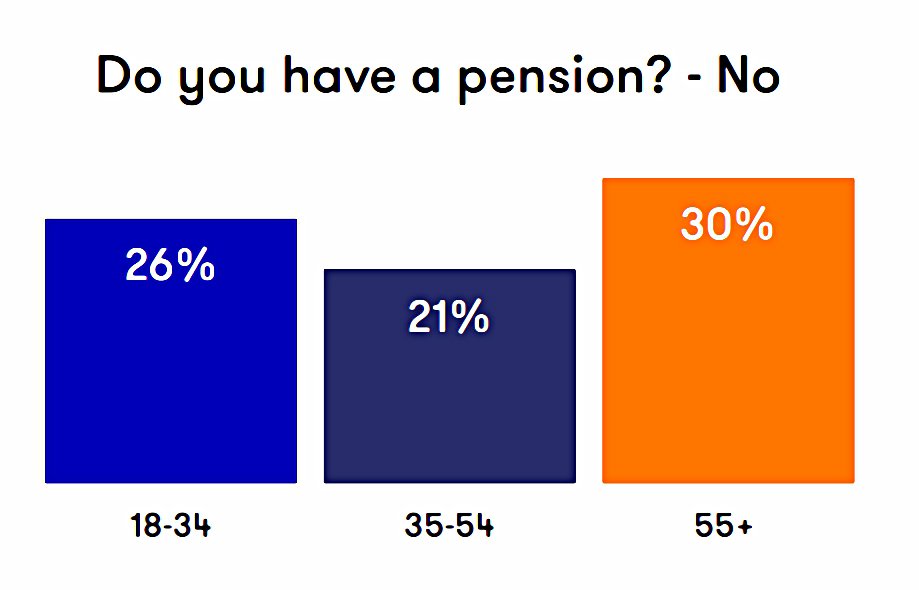
This one breaks out doesn’t, by age.
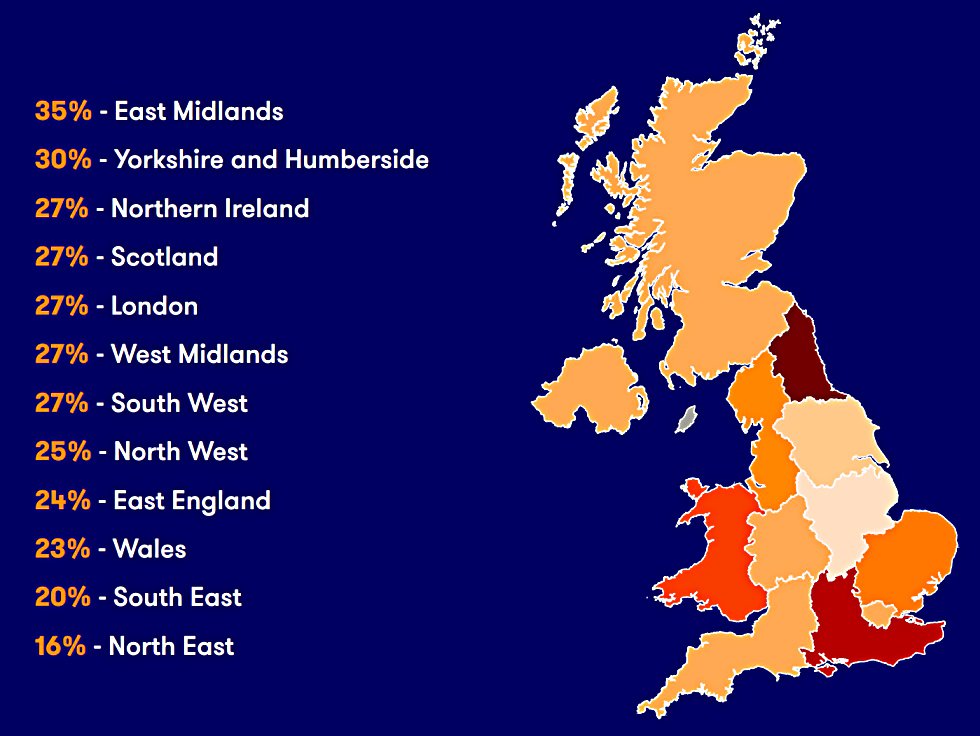
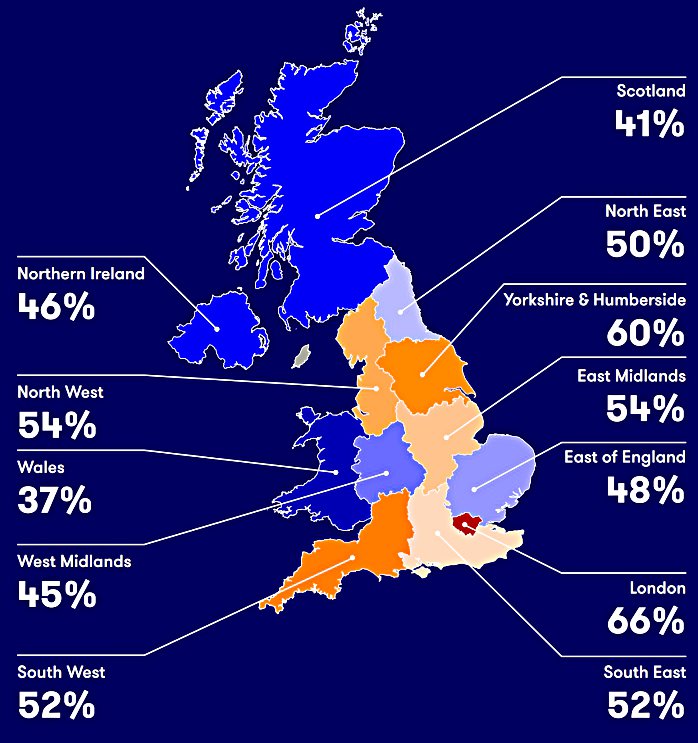
And this one breaks out the negative responses by region.
Pot size

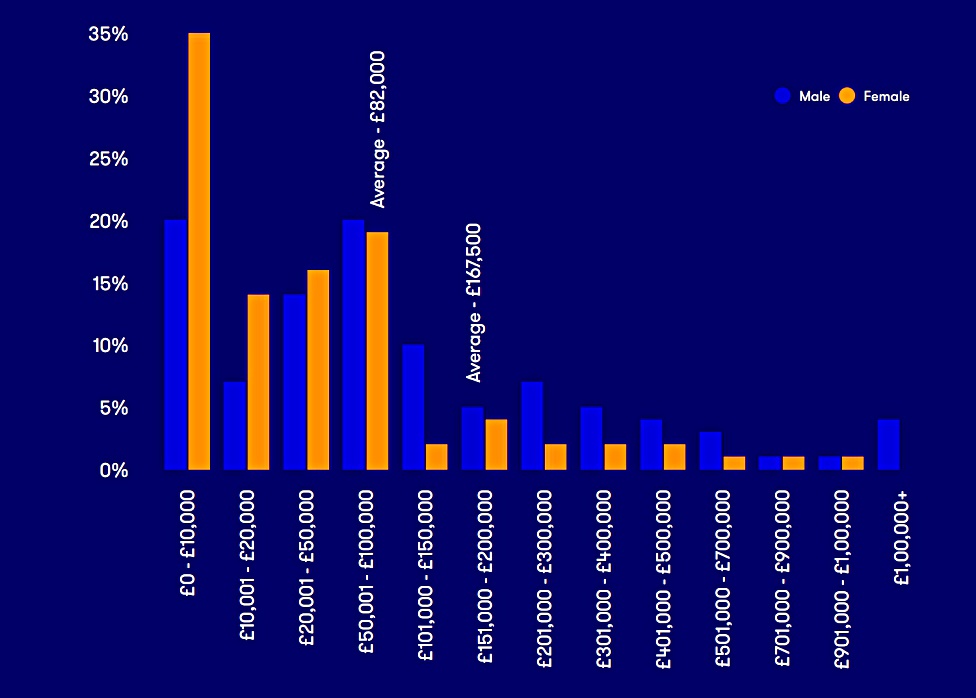
Next up is pot size, first by gender.
And then by age.
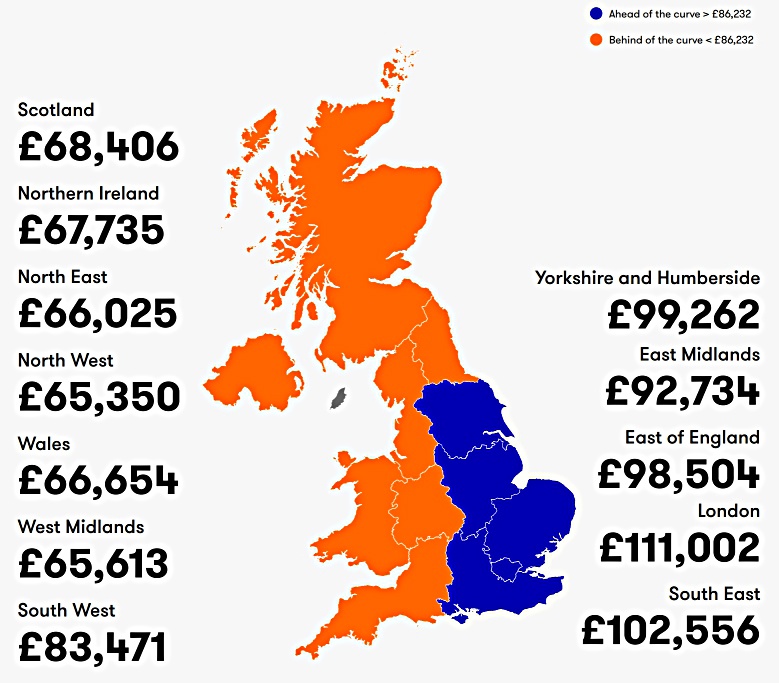
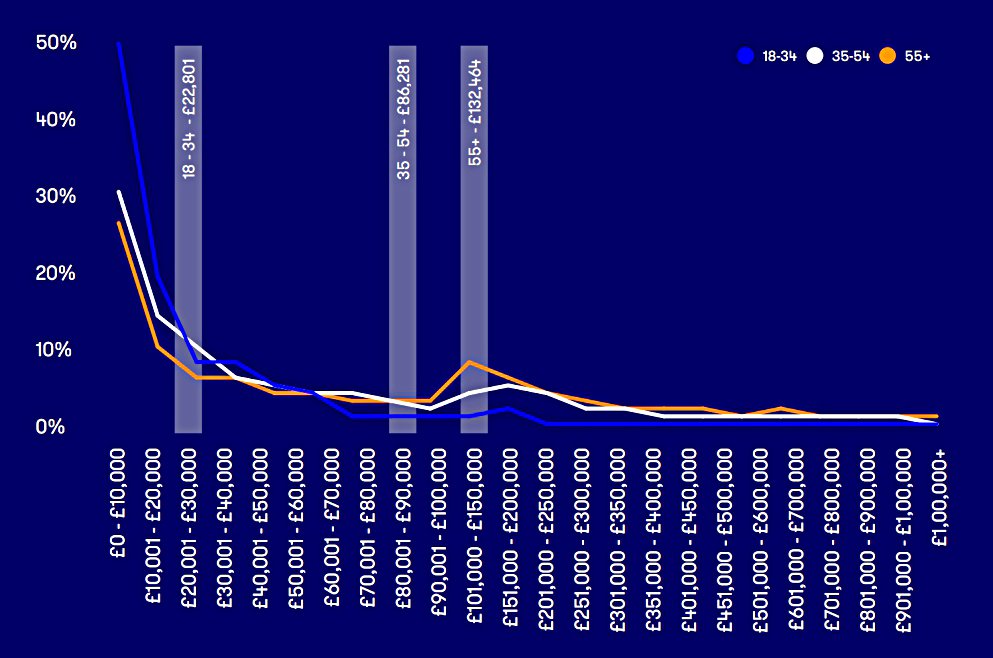
And then by region.
And finally by gender within the over-55 age group.
Knowledge
The third topic was how much knowledge people had about their pensions, starting with how much money was in them.
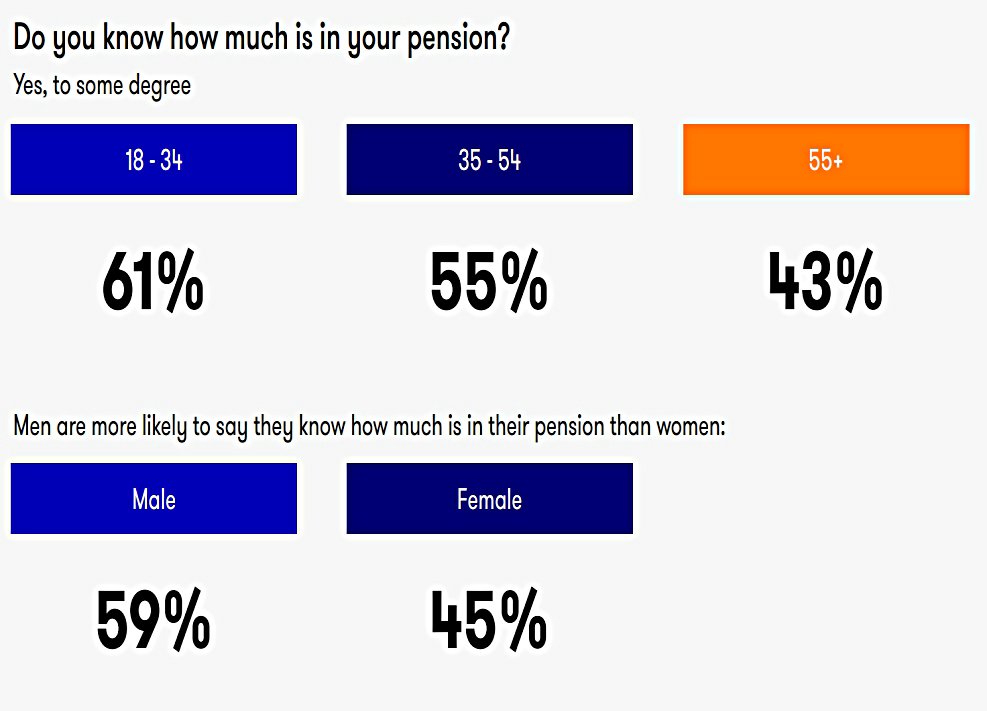
Here’s the breakdown by age and gender.
The survey also asked whether people knew the names of any of the funds that their pensions were invested in: (( Luckily they didn’t ask for the names of all the funds -this is not the easiest question for those of us with large and complicated pots ))
Other knowledge questions (with mostly depressing answers) included:
- Do you know what type of pension you have?
- What is your risk level?
- There were decent answers here, though most people were low risk.
- Do you know what fee you pay for your pension?
- Do you consider the fee you pay to be good value?
- Do you know what asset classes your pension is invested in?
- Do you know if part or all of your pension is invested in ESG funds?
- Do you know if your pension is in a fund that de-risks [a target date fund]?
- Have any changes been made to your pension during the last three years?
- How often do you check in on your pension?
- 54% had checked within the last year
Contribution levels

Here’s the contribution split by gender.
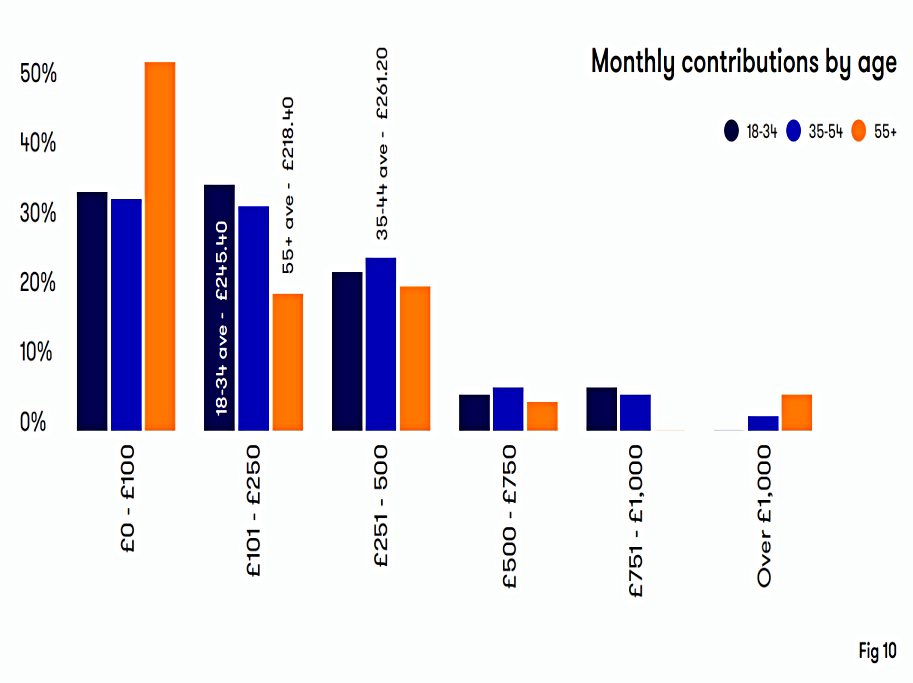
And here’s the same thing by age.
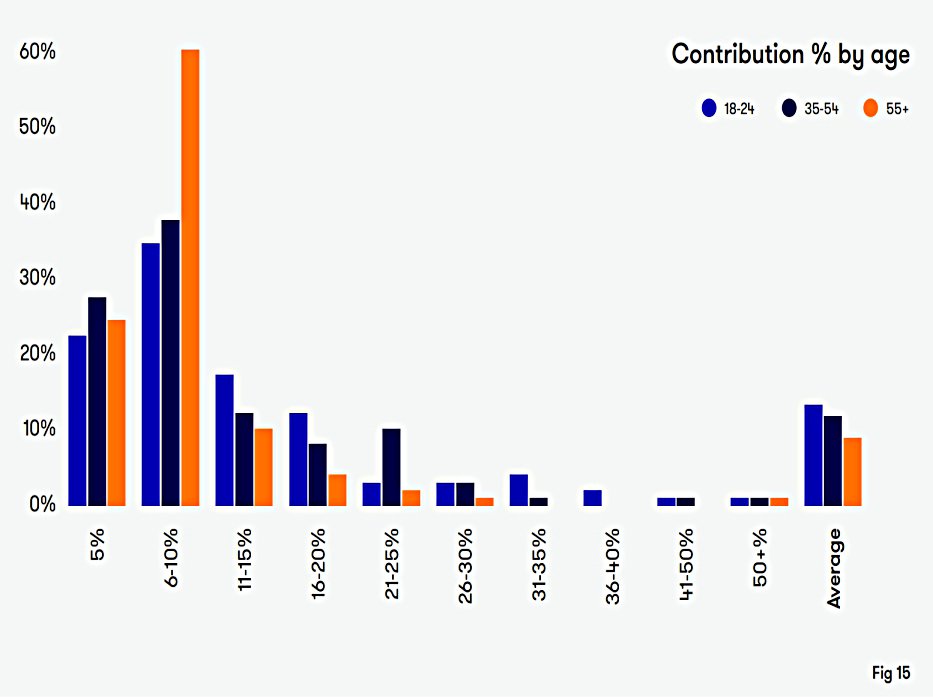
There are also charts showing contributions as a percentage of salary – first by age.
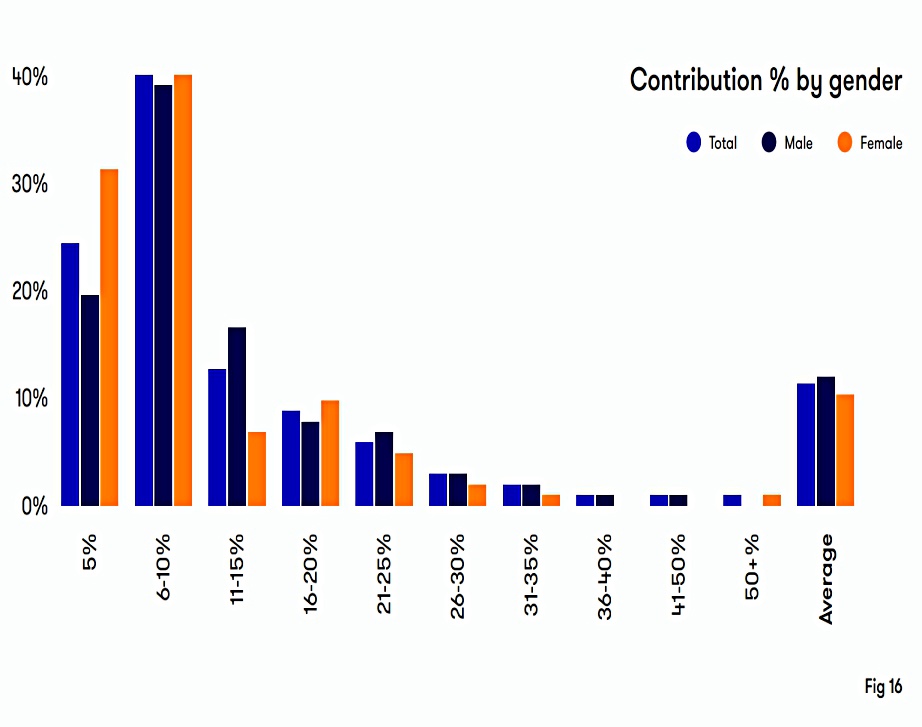
And then by gender.
Conclusions
This report is a missed opportunity.
- Pensions follow jobs, and so it’s no surprise to find that the same demographic drivers of jobs and careers (age, gender and location) drive pension pots.
The best-paying jobs are in London and the south-east, older people are paid more and have longer to build up their pots, and more women than men work part-time and/or take career breaks.
- It would have been more interesting to compare pension pot size against the size needed at various ages to be on track for the benchmark retirement incomes (“basic, moderate, comfortable”, or whatever the current names are).
Controlling for salary might have led to some interesting conclusions.
- Education level would be another interesting variable to track, as would public vs. private sector, and industry group.
II’s conclusions were around engagement and its impact on retirement outcomes.
The sum of this giant engagement gap over an adult lifetime of pension saving could add up to £118,800 in unnecessary fees and missed investment growth for someone on average salary, who makes 8% contributions for 45 years.
£8.5K of that comes from switching out of a pension charging 0.48% pa and into II’s offering with a monthly flat fee of £12.99.
- II are pretty competitive here, with only AJ Bell at £10 a month, and Fidelity’s £45 pa for a restricted investment list being cheaper.
The remaining £110K comes from switching out of a low-risk fund generating 2% real and into a high-risk fund generating 4% real.
- It’s hard to argue with these solutions, but it’s not clear how to get the average person to adopt them.
DIY pension geeks remain the minority.
- Until next time.
Mike Rawson
Mike is the owner of 7 Circles, and a private investor living in London. He has been managing his own money for 40 years, with some success.