Income Strategies – Measuring Retirement Success

Today’s post is about income strategies in retirement. How do you measure the best outcome? What is Retirement Success?
Contents
Michael Kitces

Michale Kitces runs a US financial blog called Nerd’s Eye View and has his own very successful website called Kitces.com.
- It’s aimed at financial planners, which is why it hasn’t featured here up to now.
A couple of weeks ago, Michael wrote about retirement income strategies and how to tell which ones are best.
- As always, please read the original article if you have time.
- If not, the main points – and the implications for UK private investors – are summarised below.
Decumulation strategies are a subject close to my heart for a couple of reasons:
- I’ve turned 55, so I am officially in the decumulation phase now ((Though to date I haven’t withdrawn any money ))
- Very few people in the UK write about them ((Abraham Okusanya is a notable exception, and we’ve featured his work here on several occasions ))
The UK system
The old story in the UK was that you hit retirement age, and your DC pension was converted in to an annuity.
- Back in the early 1990s, when interest rates were in the double digits and people didn’t live so long this worked fine
- But as life expectancy increased and interest rates dropped to zero, annuities became very poor value
In 2006, Gordon Brown relaxed the regulations so that you didn’t have to take an annuity until age 75.
- Because of the way the actuaries calculate their liabilities, annuities are much better value at that age.
- Until then you could draw a certain amount from your pot, and leave the remainder invested as you wished.
Then in 2015, George Osborne abolished the need to annuitise at all.
- Though it might still make sense at age 75 or older
Retirement Success
Michael’s post is about not just the many ways in which you can approach generating an income in retirement, but also that how you determine which strategy is best depends to a large extent on how you define “best” in the first place.
- So what does constitute retirement success?
Here are a few options, together with the kind of approach that will satisfy them:
- which produces the most (terminal) wealth?
- don’t spend too much and invest mostly for growth
- which supports the most spending in retirement?
- invest as aggressively as possible (which risks catastrophe)
So as with so many things in investment, it’s a trade-off.
- You need to decide what you want, look at the options that give you a good chance of getting it, and decide how much risk you can take, in case things won’t work out the way you want.
Retirement options
Michael looks at a 65-year-old couple planning a 30-year retirement on a $1M portfolio.
He compares three options:
- spend $30K pa (indexed), with 90% used to buy an annuity and 10% as a cash reserve
- spend $45K pa (indexed) by investing 50/50 in stocks and bonds
- spend $60K pa (indexed) by investing 100% in stocks
You’ll note that options B and C target withdrawal rates of 4.5% and 6% pa, which we know are not “safe”.
- The results can be instructive nonetheless.
Terminal Wealth
Note that I’m using terminal here to mean the end of the 30-year retirement time period that the couple have planned for, rather than death (which we’ll consider later).
Michael has made the following assumptions in calculating this:
- inflation averages 3% pa
- cash returns 3% pa
- bond return 5% pa
- stocks return 10% pa
These are common enough assumptions, though I struggle to see bond and stock returns as high as this from our current starting point.
- I suppose anything is possible over 30 years, so let’s go with it.
The annuity is assumed to refund the principal on death, subtracting payments as they are made.
- this explains the graceful decline of option A, which is an acceptable visualisation of remaining / expected value

Despite option C having the greatest annual spend, it still returns the most money at the end of the period.
- this is because stocks have a real return of 7% pa and the strategy only spends 6% pa
- lower actual returns would require spending to be trimmed
Cumulative Spending
“Most money left over at the end” is not the way most people want to look at retirement.
- The best way to win that battle would be to spend nothing at all.
Nobody wants to run out of funds, but at the same time, people would like to enjoy themselves as much as possible.
- So let’s look at money spent during retirement.

Option C wins here again – we’re spending $60K per year, rather than $45K or $30K.
Probability of success
So far the modelling has used average returns each year, which is not realistic.
Michael performed a Monte Carlo analysis by running thousands of randomised sequences of returns.
- The goal was to see which options had money left over at the end (success) and which ran out of money before 30 years (failure).
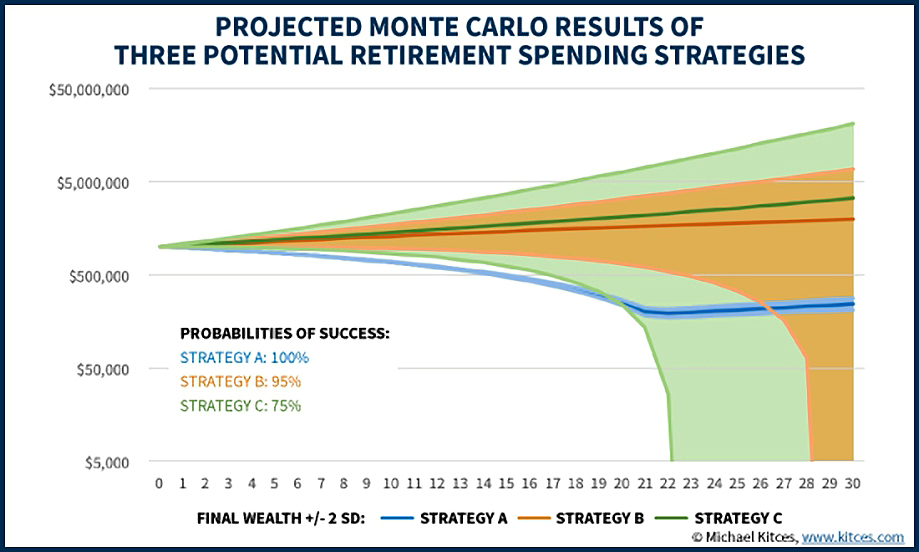
Here we find the opposite result:
- option A is 100% successful
- option B is 95% successful
- option C is 75% successful
The less than 100% scores from options B and C reflect their high withdrawal rates – 4.5% and 6% pa respectively.
- Note that option C still produces the highest average values, it just has the greatest variability and so it also has the most failures, starting from 22 years in.
The “4% rule” came from a study designed to calculate safe withdrawal rates (SWRs) from retirement portfolios.
- 4% was found to generally last 30 years ((With a 95% success rate, I think ))
- in fact, with today’s equity and bond valuations, 3% pa is probably a safer starting point
Few retirees would spend more than 4% of their pot until they were well past 65 years old, and many would spend less.
- So the possibility of running out of cash after 22 years is a severe problem, but one created by choosing such high withdrawal rates.
Adjusted Spending
Michael himself shows that if spending on option B is reduced from $45K to $40K pa, it’s success rate rises to 99%+.
- And it would still be spending an extra 33% on top of option A
Since the original $45K pa spending on option B only produced failures from 28 years out, spending would probably only need to be reduced towards the end of retirement.

Life expectancy makes a difference, too.
- 65-year-old couple (in the US) have a 70% chance of both being dead by 93
- so the real failure risk of option B is not 5% but 5% of 30%, which is 1.5%
Michael remains convinced that option C is a bad strategy on this dimension, but it seems clear to me that spending could be reduced back towards $30K pa (3% withdrawal rate) to make the failure rate hit whatever target was required.
- it may be that spending has to be reduced by a third, but from a much higher level (double that of option A, in fact)
- spending would still remain above option A, and probably above option B
Utility Functions and Risk Aversion
Next Michael looked at utility functions and risk aversion.
Some people are just not comfortable with any risk, and even for those that are, a penny lost does not equal a penny gained (as it should for those rational people who economists are so fond of).
- As Nobel Prize winners Kahneman and Tversky showed, people feel more pain for losses than the pleasure they feel for gains
- The pleasure from gains diminishes with each extra £
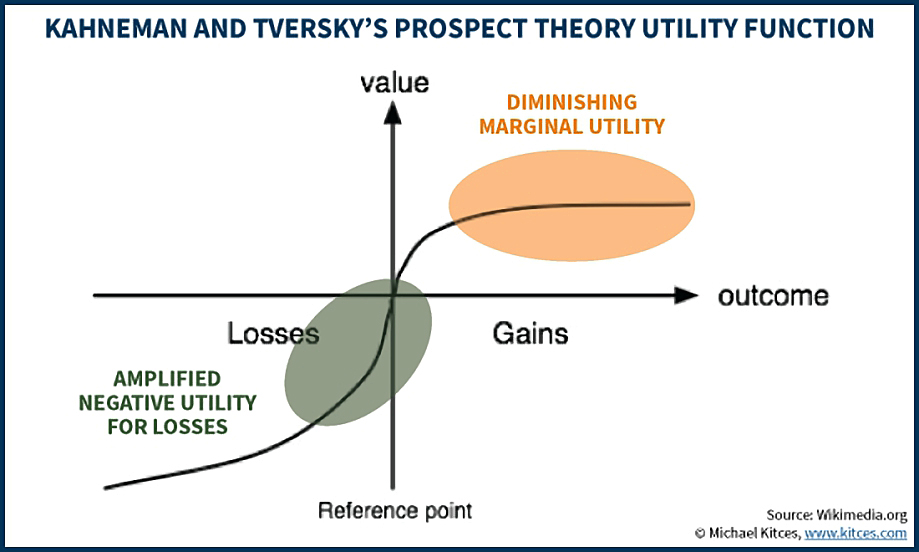
“Utility” follows an S-curve, albeit one slightly skewed to the negative
- A rational utility line would be straight diagonal from bottom left to top right
On the other hand, the risk tolerance of some will mean the possibility of severe cuts to the (high) spending of option C will not be enough to detract from the potentially improved lifestyle that option offers.
To work out which option is best for you, you would need to plot your own utility function.
- To make this concept easier to understand, think of utility as the “usefulness” of £1, or £1,000.
The hypothetical £££ generated by options A, B and C on the Monte Carlo analysis could then be mapped through the utility function to convert £££ to the hypothetical currency of “utils”.
- Think of the utility curve as an exchange rate for terminal wealth or cumulative spending
- The exchange rate varies according to the size of the pot, and the utility function maps the exchange rate
- The exchange rate is high as we move from gains into losses
- It is very low as substantial gains increase further (diminishing returns)
In practice, you won’t need to go this far.
- you should be able to tell from your gut reaction whether the prospect of a good lifestyle with possible spending cuts to come as you age is more attractive that a lesser but probably constant lifestyle
Ranking the strategies
Michael ranks the three strategies across five dimensions:
- terminal wealth
- spending in retirement
- probability of success
- magnitude of failure / required adjustment
- utility (high / medium / low risk aversion)
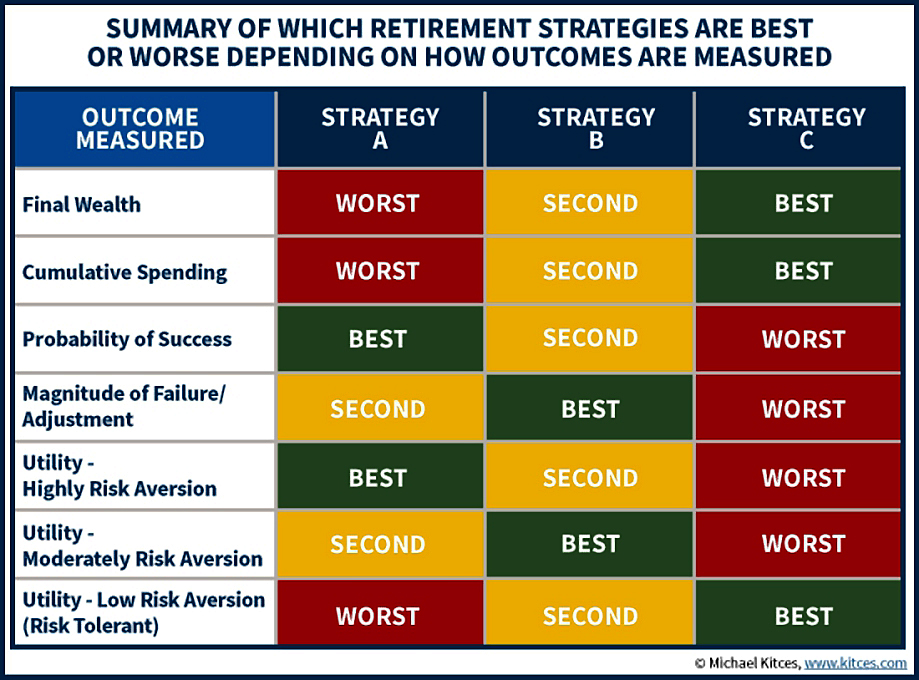
The terminal wealth result is surprising but not controversial:
- high spending and investing in equities (option C) produces the most money
The cumulative spending result is entirely predictable:
- option C spends the most per year, and over 30 years
The probability of success result is as expected, but misleading:
- options B and C fail because their withdrawal rates (4.5% and 6%) are not safe
- option C in particular could require significant cutbacks in later years, but not to the spending levels of option A
The utility result is as expected:
- risk averse people will prefer option A
- risk tolerant people will prefer option C
- there may be some people in the middle who prefer option B
Conclusions
Choosing different withdrawal rates for the three options has produced an illuminating examination of income generation in retirement, but one that risks being misleading.
- Investing in equities is risky, but the returns from an annuity are currently so low that it’s unlikely to ever be a better strategy in practice.
Option C clearly appeals the most, so I must be risk-tolerant, even though I feel risk averse.
- I feel sorry for the truly risk-averse who are drawn to option A
- These must be the same people who take out a cash ISA every year
- When they hit 65 they will be surprised to learn they are still not rich
My own retirement strategy is to invest the vast majority of my non-property wealth in equities, but to keep a cash buffer of around five years living expenses.
- This should mean that I don’t need to sell equities during a bear market
- I will target an initial withdrawal rate of 3%, and adjust as retirement progresses
- I hope this means I will never have to reduce spending
- When my faculties start to fail (hopefully after age 75) I will switch some of the equities into an annuity
I commend this strategy for your consideration.
Until next time.
Mike Rawson
Mike is the owner of 7 Circles, and a private investor living in London. He has been managing his own money for 40 years, with some success.


“These must be the same people who take out a cash ISA every year”
Can you explain this comment please?
Using cash is a bad way of saving for retirement, and buying an annuity is a bad way of providing income in retirement.
They both appeal to the same kind of person – the very risk-averse.
Hi Mike I’ve a question regarding organising finances in retirement but first I wanted to congratulate you on the best UK personal finance site I’ve come across and I’ve looked at alot. Unfortunately I only came across your website recently after having done much of the heavy spadework myself. However it was reassuring to get confirmation on some fundamental hygiene points rarely expressed elsewhere eg
– US has been fundamentally overvalued for the past decade (now common knowledge) – this has ruled out Global equity funds which are ~60% US
– Bonds have/are reaching the end of a 35-40 year bull market – so are not the low risk asset advisors would have you believe. (30 years retirement inflation risk plus capital erosion in a rising interest rate world).
– an sensible diversification strategy is key but as with all risk management strategies – there is a cost. Also increasing correlation of equity markets makes geographic diversification less effective.
My approach has largely been structured around equities and a cash emergency fund. The point I wanted to raise concerns how to structure funds on approaching retirement. I am fortunate to have a Defined Benefit Pension (main retirement income) but also an ISA portfolio and a Defined Contribution Pension. The ISA portfolio has to date been structured for growth and I have recently taken control of the DC Pension via a SIPP. My initial reaction was to structure the SIPP for income and to allow the ISAs to continue to generate growth.
However on reflection (and looking at the tax implications). It seems to me that the reverse is appropriate. Income generated by ISAs are tax free whereas the SIPPs are subject to normal income tax (after the 25% tax-free lump sum is taken).
I am surprised that what seems fairly obvious (in UK context) does not appear to be widely discussed in retirement planning forums. Or am I misunderstanding something fundamental here. Any observations greatly received and I have to say 1 last time – great website – wish I had found it sooner.
Kind Regards
David
Hi David,
Thanks for the kind words. Please tell all your friends so that they don’t wander in the wilderness like you did.
Your question is really the kind of thing that I handle via my coaching service (Financial Coaching) but the short answer is that I don’t invest for income, I just sell some investments each year to create cash I can withdraw. The search for yield can lead you astray, I think.
The tax situation on SIPPs is often exaggerated, since you get the first 25% tax-free. So you can take out £60K a year and only pay £6.3K in tax.
I’m more worried that SIPP rules will change before I get my money out, so I’m sticking with UFPLS and not touching my ISAs (I actually add to them each year).
Hope that helps,
Mike
Thanks Mike and yes I will (and already do) recommend your website to friends. Understand your point that my question is more appropriate for a coaching session… rather than a short email reply (which can be mis-interpreted. Also understand your point around pension legislation and the desire to mitigate this. I suspect we come at this from opposites of the spectrum – small v large DC pots to manage – so my risk here is much less of a concern. Thanks again for your kind reply – I don’t know how you do it all !
Regards
David