Quality Shares 2 – Cash Flow
Today’s post is our second visit to How to Pick Quality Shares by Phil Oakley. Today we’re looking at cash flow.
Cash flow

According to Phil, the cash flow statement is
The most revealing item of financial information that a company gives investors – it shows you where cash comes in and goes out of a company.
Investors can use it to spot aggressive accounting by comparing profits with cash flows.
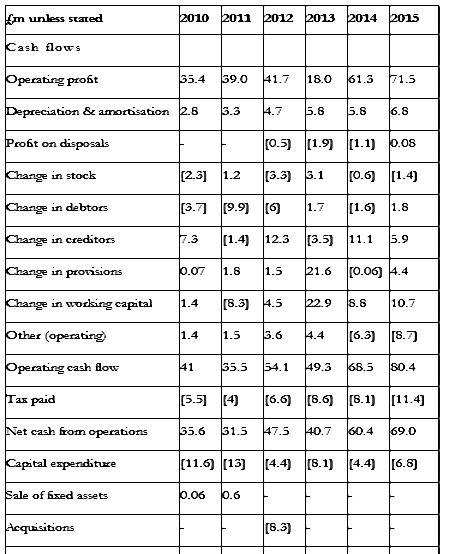
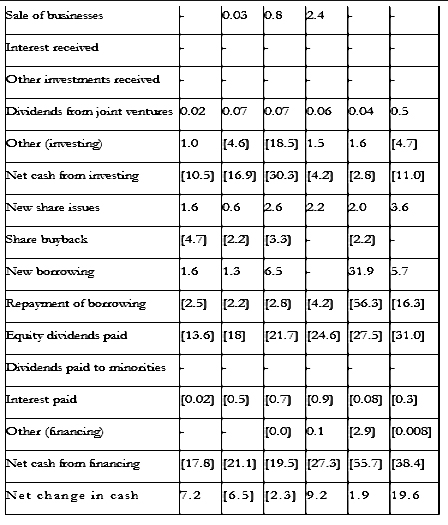
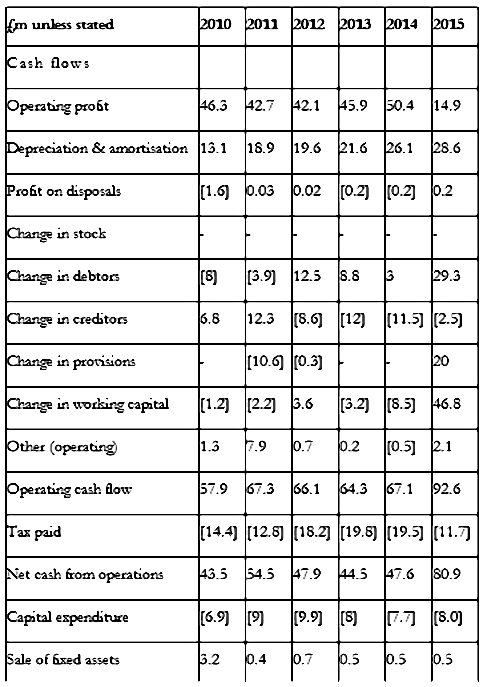
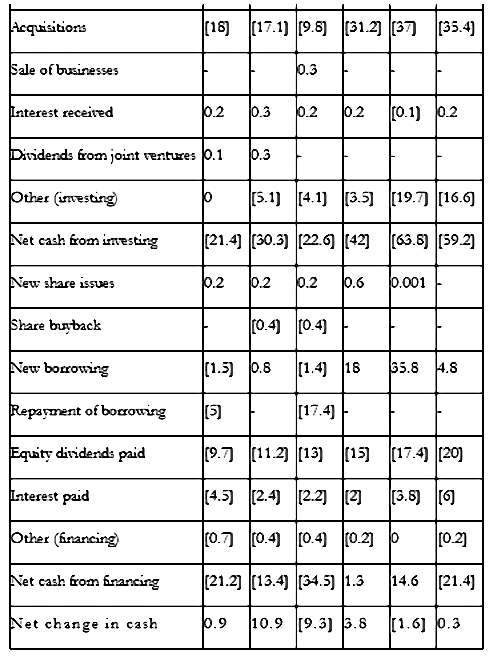
Here is the cash flow statement from Domino’s:
Cash flow vs profit
Phil reminds us that there have been lots of companies that appeared profitable, but were in trouble because they couldn’t turn their profits into cash.
Globo is a recent high-profile example from the UK:
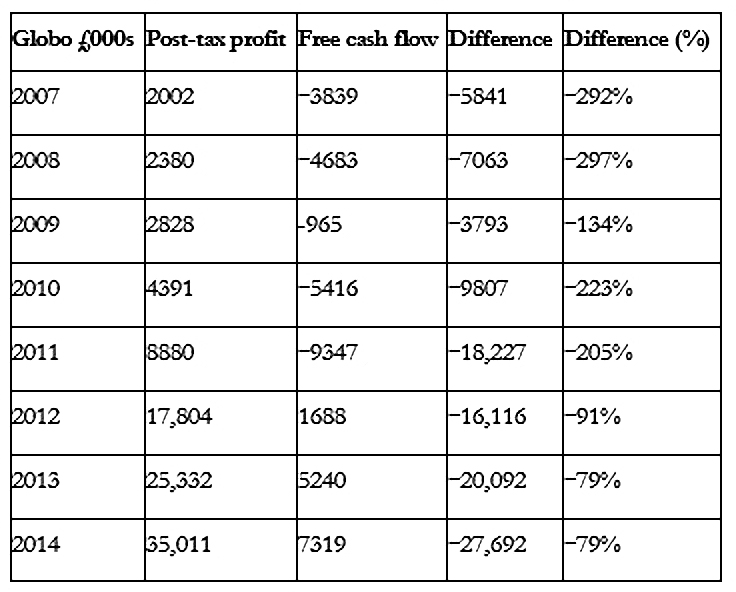
Profits were rising, but free cash flow was not.
- Globo turned out to be an accounting fraud and it went bankrupt in 2015.
Profits use the accruals, or matching, process within accounting – income and costs are matched within a period (month or year).
- They aren’t based on the actual flows of cash into and out of the firm.
- Bills can be paid in cash at the time of purchase, or they might be paid 30 or more days later.
- There can also be pre-payments, for things like electricity, or equipment rented on an annual basis.
Phil highlights three key sources of difference:
- Depreciation
- Assets that last for more than a year are gradually written off against the profits they help to produce during their usable lifetime.
- But the cash to buy the asset went out of the door in year 1.
- Sales on credit
- Purchases on credit (supplies to the firm)
Free cash flow
Free cash flow (FCF) is the money left over after a company has paid for everything that it can’t avoid:
- Debt interest
- Its tax bill
- Maintenance & replacement of assets (capex)
What can a company do with its FCF?
It can:
- Pay dividends
- Buy back its shares
- Repay debt
- Acquire other companies
All of these can improve returns to shareholders, which is why FCF is so important.
Calculating free cash flow
There are two versions of free cash flow:
- Free cash flow to the firm – FCFF
- Free cash flow for shareholders (or for equity) – FCF.
Net cash flow from operations = cash flow from operating activities + dividends from joint ventures - tax
FCFF = Net cash flow from operations - capex

FCF = FCFF - net interest (interest received less interest paid) - preference share dividends - dividends to minority shareholders
Here are the calculations for Domino’s.
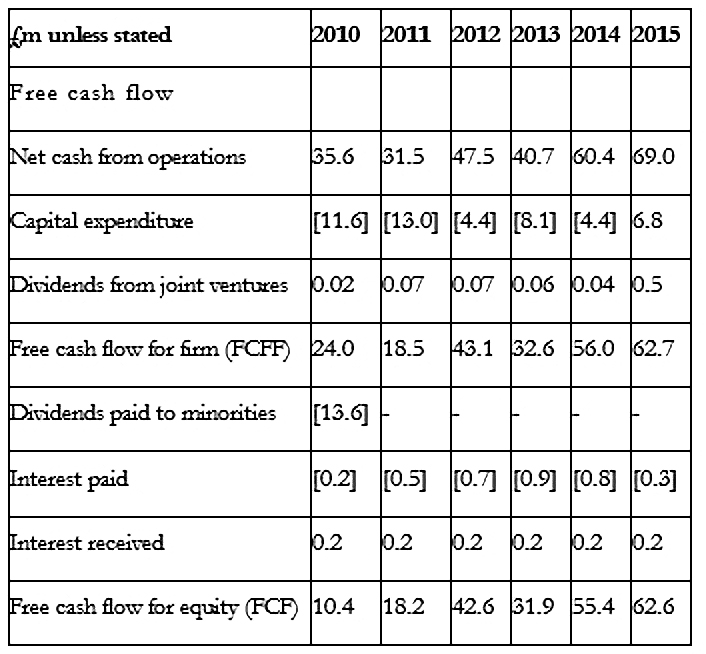
As an example, in 2015:
- Domino’s had net cash from operations of £69m.
- FCFF = 69 – capex of £6.8m + dividends from joint ventures of £0.5m = £62.7m.
- FCF = £62.7m – net interest of £0.1m = £62.6m
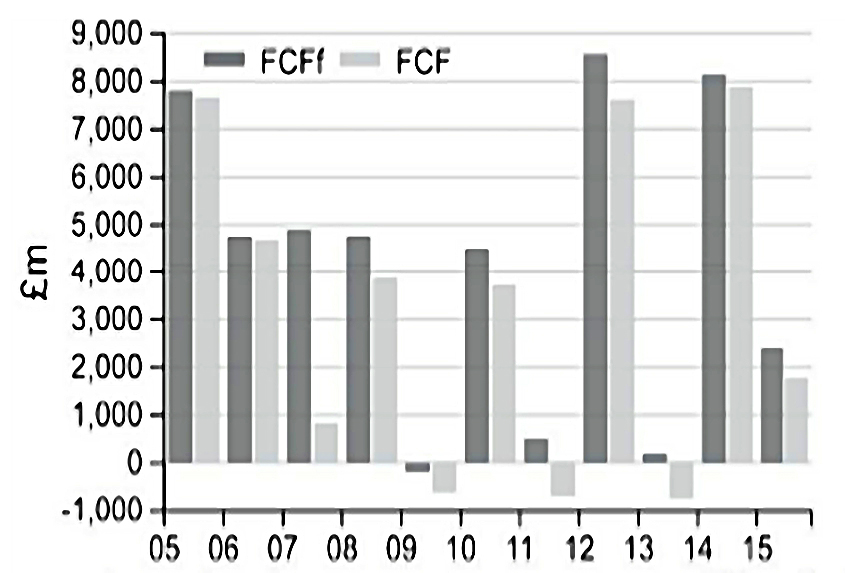
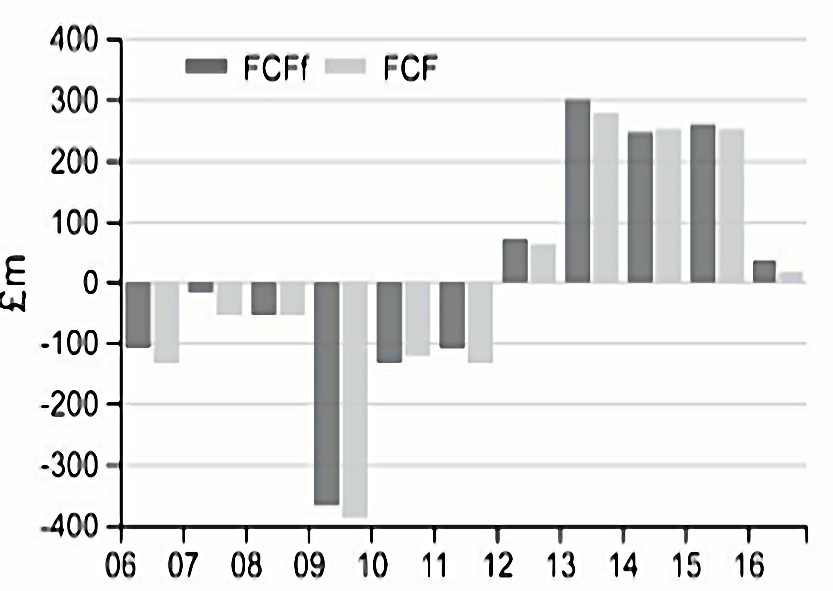
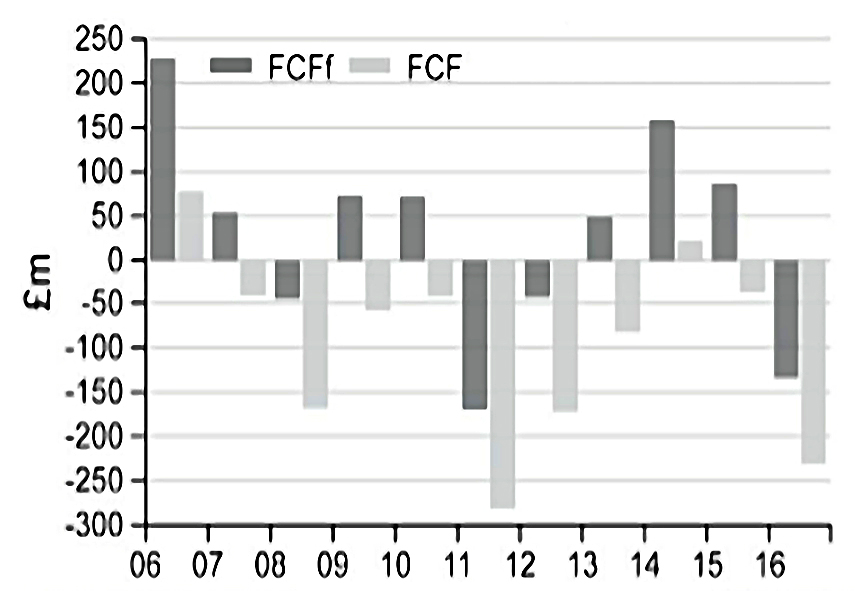
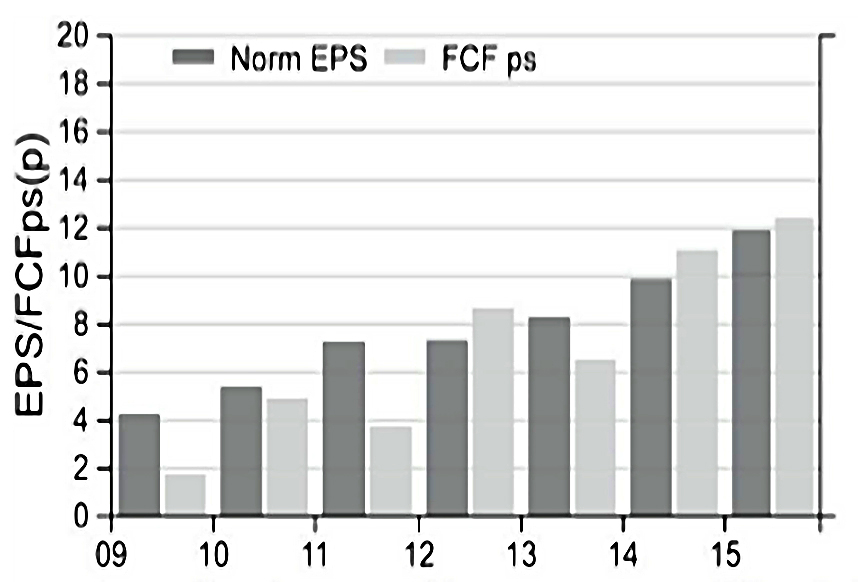
And here is a chart of Domino’s FCFF and FCF:
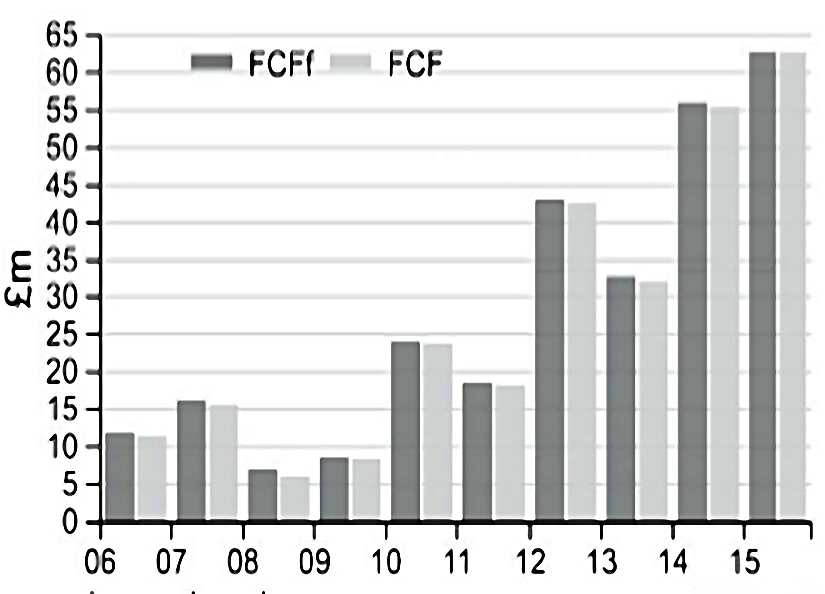
The FCFF and FCF grew nicely.
- Domino’s has very little debt / interest payments, so almost all the FCFF turns into FCF.
Phil contrasts Domino’s with pub company / brewer Greene King.

Greene King generates a good level of FCFF, but it has a lot of debt and pays a lot of interest, so FCF is lower.
So a rule of thumb is to avoid companies with a lot of debt.
- Too much of their FCFF gets paid out to lenders rather than shareholders.
An exception can be made where the FCF is being used to pay down the debt, so that shareholder returns will improve in the future.
How to produce lots of FCF
There are two characteristics to look for in firms:
- High and growing profits that are converted into operating cash flow
- this is called operating cash conversion
- Little need for new assets to support increased profits.
- these are low capex requirements.
Phil examines how good Domino’s has been at turning its operating profits (EBIT) into cash.
Operating cash conversion ratio = operating cash flow / operating profit x 100%
Phil is looking for a percentage of 100 or higher here.
- This shows that profits are real and means there is no need to borrow money.
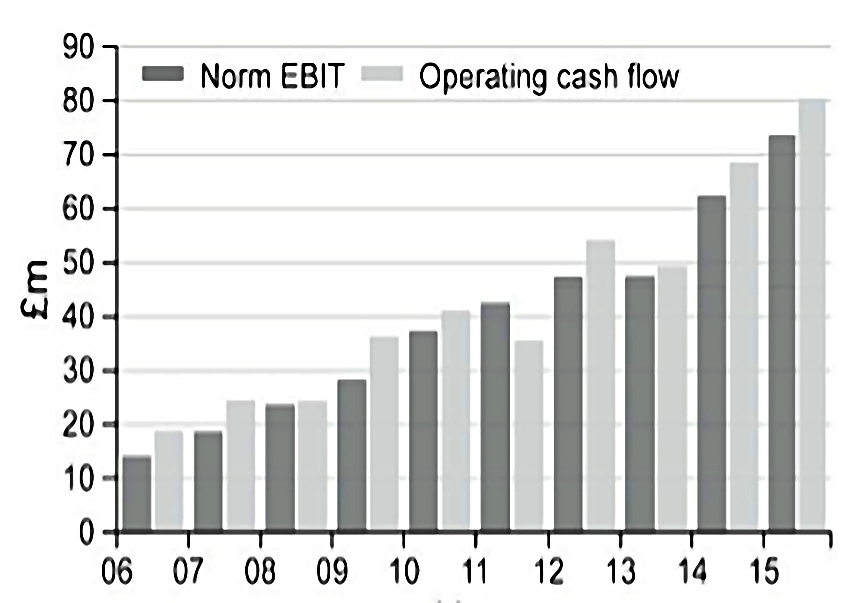
Domino’s scores above 100% for 9 of the last 10 years.
To do the conversion, expenses like depreciation – which reduce profit but don’t affect cash flow – need to be added back.
- Any income that didn’t result in cash coming in needs to be taken away.
- This might be a “profit” on the sale of an asset at more than book value (the value in the balance sheet).
You also need to subtract any increase in debtors (sales made on credit).
- If debtors falls, this would be added back.
- Debtors rising with sales is not a good sign, but debtors falling as sales rise is a good sign.
Creditors works in the opposite way to debtors.
Increases in stock (inventory) will reduce cash flow without affecting profit, so they need to be taken away.
- Decreases in stock need to be added back.
Top-up payments to pension funds will reduce both operating profits and operating cash flow.
- So the real question is whether the cash payment exceeds the amount expensed in the income statement.
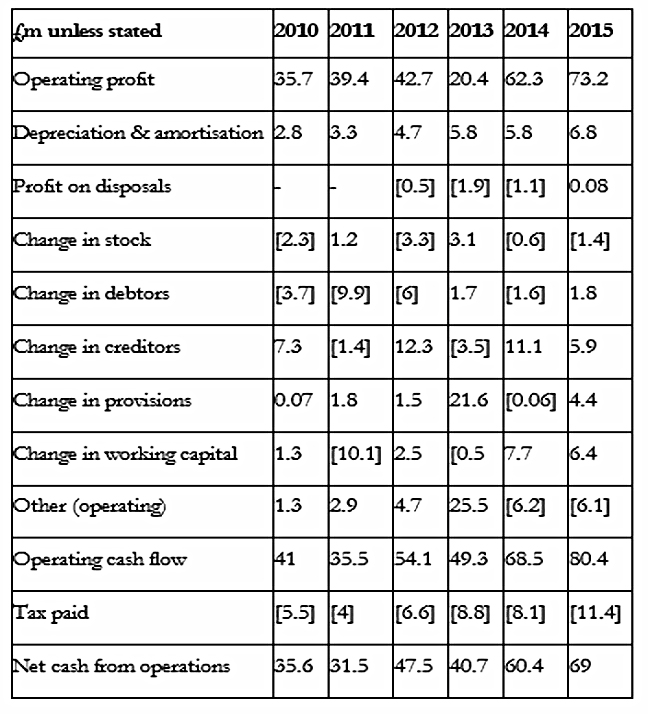
Phil works through the Domino’s numbers for 2015:
- The operating profit was £73.2m.
- + depreciation and amortisation of £6.8m = £80M
- – profits (losses) on disposals of -£0.08m = £80.08m
- + decrease in debtors of £1.8m = £81.88m
- + increase in creditors of £5.9m = £87.78m
- – increase in stock of £1.4m = £86.38m
Domino’s does not have a final salary pension scheme, so there can be no adjustment for top-ups.
Further adjustments include changes in provisions (for bad debts etc.), changes in working capital, and “other operating”.
- The smaller the working capital, the better the cash flow tends to be.
For Domino’s in 2015, £73.2m of operating profit was turned into £80.4m of operating cash flow.
- That is an operating cash conversion ratio of 109.8%.
Interpretation
Companies with lots of fixed assets – manufacturers, hotels, oil explorers, miners or utilities – have big depreciation expenses.
- Adding back depreciation boots their operating cash flow and their operating cash conversion ratio.
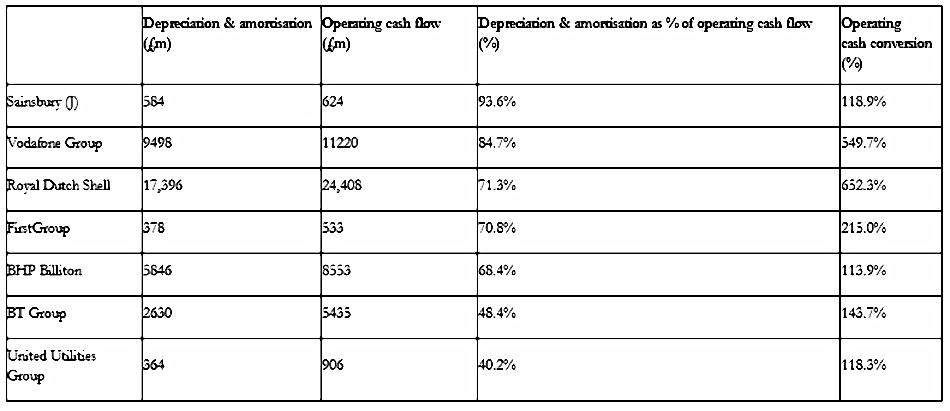
Big depreciation expenses usually mean big capex bills, with the cash generated from depreciation ploughed back into the business.
- Avoid companies with a depreciation to operating cash flow ratio of more than 30%.
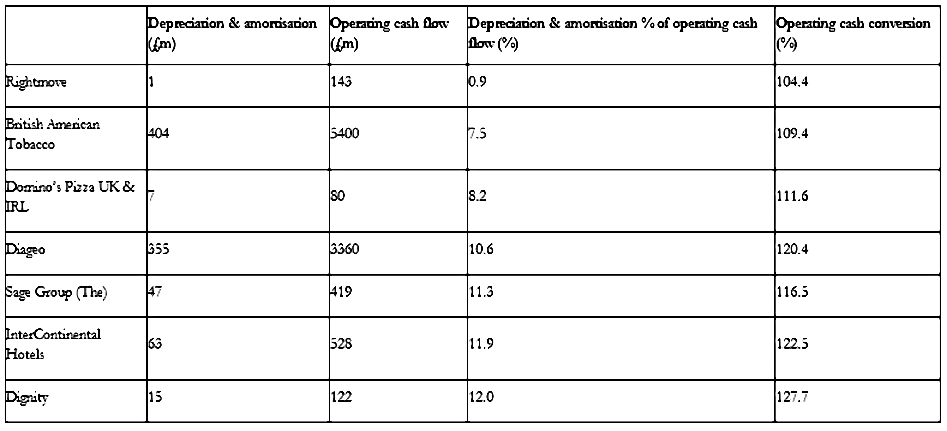
Good companies are ones that don’t need to spend a lot of money to grow.
- You want to see high conversion rates with low depreciation to operating cash flow ratios.
Phil also recommends looking at changes in working capital (stocks, debtors and creditors).
- High working capital can indicate financial distress or aggressive accounting.
The stock ratio = stock / turnover × 100%
- A rising stock ratio can be a sign of weakness.
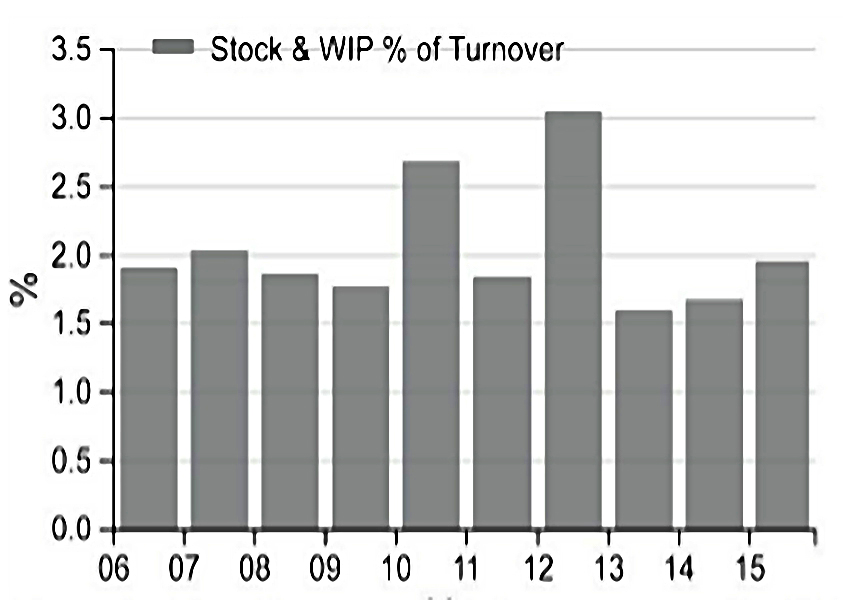
Domino’s had a low stock ratio of 1.95% in 2015.
- Stock levels are particularly relevant for manufacturing and retailing companies.
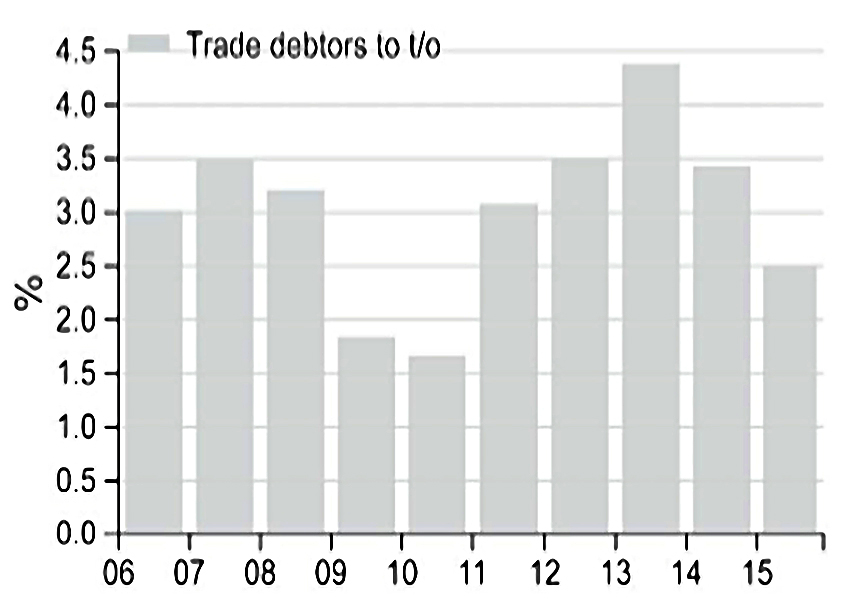
Rising debtors are also a sign of aggressive accounting.
- The debtor ratio = trade debtors / turnover × 100%.
- Domino’s had a very small debtor ratio of 2.5% in 2015.
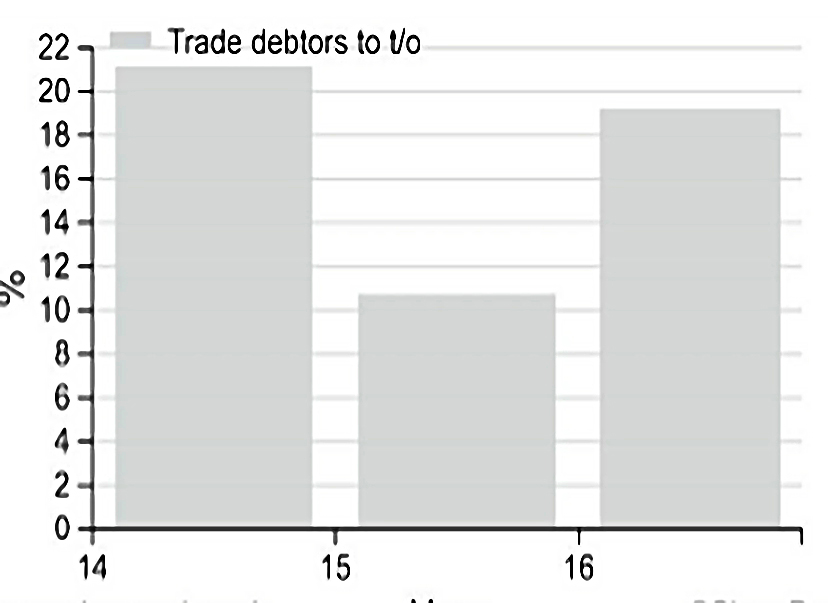
Compare this with Redcentric, whose share price crashed in 2016 when it was revealing that it had misstated its profits.
- There had previously been a big increase in the debtor ratio.
A decrease in creditors is also a warning sign: suppliers are demanding faster payment.
- This could mean a loss of buying power, or indicate a risk of bankruptcy.
Low capex requirements
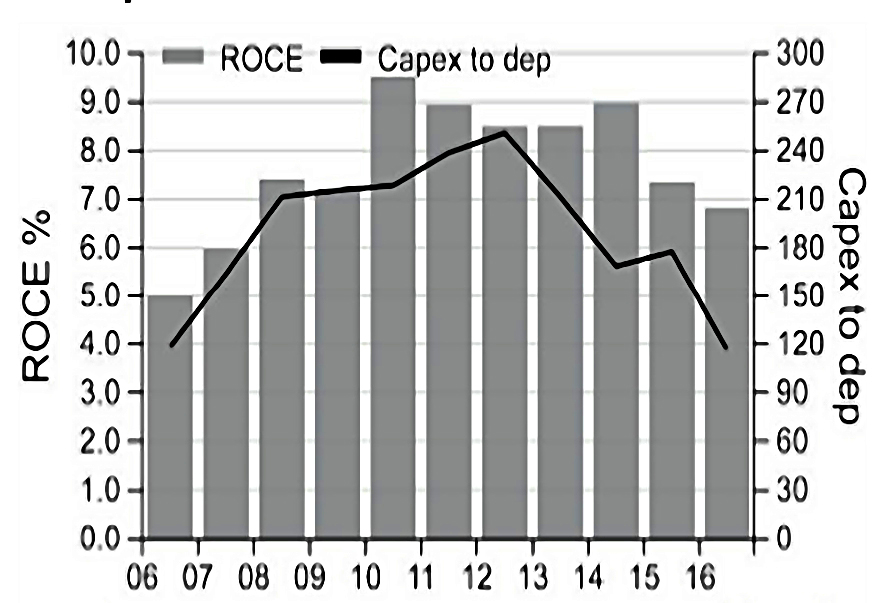
Phil looks for high ROCE (at least 15%) and lots of free cash flow.
- Usually this will mean that the firm doesn’t need to spend much money on new assets in order to grow.
He looks for a low capex ratio (below 30%):
- capex ratio = capex / operating cash flow
- Domino’s capex ratio in 2015 was £6.8m / £80.4m = 8.45%.
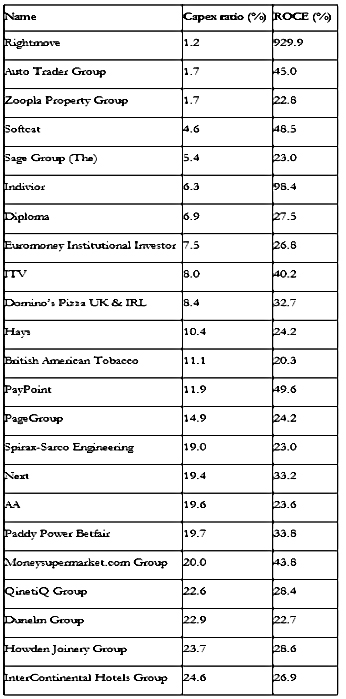
The (non-financial) companies with the lowest capex ratios (as at November 2016) also have high ROCE figures.
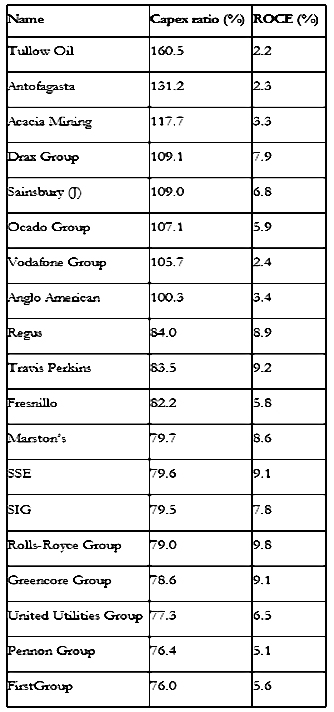
The next table shows the opposite: high capex ratio companies with low ROCE.
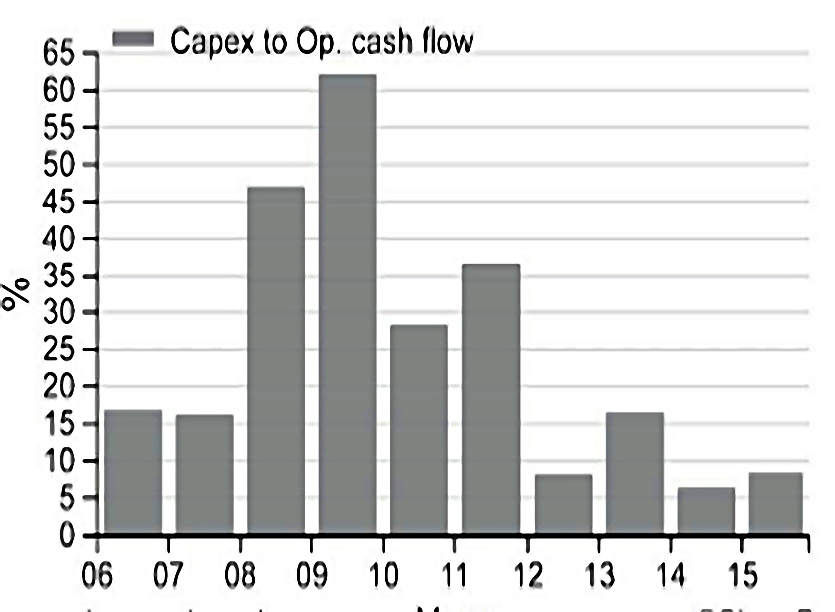
Domino’s capex ratio has come down nicely and is now less than 10%.
Back in 2008-09 the firm was investing in distribution centres, and the capex ratio was mich higher.
- So it’s worth thinking about how much more expansion can take place without another set of distribution centres needing to be built.

A consistently high capex ratio is a warning sign.
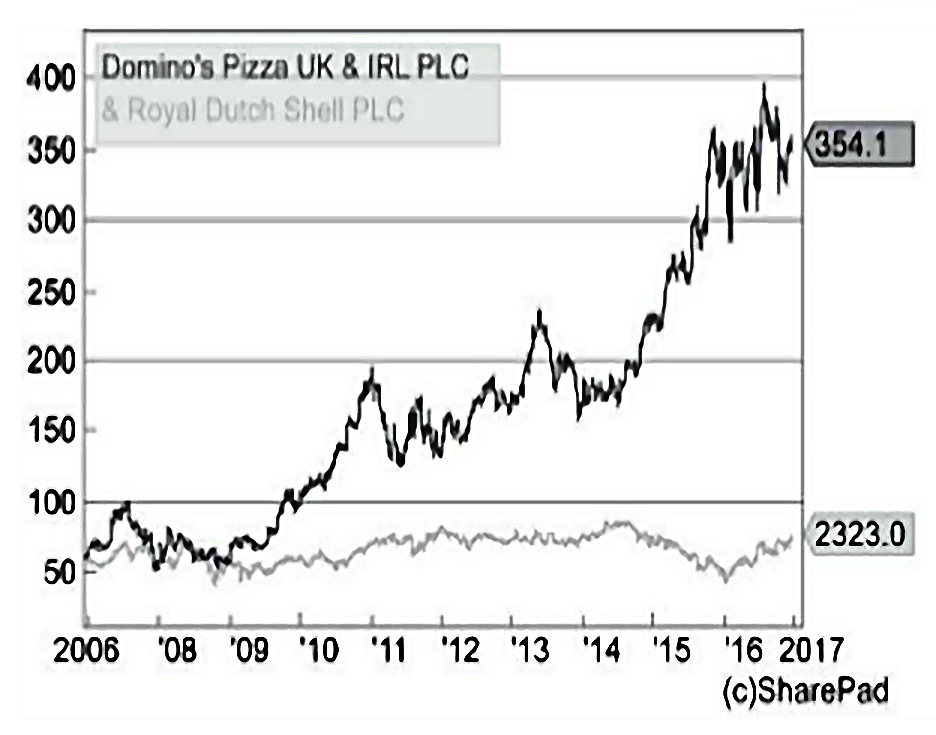
- Phil uses Shell as an example – its capex ratio was regularly above 50%.
Combined with volatile oil prices, this mean that Shell’s FCFF varied (before plunging in 2015).
Over the 10 years to June 2016, while Domino’s returned 660%, Shell returned just 63%.
Advanced free cash flow
In Chapter 4 of his book, Phil looks at eight more advanced topics:
- Is a company spending enough?
- Is negative cash flow always bad?
- Combining ROCE and free cash flow (CROCI)
- Free cash flow per share (vs EPS)
- Depreciation and profits
- How safe are dividend payments?
- When free cash flow is not what it seems.
- Manipulation of free cash flow.
Are they spending enough?
Here Phil is worried about the deterioration of assets.
- This can only go on for so long before a lot of money will need to be spent.
But it’s hard for an outsider to know what this “stay in business” capex should be.
- As a proxy, you can assume that capex should be higher than depreciation plus amortisation (( Depreciation applies to tangible assets, and amortisation to intangibles ))
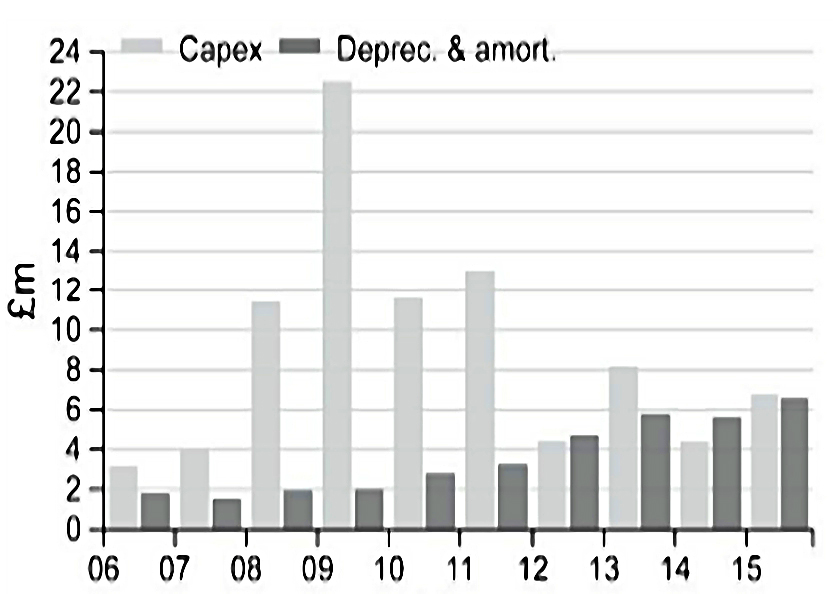
Domino’s capex spend has been the same or more than its depreciation from 2006 to 2015.
- It’s a good idea to compare the level of spend with other companies in the same sector.
- Using the average over the past five years is also a good approach.
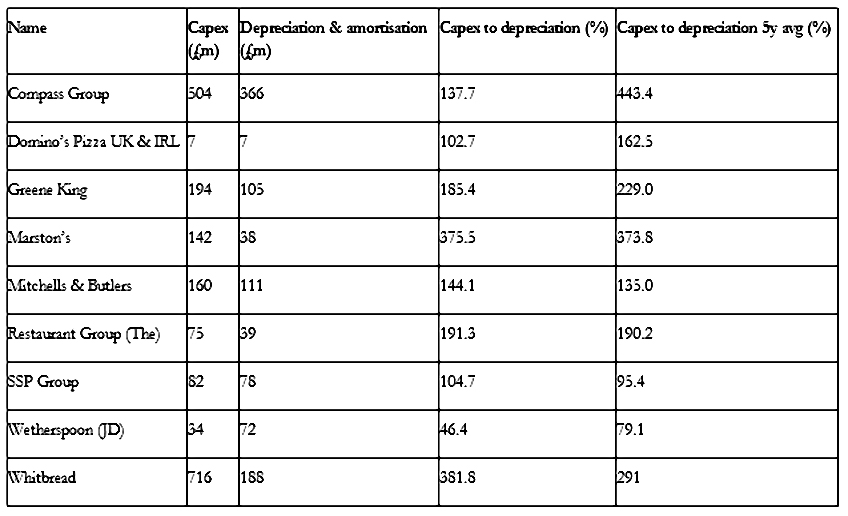
Domino’s spend is at the lower end, but not so low as Wetherspoons, which spends less than depreciation.
- This turns out to be because Wetherspoons separate out their spend on new pubs.
ITV also appears to spend too little.
Phil says this is just the nature of the TV business, where
ITV has to spread the cost of things such as licences, customer contracts, software and programme libraries over their useful lives and these do not need to be matched by outflows of cash every year.
The real problem is when a firm cuts spending when revenues and profits are falling.
- Eventually, worn-out equipment will need to be replaced, hitting FCF.
Is negative FCF bad?
When a firm invests heavily in new assets to grow future sales, it can have low or even negative FCF.
- But if ROCE is high and increasing, then there could be a period of high FCF to come (when the investment cycle completes).
- You would need to consider what the “stay in business” capex might end up being.
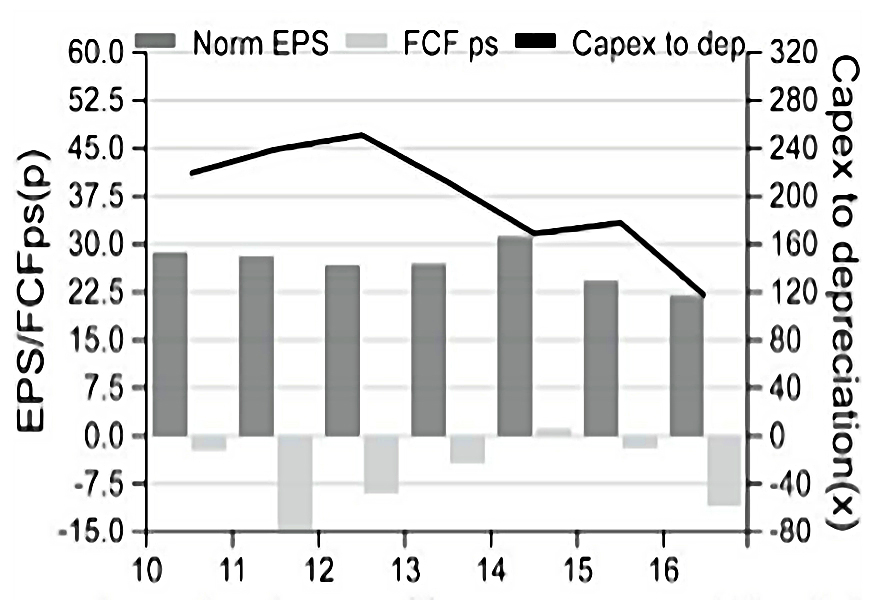
Easyjet is an example of a company that spent a lot on new assets.
- Its capex-to- depreciation ratio was well over 100% from 2006-15, which hit FCF.
- But ROCE was in an upward trend, towards a respectable 18%

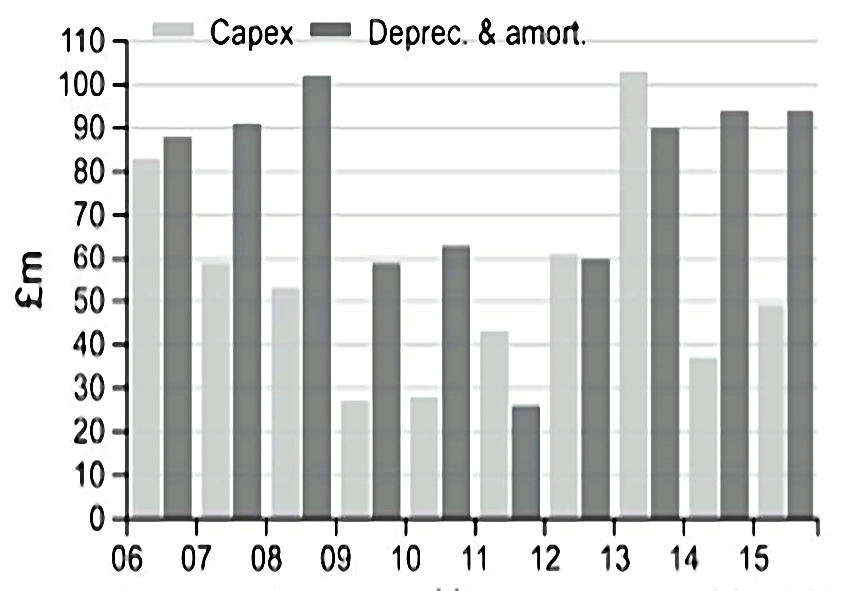
Phil next looks at Sainsbury’s, where FCF has varied between 2006 and 2015:
Here, profits have fallen but capex has remained above depreciation.
CROCI – ROCE meets FCF
If we combine Phil’s two measures, we are looking for businesses that have a high free cash flow return on capital invested – what Phil calls CROCI.
- CROCI = adjusted FCFF / average capital employed
A CROCI above 10% is good (cf. 15% as the minimum for ROCE).
- CROCI (like ROCE) should be looked at on a lease-adjusted basis.
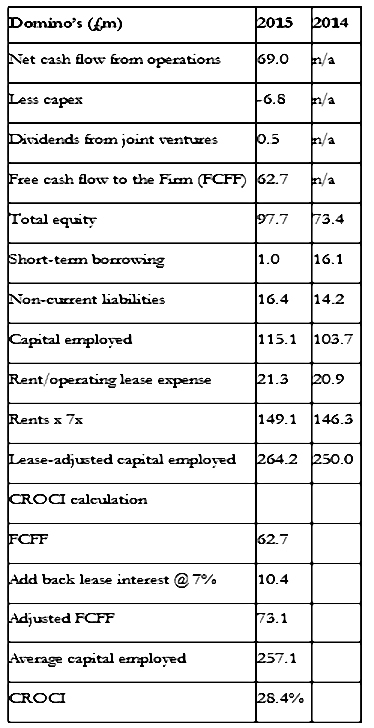
The table above calculates Domino’s CROCI for 2015.
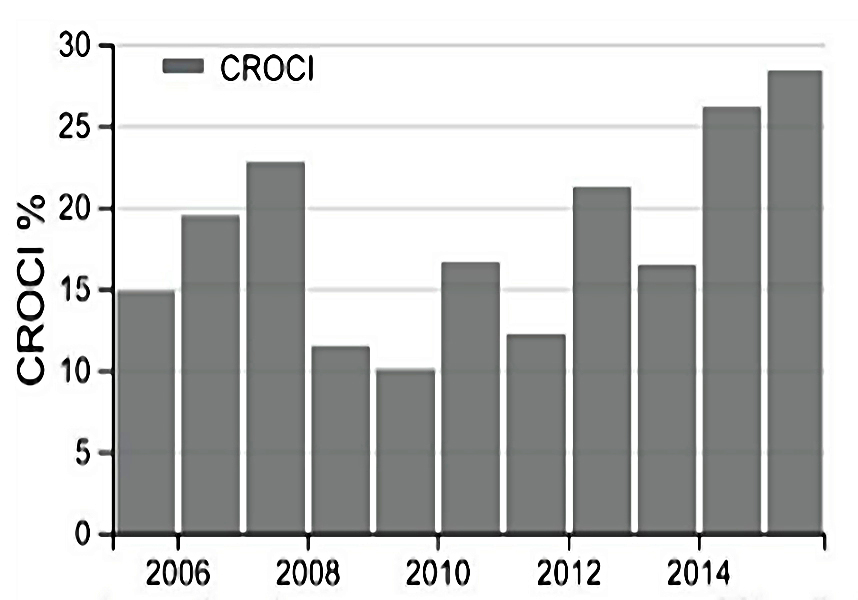
Domino’s CROCI was regularly over 15% between 20016-15, reaching 28.4% in 2015.
- The average for the 10 years was 18.6%.
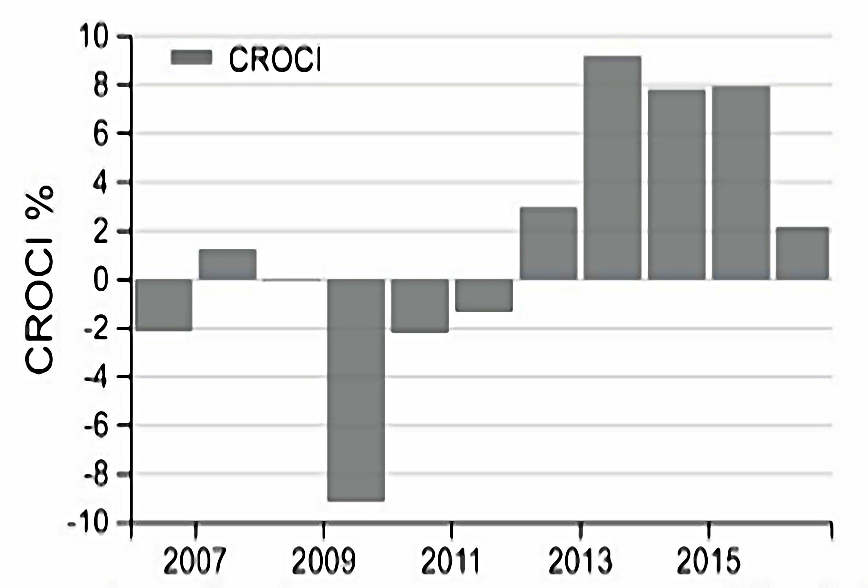
Contrast this with easyjet.
- We saw last time that its lease-adjusted ROCE was 18.6% in 2015.
- But its CROCI is only 7.9% – below Phil’s threshold.
Easyjet is one for the future, when capex drops back down to maintenance levels.
Phil warns in this section against the AIM stocks that have appeared to be profitable but turned out not to be.
The simplest test is to compare normalised earnings per share (EPS) with FCF per share (FCFps).
- To calculate FCFps you just divide FCF by the weighted average number of shares in issue through the year.
FCFps should generally be close to EPS, especially over several years.
- Cashflows are always lumpier than profits, which are based on smoothing out the revenues and costs.
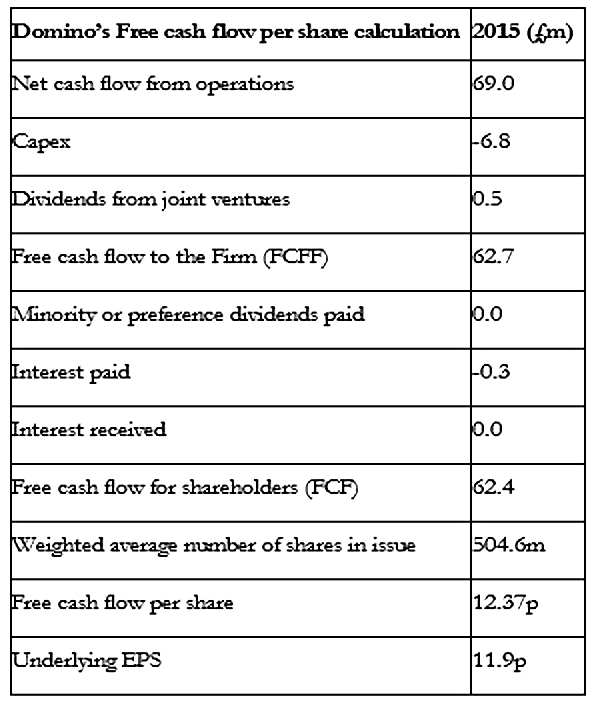
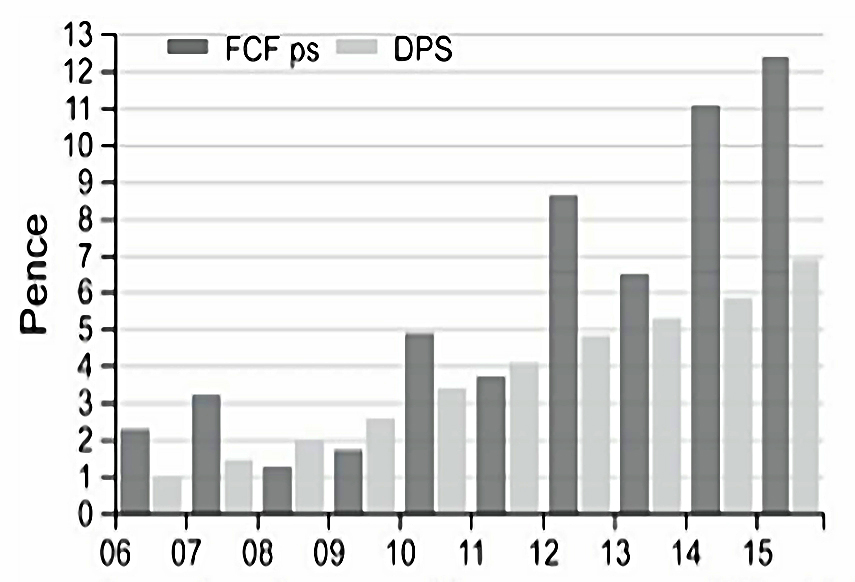
The table shows the 2015 calculation for Domino’s.
- EPS is 11.9p and FCFps is 12.4p.
If FCFps is always lower than EPS, there might be a problem.
A growing company could have poor operating cash conversion, because they are making a lot of sales on credit, but you need to be sure that they are real sales.
- Or there could be a build up of stock, which is fine if it eventually will be sold, but can also be used to artificially boost profits
The second explanation is a lot of capex (more than depreciation, like Easyjet).
- High capex needs to be matched by high ROCE, and should not continue for a long period.
- It can be also be a sign of manipulated profits and aggressive accounting (see next section for more detail).
Phil uses four rules when comparing FCFps with EPS:
- FCFps is 80% or more of EPS = definite investment candidate
- FCFps less than 80% of EPS and ROCE is increasing = possible candidate
- FCFps less than 80% of EPS but ROCE is falling = avoid
- FCFps is consistently negative = avoid
Depreciation and profits
We’ve already explained how depreciation spreads the cost of an asset over it’s useful life, writing it off against the profits it helps to produce.
There are many approaches to working out depreciation:
- the straight line basis uses a fixed percentage (eg. 10% if the asset will last 10 years)
- the residual balance approach knocks off, say, 25% of the remaining value each year
If management pretend that assets will last longer than they really will, the annual depreciation charge can be reduced, and profits inflated.
- If the real maintenance capex is still spent (as per the genuine lifetime , this will depress FCFps relative to EPS.
Phil uses Sainsbury’s – which like most supermarkets has spent more on capex than depreciation (leading to low FCFps) as an example.
However, this has not lead to an increase in profits (or EPS), which leads Phil to conclude that this was maintenance capex.
- Which means that depreciation was too low and profits too high.
The share price was flat from 2005 to 2015, and eventually the dividend was cut.
Safety of dividends
To check whether dividends are safe, you can compare its FCFps with its dividend per share.
- FCFps should usually be bigger than the dividend per share.
The ratio between the two is the free cash flow dividend cover, and needs to be greater than 1.
As usual, the odd year or two of heavy investment to generate future growth is fine.
- But if the dividend is the higher number for too long, then eventually it will be cut.
Domino’s invested heavily from 2007 to 2010, and its free cash flow did not cover its dividend.
- Since 2012 everything has been fine.
When the cover ratio becomes large, it’s clear that the dividend could be increased in the future.
Problems with free cash flow
Phil warns in the next section that sometimes you need to dig into the cash flow statement to be sure that the FCF number can be trusted.
- The first example he looks at is British Land, which had no FCF but was paying dividends.
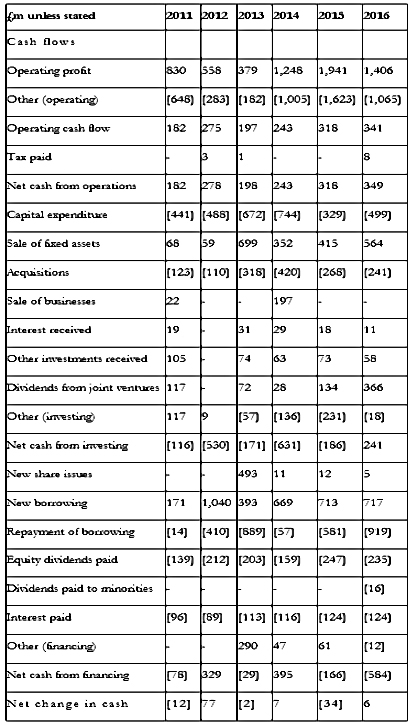
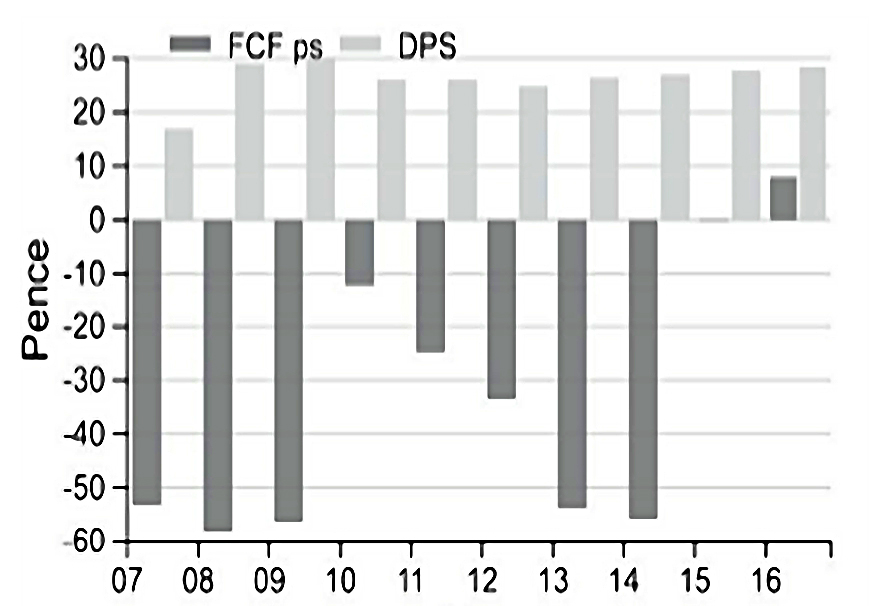
British Land owns and builds commercial property.
- Its capex spend is usually higher than its operating cash flow, making its FCF negative.
But British Land sells assets as part of its business, and so the cash flows from these sales should really be added back.
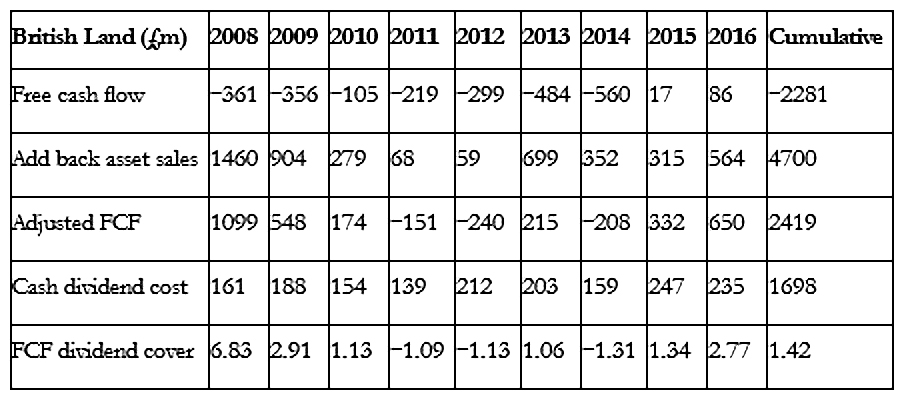
When they are, things look better.
- Over 8 years, FCF totalled to minus £2.3bn, but sales were £4.7bn.
- So the net cash flow (£2.4bn) was higher than the total dividends (£1.7bn).
- The free cash flow dividend cover ratio for the period was 1.42.
The second example is RPS, which showed positive FCF, but was regularly acquiring other companies.
- RPS is a consultancy, with mostly people costs and low capex.
- But it makes an acquisition every other year.
Taking away the cash flows spent on the acquisitions reduces FCF significantly.
- And now there isn’t sufficient FCF to pay the dividend.

FCF Manipulation
Although profits are easier to manipulate, Phil outlines a number of ways in which FCF can be manipulated by companies:
- They can delay paying their bills until after the end of the financial year
- This increases creditors and boosts operating cash flow and FCF
- Sell debtors to a factoring company to speed up the receipt of cash from credit sales
- Cut back investment (capex, as discussed above)
- Buy companies rather than assets (again, see above)
Look at what is causing FCF to change.
- Growing FCF should come from growing profits.
Changes in working capital (paying bills later, collecting their debtors faster and holding less stock) and cutting capex are not repeatable year after year.
Conclusions
Phil finishes this first part of the book (finding quality companies) with a checklist.
You should be looking for:
- Ten years of growing sales and high and growing profits (normalised EBIT).
- Reported and normalised EBIT should be similar in most years.
- EBIT profit margin above 10% almost every year.
- ROCE consistently above 15% for the last ten years.
- Use DuPont analysis to find out what is driving the ROCE.
- Growing FCFF and FCF, which should be roughly the same.
- Operating cash conversion (profits to cash flow) of 100% or more.
- Capex ratio less than 30% almost every year.
- Capex close to depreciation.
- CROCI above 10% each year.
- FCFps close to EPS most years.
- FCFps greater than dividends per share in most years (free cash flow dividend cover greater than 1).
Phew! We’ve made it through the second part of the book.
- It remains a dense but rewarding read.
I’ll be back in a few weeks with the succeeding chapters, which are on how to avoid bad companies.
Until next time.
Mike Rawson
Mike is the owner of 7 Circles, and a private investor living in London. He has been managing his own money for 40 years, with some success.