FIRE Prowess Gauge – Chain Gang No 2

Today’s post is my second that forms part of a chain of linked posts by finance bloggers on both sides of the Atlantic. It’s about the FIRE Prowess Gauge.
Contents
Chain Gangs
Regular readers may recall that I joined my first Chain Gang about six weeks ago.
- That one was about my Drawdown Strategy, and you can find my contribution here.
I thought it was a great idea that we should repeat regularly.
- At first it didn’t look like it would happen, but now a couple of the same people have started another one.
This one is about calculating your FIRE Prowess Gauge.
FIRE Prowess Gauge
The idea behind the FIRE Prowess Gauge (FPG) is that it’s another way of working out whether you are on track to reach Financial Independence / Early Retirement (FIRE).
- The most common way of approaching this is the savings rate, which we talked about here.
We also came up with a spreadsheet which calculates the savings rate you need using the most common ways of saving for retirement in the UK.
- It’s called the Four Pot Solution and you can find it here.
So the FPG is an alternative to – or complement to – the Savings Rate.
The FPG was invented by JW over at The Green Swan – there’s a link to his post (and all the others in the chain) at the bottom of this article.
It compares your earned income (gross – before taxes) over a given period (we’ll start with a year) to how much wealth you’ve created in the same period.
- So if you earned £25K in 2016 and your net worth increased by £15K, you would have an FPG of 60%.
As well as an annual number for the FPG, the bloggers already in the chain have looked at rolling five-year periods, and a “lifetime” score for the entire period for which they have income and net worth data.
Scoring the FPG
There’s a scoring chart for the FPG to give you an idea of how well you are doing.
- It works better against the rolling five-year average FPG.
If your 5-yr FPG is:
- Less than zero – you’re getting further away from FIRE
- Either you’re spending more than you earn, or you just had a bad year in the markets
- 0% to 25% – you know about retirement, but you aren’t really on track to retire early
- 25% to 50% – you’re on track to FIRE
- 50% to 100% – you’re closing in on FIRE
- more than 100%
Note that if your lifetime FPG is more than 100% then your net worth is higher than your lifetime earnings, which is a great but difficult milestone to reach.
My data
Although the calculation of FPG is simple in itself, you do need access to reliable historical data for:
- your net worth
- your earnings
I started recording my net worth accurately at the end of 2006.
There were a couple of reasons for this:
- I had reached the age of 45, and was keen to retire before I hit 55 (I was becoming increasingly unhappy at work, and wanted to get out)
- The tax rules changed here in the UK, making it significantly easier to build up a decent pension pot
I saw the opportunity and wanted to get planning.
For most people, the earnings part can be taken from your P60 (annual earnings certificate) or from your tax return.
- But how many of those do you have filed away?
By coincidence (or perhaps not) I have electronic versions of my (our, since my calculation will also include my other half, OH) tax returns back to 2006.
- It’s quite likely that I have paper copies of returns for earlier years in a box in the loft, but I’m not sure exactly where.
So it’s 2006 as the starting point for me.
But my case, there are some complications.
What counts as earned income?
If you’re employed, this bit is easy – it’s what it says on your payslip.
- Or is it? Your employer is probably making contributions on your behalf to a workplace pension, and those are really part of your earned income, too.
- For all I know, these contributions are now shown on your payslip – I haven’t been employed in the regular sense since 1995, and the pensions those days were all DB, with no formal contributions, just promises.
Anyway, since 2006 OH and I have been working through our own company.
- So I need to add in pension contributions.
- And dividends that we’ve taken from the company.
The other thing I need to add in is inheritance.
- My Dad died in 2009 and I got some money.
- A few years later, I got a half share in his house.
This is not earned income, but it has the same effect of increasing my net worth without any investing savvy on my part.
There are also some things that I won’t include as earned income:
- Rental income (my sister and I rent the house to a housing association) – it’s peanuts anyway, but I see this as interest on my investment in the house.
- Any other investment income (eg. dividends from shares) would be treated the same way.
- Endowment policy maturities – this is the return of investment cash.
- Pension withdrawals – I turned 55 in 2015 and started taking money from my plans in 2016.
Timing
One more wrinkle: the timing of net worth valuation periods and tax returns doesn’t line up in the UK.
- The tax year runs from April to March. (( Technically from 6th April to 5th April, but let’s keep thing simple ))
- My valuation periods run from January to December.
Technically, this means that there is a 25% mismatch between the income for a year and the change in net worth for the same year.
- For the 5-year rolling periods, this mismatch falls to 5%.
But the mismatch is random rather than systematic (will be positive one year and negative the next) and tends to zero over the long run.
- Over the ten years of “easy” data that I have, the error is 2.5%, which is acceptable.
The results
So what do the numbers look like?
Regular readers will know that I don’t use real currency (£) when I report on my portfolio.
- Instead I use the position at the end of 2006 as a base, and count that as 100.
- The portfolio value in subsequent years is measured as a percentage of the 2006 position.
So I’ve done the same thing for the annual income and changes in net worth.
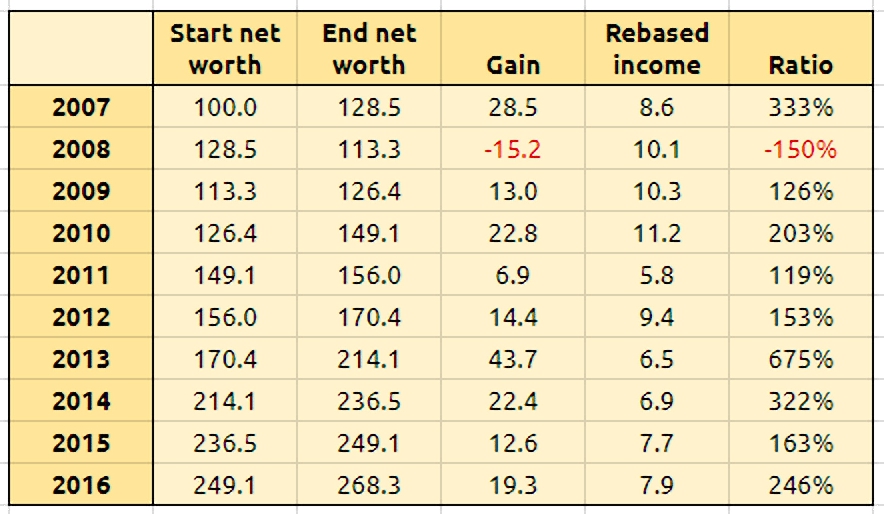
There are a few things to note:
- Our income ranges from 5.8 to 11.2 (mean of 8.4).
- There is only one year of negative change in net worth.
- That was the market crash in 2008.
- The other net worth changes range from 6.9 to 43.7 (mean of 16.8).
- If we exclude 2008, the mean rises to 18.4.
- The FPG ranges from -150% (2008 again) to 675% (mean of 219%).
So that 10-year mean of 219% is the nearest I can get at the moment to a “lifetime” FPG.
- I started work in 1984, so that covers just 10 out of 33 years.
Here’s what it looks like as charts.
First up is end year net worth against yearly changes:

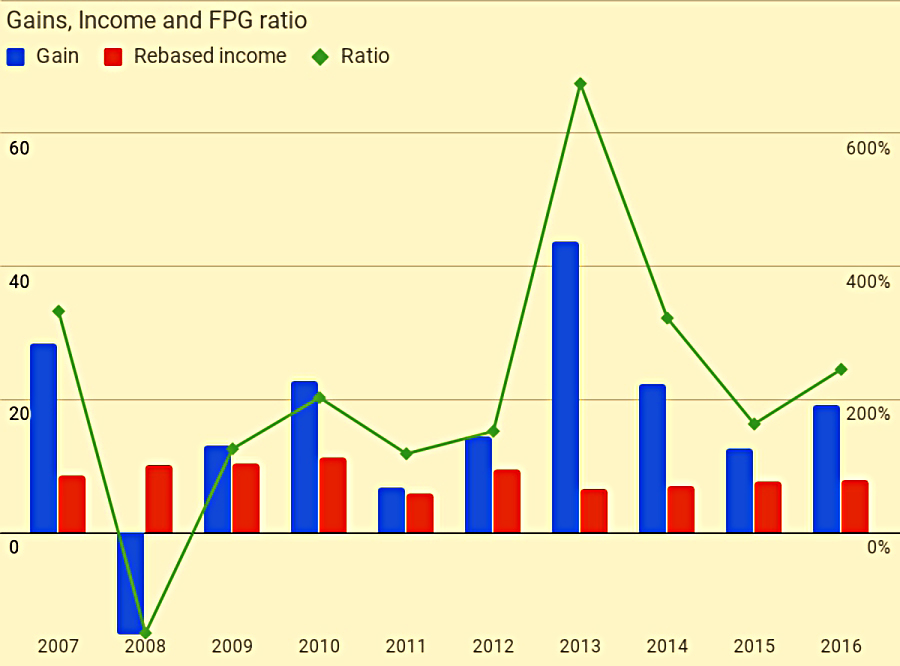
And here are the yearly gains, the income and the FPG ratios:
Rolling five year data

The table above shows the raw data.
- Our 5-yr income ranges from 36.4 to 46.9 (mean of 41.8).
- This is much smoother than the 1-yr data.
- The 5-yr change in net worth ranges from 41.9 to 112.3 (mean of 86.9).
- And there are no negative periods – 2008 has been swallowed up.
- The FPG ranges from -89% (2008 again) to 292% (mean of 215%).
- Again, the 5-yr data is much smoother than the 1-yr.
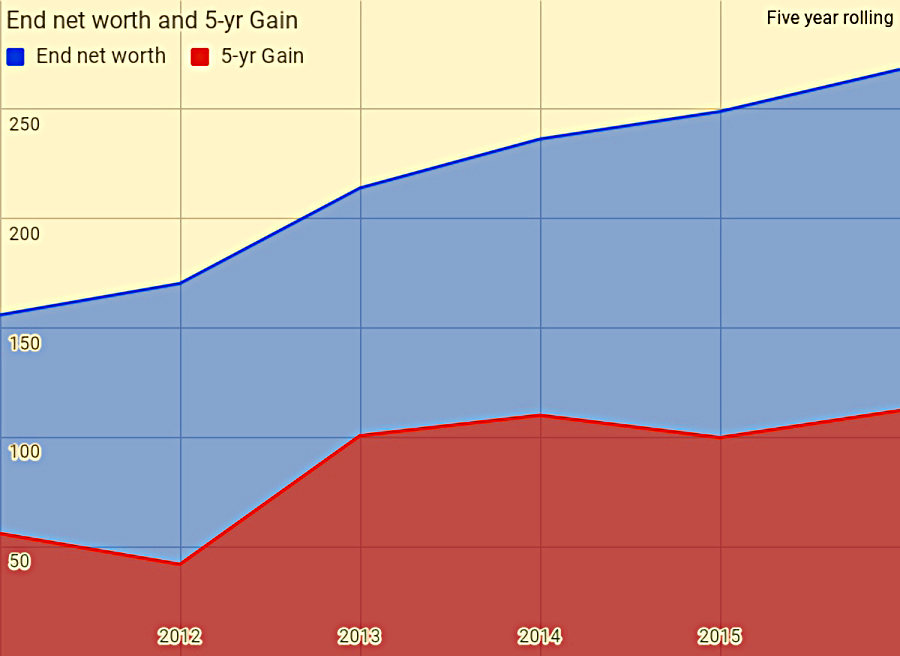
Here’s the net worth and 5-yr gains.
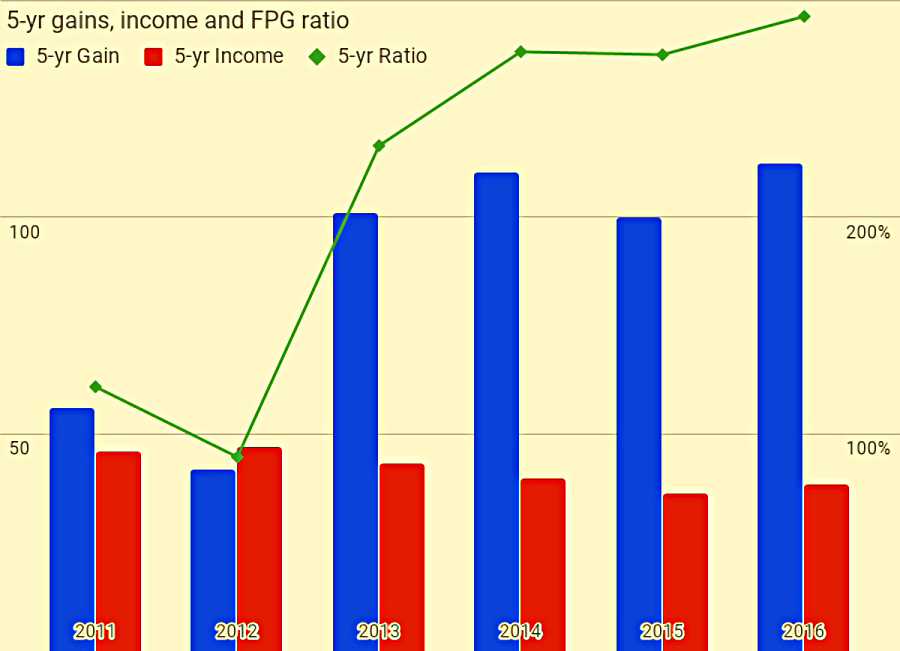
And here are the yearly gains, the income and the FPG ratios.
The journey to FIRE
In some way, this has been an academic exercise for me.
- I quit work in 2012, so this hasn’t been about working out whether I’m on track to FIRE.
My OH kept working though, (( In fact today is her last day at work )) so we’ve had a reasonable earned income through the whole period and the FPG calculations still work.
- When you completely retire, the lack of earned income means you can’t work out a sensible FPG.
To put all these numbers into context, our annual spending currently works out at around 4% of our 2006 net worth – so 4 on all these tables and charts.
- We expect in full retirement to get that down closer to 3, and ideally below 3.
So when I started keeping good records, we already had 25 years of worst-case expenses saved up.
- You can FIRE at 25 years of expenses, though given the current state of markets and macroeconomics, 35 years is a lot safer.
We reached that target at the end of 2011, and three months later I quit.
The snowball
My numbers are a lot bigger than most of the bloggers in this chain.
- That’s because I was close to FIRE when we started.
You may think that’s cheating, but in fact its an important lesson about investing.
- The older you get, and the bigger your pot grows, the larger your annual gains become.
Our gains have been larger than our income in 9 out of the last 10 years, and on average more than double our income.
- When that happens (when your FPG is above 100%, and definitely when it’s above 200%), it’s time to start thinking about quitting.
I read once that 95% of Warren Buffett’s vast wealth was accumulated after the age of 50.
- We’ll I’m 56 now, and according to those charts above, 42% of my wealth has been accumulated in the last 5 years
- That’s since I turned 51, and after I stopped working.
That’s a bull market for you.
- I’m unlikely to ever catch up to Warren’s percentage, but it’s something to aim for.
Until next time.
The chain members
Here are the links to the rest of the chain:
- Anchor: The Green Swan – The Swan’s FIRE Prowess Gauge 2016: 132% Lifetime: 93%
- Link 1: The Retirement Manifesto – Is Your Wealth Building On Track? 2016: 57% Lifetime: 44%
- Link 2: OthalaFehu – My Swan FIRE Prowess Numbers 2016: 72% Lifetime: 61%
- Link 3: Budget On A Stick – My FIRE Prowess Score 2016: 52% Lifetime: 55%
- Link 4: Shnugi – Calculating My Savings Rate 2016: 71% Lifetime 54%
- Link 5: Dads Dollars Debt – DDD’s FIRE Prowess 2016: 26% Lifetime 32%
- Link 6: Debts To Riches – My FIRE Prowess Report Card 2016: 29% Lifetime 43%
- Link 7: Adventure Rich – The Adventure Rich FIRE Prowess Score 2016: 45% Lifetime 47%
- Link 8: Freedom Is Groovy – The Groovies FIRE Prowess Score 2016: 163% Lifetime 90%
- Link 9: Working Optional – Calculate Your Progress To Financial Freedom 2016: 97% Lifetime 75%
- Link 10: Budgets Are Sexy – My Total Lifetime Wealth Ratio: 2016: 135% Lifetime 60%
- Link 11: Life Zemplified – FIRE Prowess Score for Life Zemplified 2016: 78% Lifetime 76%
- Link 12: Physician’s Wealth Services – Physician Wealth’s FIRE Prowess 2016: 43% Lifetime 46%
- Link 13: Married And Harried – Married And Harried FIRE Prowess Score 2016: 32% Lifetime 14%
- Link 14: Ms. Liz Money Matters – Introducing the FIRE Prowess Score 2016 279% Lifetime 72%
- Link 15: Actuary On Fire: The Swan’s FIRE Prowess Gauge – My Results 2016 61% Lifetime 59%
- Link 16: Trail to FI: FIRE Prowess Score, Trail to FI Edition1 2016: 34% Lifetime: 53%
- Link 17: Maximum Cents: Maximum Cents’ FIRE Prowess Score 2016: 94% Lifetime: 70%
- Link 18: Retiring On My Terms: ROMT’s FIRE Prowess 2016: 119% Lifetime: 57%
- Link 19: Minafi: The Minafi FIRE Prowess Score 2016: 74% Lifetime: 94%
Readers In The Chain:
- Daren: FIRE Prowess Score 2016: 78% Lifetime: 47%
- Todd: FIRE Prowess Score 2016: 75% Lifetime: 29%
Mike Rawson
Mike is the owner of 7 Circles, and a private investor living in London. He has been managing his own money for 40 years, with some success.


Mike, what a great post and definitely a new wrinkle in the FIRE Prowess Chain. Exactly as you said, it is very apparent that getting the snowball rolling early makes things come a lot easier later on.
And staying the obvious, your FIRE is very secure!
Thanks so much for joining the chain and sharing your story!