Stockopedia at the London Investor Show 2014


The first presentation in the main auditorium at the London Investor Show was by Edward Page-Croft from Stockopedia, a company which sells subscriptions to a stock-screening and ranking service. Most of the content is available on their website or in their literature, so if you’re familiar with the product, look away now. I think it’s a potentially useful service, so I want to make more people aware.
Edward began by reminding us of the retail investor’s uncanny ability to NOT time the market – typically they buy at the top and sell at the bottom. For Edward, one of the key reasons behind this is our need for stories – we become carried away by narrative fallacies. Over the past fifteen years, some of the popular stories have included dotcom, China, the commodity supercycle and renewables.
He also quoted a scary report which found that the average retail investor owned only four shares and churned 75% of their portfolio annually. ((Baker and Odean, 2000))
For Edward, it is key to remember that everything shows mean reversion. The private investor should strive to be like Spock – contrarian, disciplined and unemotional. The key to this is following rules and statistics rather than stories.
There are three things that work in the stock market: ((Haugen and Baker, 2008))
- cheap (as measured by eg. P/E) is better than expensive
- good (eg. cash generative, low-risk) is better than bad
- leading / improving is better than lagging / deteriorating (momentum)
- Alternatives to P/E include price to cashflow, price to book and dividend yield.
- Other measures of quality include ROCE, margins, free cashflow and stable sales growth.
- Measures of risk include the F-score (and in particular its trend), volatility (low beta is best), low bankruptcy risk, hight earnings quality and stability.
- Price momentum is measured through new highs, relative strength and moving averages.
- Earnings momentum is tracked via results beating forecasts and upgraded broker forecasts and recommendations.
The problem is that selecting these stocks is against human nature (Behavioural Finance): cheap = problems with the company, good = boring, new highs = scary.
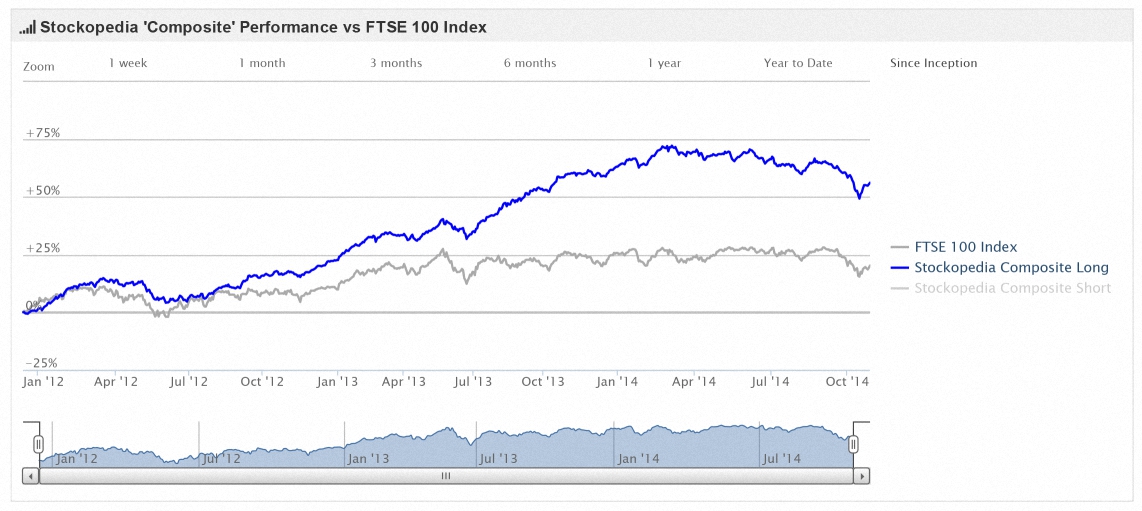
To overcome this, Stockopedia take a blend of these three groups of measures to produce blended ValueRanks, QualityRanks and MomentumRanks, which are then combined into QVM StockRanks. Based on 18 months of real data, their highly ranked (“super”) stocks are consistently out-performing the market, and especially those stocks with low scores (“sucker stocks”.)
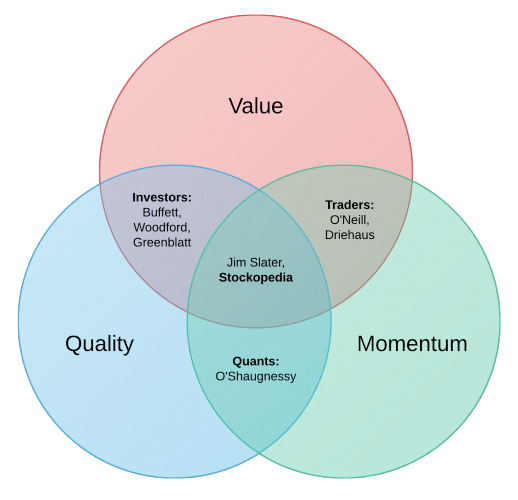
Edward then covered which famous investors have used the various measures:
- Q and V = investors (Buffett, Woodford, Greenblatt)
- Q and M = traders (O’Neill, Driehaus)
- V and M = quants (O’Shaughnessy)
- Q, V and M = Jim Slater (and Stockopedia)
The measures they used include:
- p/e < 8, p/book < 1 (Graham);
- PEG < 0.75 (Slater);
- p/sales < 1 (O’Shaughnessy);
- ROCE > 12%, ROE > 15% (Buffett)
- ROCE > 12% (Slater)
- 1 yr price in top 10% relative strength (O’Shaughnessy)
- new price high (O’Neill)
- beating the market over 1 yr (Slater)
Stockopedia use these rules, together typically with market cap measures (nothing below a cut-off size), to produce Guru Stock Screens, which are listed on their website.
The problem with screens is that they often produce only a few candidate stocks, leading to volatility and increased risk of significant drawdowns. Edward stressed the importance of Portfolio Management: diversification, risk management and rebalancing. He recommended between 25 and 50 stocks as the ideal portfolio size.
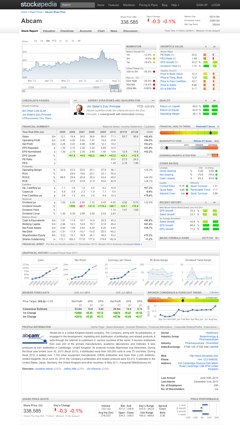
To support this, Stockopedia convert these heuristics into normalised scores (1-100) relative to the entire market of 2000+ stocks. The StockRank score is based on a 40-factor checklist. Edward pointed out that the StockRank score can also be used to make sell decisions, by tracking the score over time – when it begins to stall, it may be time to sell.
Though I had come across Stockopedia before, I was impressed by the presentation. Their approach is clear, transparent, systematic and based on public data. I plan to take up their offer of a free trial later this year and report back on how easy the website is to use.
The only remaining issue is cost – the cheapest subscription for 2000 UK stocks is £150 per year. Whether this is cost-effective for you will probably depend on your portfolio size and annual churn rate. Working out the maths on this is something I will return to in a later post.
Mike Rawson
Mike is the owner of 7 Circles, and a private investor living in London. He has been managing his own money for 40 years, with some success.