Systematic Trading 1 – Theory
Today’s post is our first visit to Robert Carver’s other book – Systematic Trading.
Contents
Robert Carver

We met Rob when we looked at his book Smart Portfolios.
- Then before we could start on this book, he published a third – Leveraged Trading, which is essentially a simplified version of this book.
I first found Rob though his website (This Blog is Systematic) after liking a random tweet.
Rob used to be a portfolio manager for the AHL hedge fund that was part of the Man group.
- He retired in 2013 and is now an independent investor (and writer).
Systematic Trading

Systematic Trading is actually Rob’s first book, but it looked quite difficult to me, so I thought I would start with Smart Portfolios.
- And then Leveraged Trading came along, so I’ve ended up keeping the first book until last.
The whole point of being systematic in your trading is to remove emotion.
- It’s a strategy for coping with the many behavioural biases that we’ve looked at before.
It should lead to outperformance (by avoiding mistakes which non-systematic traders will continue to exhibit), and can also save time and effort.
- Note, however, that systematic does not necessarily mean “fully automated”.
And you must learn to trust the system – that is, to avoid meddling with its instructions.
Types of investor
Rob says that even people who are sceptical of using trading rules to predict price movements would benefit from being more systematic in the areas of position and risk management.
He identifies three groups of investor/trader:
- Asset allocating investors, who allocate funds amongst, and within, different asset classes.
- They are sceptical about obtaining extra returns from more frequent trading.
- They mostly don’t use leverage.
- Semi-automatic traders think they have better judgement than the rules, but rely on a systematic framework for positions and risk management.
- They use leverage/derivatives, and go short.
- Staunch systems traders use trading rules as well as a risk framework.
- They may believe in their own personal alpha, or just try to access alternative (“smart”) beta – also known as factor investing.
- They may use back-testing but it’s not mandatory.
- They use leverage and derivatives (Rob recommends futures).
Behavioural finance
The first theory section of the book is largely about behavioural finance and cognitive biases.
- Rob is particularly interested in prospect theory, which explains why people run losses and cut profits, when they should do the opposite.
Rob illustrates the problem by back-testing two systems:
- the early profit taker, and
- the early loss taker.
Over 31 futures contracts, the early loss taker beat the early profit taker in 27 of them.
Over-fitting / -trading / -betting
Rob warns about three things of which too much can be a bad thing:
- Over-fitting the system’s rules to fit past data
- This will lead both to overconfidence and to future underperformance
- Over-trading, which leads to unnecessary trading costs
- It’s also the gateway drug to addictive problem gambling behaviour
- Over-betting (using position sizes that are too large)
- The easy leverage provided by spread betting doesn’t help here.
Leverage
To illustrate the dangers of using 10x leverage on equities, Rob introduces the concept of standard deviation (SD).
Standard deviation increases with the square root of time, so annual SD is around 16 times daily SD.
- This assumes 256 trading days in a year, whereas there are usually 252.
Equities have an annual SD of 20%.
If we assume a “normal” / Gaussian distribution of returns, then returns should be within one SD (one “sigma”) of the average 68% of the time, and within 2 SD 95% of the time.
- 5% of days would be more than 2 SD away of which 2.5% would be good and 2.5% would be bad.
Gearing up the 20% SD on equities to 200% (using spread bets at 10x) gives a daily variation of 12.5% (200 / 16, the square root of 256).
Once every two months, you would lose 2 SD = 25% in a day!
- Once every three years, you would have a 3 SD loss (37.5%).
Things are actually worse than this because the Gaussian distribution underestimates bad tail events by some margin (a factor of 30 at the 4 SD level).
Trading Rules
The basic assumption underlying systematic trading is that the future will be like the past.#
- So the trading rules that you use – which are essentially designed to predict future prices – should be one which would have worked in the past.
The two approaches for developing rules are data first (data-mining) and ideas first.
- Rob has a table showing the advantages of the two approaches.
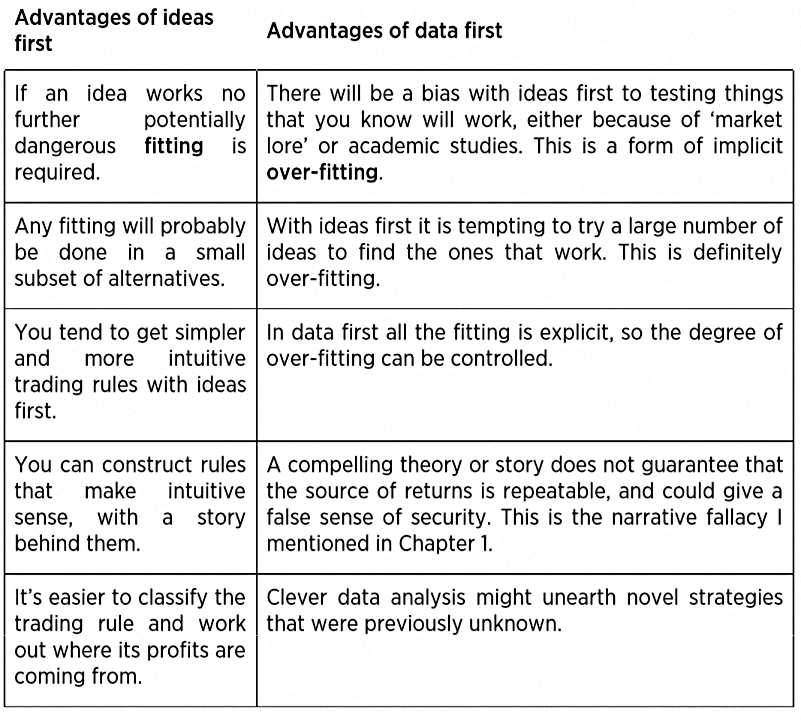
Rob favours the ideas first method, particularly for private investors who are unlikely to update their rules frequently (as might happen in a hedge fund or high-frequency trading shop).
Why rules work
Let’s look at a few of the main reasons why trading rules might work:
- Trades are essentially contracts between someone willing to take on risk (insurance sellers), and someone else who wants to avoid a particular risk (insurance buyers).
- Insurance buyers will lose on average but will avoid big losses at inconvenient times (eg, market crashes).
- The insurance selling profit is the risk premium.
- Thus riskier assets (eg. stocks) should have higher returns – in the long run – than less risky assets (eg, bonds).
- Similar reasoning underpins factors like value, momentum and (small) size – though not necessarily the low vol factor.
- People’s appetite for risk varies as the market mood swings from euphoria to panic.
- Thus profits are available from buying cheap premia and selling expensive ones – a form of mean reversion trading.
- Less liquid assets (PE, VC, land and property) can also offer outsize returns, because not everyone is able to hold them.
Rob notes that some complicated forms of trading (obscure candlestick patterns, M&A arbitrage) are difficult to systematise.
-
- Others may not have data available or may be subject to different regulatory regimes between geographies.
Sharpe ratios
The “rational investor” of academic theory compares assets using their Sharpe ratio (SR) – this compares returns to their SD to give “risk-adjusted returns”. (( Strictly speaking you should use the `excess’ return above a risk-free interest rate, but the risk-free rate is close to zero these days ))
Rob prefers the annualised SR to the daily SR.
- The annual SR will be around 16 times the daily SR.
Rob points out that assets can have the same SR but different distributions:
- The insurance sellers make steady gains with the occasional large loss, whilst insurance buyers have the opposite profile.
Skew
This feature of returns is known as skew and is a big weakness of the SR.
Confusingly (since they have consistently positive long-term gains), equities have a mildly negative skew.
- They rise slowly most of the time but occasionally fall quickly.
Most people disklike negative skew, which is why there is money to be made from selling them insurance against it.
- Positive skew is attractive, which is why people buy lottery tickets and blue-sky stocks.
Of course, selling lottery tickets is usually more profitable.
Leverage
Because most people won’t / can’t use leverage, high SR assets with low returns but even lower volatility are not attractive to them.
- Instead, they buy assets with lower SRs but higher returns.
Using leverage will lead to outperformance in good times, but too much juice can lead to a liquidity crisis (margin calls and forced sales) in a crash.
Rob is wary of gearing up low-risk (low volatility) assets and trading styles which might have a negative skew.
Trading styles
Trading strategies can be static (buy and hold) or dynamic (active trading).
- Dynamic styles involve rebalancing, either towards cash targets or towards volatility targets (risk parity/volatility standardisation).
Law of active management
Rob next introduces the “law of active management”:
The Sharpe ratio of a trading strategy will be proportional to the square root of the number of independent bets made per year.
This is a strange idea, as it implies that the more you trade – and the shorter your holding period – the better you will do.
Luckily the theory is flawed:
- People are not equally skilled across trading speeds.
- Assets behave differently over the short- and long-term (momentum vs mean reversion).
- Transaction costs add up.
At the same time, Rob concedes that most trading rules will have declining SRs for holding periods that are longer than several months.
The other important conclusion is that trading multiple uncorrelated assets will improve your SR.
- Rob says that four assets with zero correlation will double your SR.
With enough assets, you can triple your returns.
Trading speed
Rob doesn’t recommend slow systems (average holding period: several months to many years).
- Medium systems (average holding period of a few days to several months) are better.
Fast systems are too expensive (in terms of trading costs) for private investors.
Crowded trades
Rob warns against joining crowded trades when most market participants have the same bet on.
- This can arise from trend-following or contrarianism.
When everyone is in the market, its time to get out.
Achievable Sharpe ratios
Rob expects stocks to return 3% pa real in the future.
- Higher returns in recent decades have been driven by the decline in interest rates and inflation.
With an annual standard deviation of 20%, this gives a baseline SR of 0.15.
- A portfolio of 20 stocks from the same country – or an index like the S&P 500 – might have an SR of 0.20
A globally diversified portfolio could reach an SR of 0.25
- Multiple asset classes could bring this up to 0.40 – double what you would get from a single equity index.
A dynamic trading strategy with a diversified set of rules should produce an SR of 0.40 on a single instrument.
- With multiple asset classes, this could rise to 0.80
When someone tells you of a back-tested strategy with an SR or 2 or more, this will have been achieved through over-fitting.
- Not even hedge funds can sustain an SR of more than 1 over a period of several years.
Conclusions
This has been a terrific start to what I hope will be an important book.
- We’ve actually covered about 20% of the book today, and the hard theory is now out of the way.
Rob concludes by saying:
A balanced combination of trading rules, with different styles that work in different environments, is better than any single alternative. Finding the best rules is less important than designing your trading system in the correct way.
In the next article, we’ll get down to practicalities.
- Until next time.
Mike Rawson
Mike is the owner of 7 Circles, and a private investor living in London. He has been managing his own money for 40 years, with some success.