All About Asset Classes
Today we’re going to look at Asset Classes.
Contents
Asset Classes
We’ve written about asset classes before:
- we’ve stressed the importance of asset allocation
- we’ve looked at the returns from various model portfolios
- we’ve used an asset allocation plan to build an investment trust portfolio
Today we’re going to look at the characteristics of the various asset classes and sub-classes themselves and which ones suit which purposes.
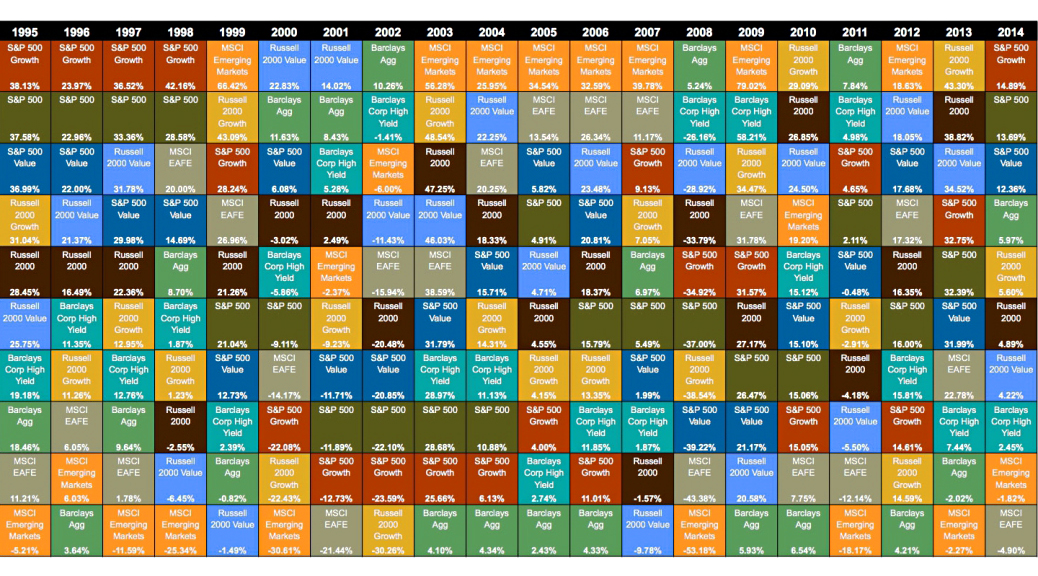
Many of you will recognise the picture at the top of the post. It’s from a report published each year by Callan Associates called The Periodic Table of Investment Returns. You can get the 2014 version here.
The table shows the returns from various types of investment – asset classes – over the twenty years from 1995 to 2014. The assets are colour coded and ranked in each column (each year) from highest return to lowest.
The resulting jumble of colour as the rankings change each year is intended to make the case for diversification across asset classes (stocks, bonds etc), and also across sub-class dimensions such as “factors” (growth vs. value, large cap vs small cap) and geography (in the case of the table, which is US-centric, US vs. non-US).
Let’s look at how a UK investor might apply that conclusion in practice.
Returns
As investors, we’re after returns. The bigger the better.
Historically, the best returns have come from equities.
We have no way of knowing whether equities will have the best returns in the future – and we can be certain that the future won’t be exactly the same as the past – but the past remains or best guide to the future.
Volatility
So why not just invest in equities? The answer is volatility. (Note that this is not the same as risk, which we’ll come to later.)
Returns from stocks bounce around a lot from year to year. In particular they suffer from larger drawdowns (losses) than other assets.
Whether a drawdown is a big problem for you is will depend on your time-horizon. If you don’t need the money right away, you don’t have to sell during the drawdown, and you don’t have to convert your paper losses into real ones.
Another way that having a long time horizon helps is that with equities, volatility decreases with time. Whether the market is up or down today is almost a 50/50 bet, but if you can wait 10 years, you’re almost certain to be ahead.
Because of this, the best way to approach investing is to view it as a life-long quest for financial independence.
You need to accumulate enough funds so that you can reasonably draw from your pot each year to fund living expenses, without undue risk that you will run out of money.
This perspective gives you a 50+ year investment horizon, and lots of temporary issues just disappear.
Inflation, tax, costs, income and valuations
There are five other considerations when looking at returns:
- inflation – though it’s not a major factor at the moment, the only sensible way to approach returns is to look at them in “real” terms (ie. after inflation has been deducted)
- tax – some assets have a preferential tax treatment compared to others, and this will impact an investor’s after-tax returns
- costs – some assets are so expensive to deal in or to hold that it becomes impossible for the average private investor to make a decent return, even if the underlying asset is sound
- income – some assets produce a regular return each year (a rent, or a dividend) and may be particular attractive to investors seeking a regular return ((Though in practise this can also be achieved by selling a proportion of the asset each year; it should also be noted that if income is withdrawn and spent as it is earned, overall returns over the long-term will be significantly lower ))
- valuation – returns are not constant, and in particular returns are likely to be lower when an asset is bought at a high valuation, and likely to be higher when something is bought at a low valuation; this is a form of reversion to the mean
Working out high and low valuations is another matter, but it is important to consider future market conditions when making an investment.
For example, bonds are currently in a 30-year bull market and are benefiting from historically low interest rates. When (if?) interest rates rise, returns are likely to fall, so many investors will have a lower exposure to bonds than under more “normal” conditions.
Diversification and correlations
To smooth out equity returns, investors diversify across asset classes, expecting that good returns from other assets will offset a bad year for equities.
Whether this happens in practice depends on the correlation between the returns of equites and the alternative asset. We’ll look at correlations from a home country equities perspective – how highly are other assets correlated with UK stocks.
Correlations were historically quite low and stable, but in recent years they have been increasing. In particular, correlations increase in a crisis, meaning that they don’t offer as much equity drawdown protection as might be expected.
This does not mean that a well-diversified portfolio can’t produce higher and less volatile returns than an 100% equities portfolio, in the long-term.
Two other considerations when diversifying are liquidity and rebalancing.
Cash is the most liquid asset, but in practice, most exchange-listed products (ETFs, investment trusts etc.) have acceptable liquidity.
- Liquidity is a bigger issue for some real assets, like property, and some forms of lending (such as P2P debt).
A diversified portfolio will need regular – say annual – rebalancing back to its original composition in order to make the most of the differing returns of the various asset classes.
Risk
We’ve already noted that volatility is not risk, even though some famous financial theories and equations treat it as such.
Instead, as Warren Buffett says, risk is the potential for a reduction in the investor’s purchasing power.
So cash, over the long-term, is a risky asset because it has the potential to underperform inflation. It is not volatile, and – thanks to government guarantees – usually there is no risk of complete loss of capital.
Yet it remains risky on one of the three dimensions (volatility, loss, inflation).
A fourth aspect of risk is FX risk. We will approach asset allocation from the perspective of a UK investor, who needs to spend money measured in pounds Sterling.
So assets measured in other currencies have an additional risk. Over the long-term, FX fluctuations are not likely to be significant, and hedged products are sometimes available, but they are real.
Vehicles
For a long time, UK private investors had a simple choice between buying individual stocks, or buying unit trusts (now called OEICs) direct from the fund manager. Investment trusts existed, but few people heard about them because unlike OIECs they didn’t pay financial advisers a commission.
Then index-tracker funds came along, and the fund supermarket platforms were created. ETFs were invented and fund commissions were scrapped. The internet led to products like P2P lending and crowd-funded equity.
So where does that leave us today?
- ETFs should be – but usually aren’t – the starting point for most people’s portfolio; they are cheap and allow access to a large variety of asset classes via passive index-tracking
- Investment trusts offer a cost-effective way to diversify between passive and active management
- OIECs are really a legacy product, but the removal of commissions has made them more competitive with ETFs and it may not be worth the trouble of moving a large existing portfolio from a fund platform
- Individual stocks are also a viable approach, particularly in your home country
Niche products include P2P, crowd-funding, VCT, EIS, SWAG (stamps, wine, art and gold) and currencies (including crypto-currencies like BitCoin).
That concludes our run-through of terminology. So now that we understand the territory, let’s begin to make our map.
At the highest level, the split in assets is between ownership (stocks and physical assets) and lending (cash, debt and P2P).
We’ll start with UK stocks.
UK Equities
Equities will form the bulk of our hypothetical portfolio, and UK equities the largest proportion of that.
So we’ll use them as the baseline for our assessments of other assets – we’ll evaluate their properties relative to those of UK stocks.
- Mainstream UK stocks should produce good real returns over the long-term (subject to the caveat about valuation, above) but will be volatile.
- They are cheap to access via trackers, ETFs, investment trusts or directly
- They can be held in tax sheltered accounts (ISA, SIPP etc.)
Apart from the volatility risk, they score well on the risk of loss, should cope with inflation, and have no FX risk. So overall they get a medium score for risk.
Flavours of UK equity
There are several flavours of UK equity apart from the main FTSE-100 stocks:
- small companies often perform better than large ones over the long run
- dividend stocks can be used to produce regular income; around 50% of long-term equity returns come from from the re-investment of dividends, so if they are withdrawn and spent as they are earned, then long-term returns will be that much lower
- unlisted stocks can outperform, but are risky; for higher rate tax payers who have used up their SIPP allowance, the tax advantages of VCTs are attractive
- private equity is another variety of unlisted equity that can be accessed via investment trusts
Allocation to UK equity
So the big question is what sort of allocation do we need to UK equities. I’ll work backwards:
- as we’ll see when we come to look at property below, the average UK investor aiming at financial independence will end up with a house that makes up around 30% of their net worth
- equities should be the main part of what remains, so let’s say between 50% and 75%
- that translates to between 35% and 53% of net worth – we’ll stick with round figures and say 35% to 50%
- this can be spread as you wish between the five categories of UK equity, but unlisted and private equity are niche investments and should together probably be below 5% of net worth
I should point out at this stage that equities regularly go down by a significant amount – 20% or more in a single year. Less regularly – perhaps once or twice in an investing lifetime – they may go down by 40% or 50%.
So with 35% to 50% of your net worth in equities, you’re looking at regular drawdowns of 7% to 20%, and occasional falls of 14% to 25%. If this is something you can’t countenance, you might have to dial back your equity allocation.
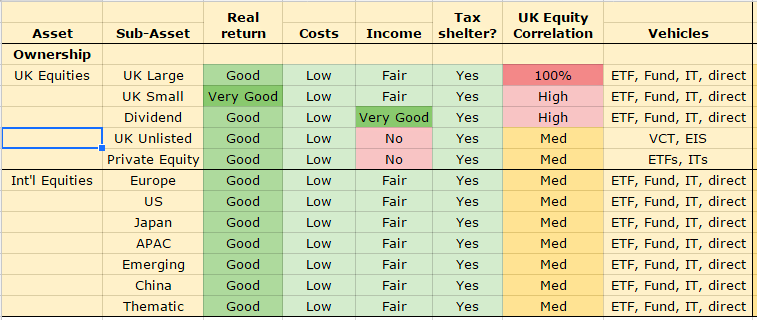
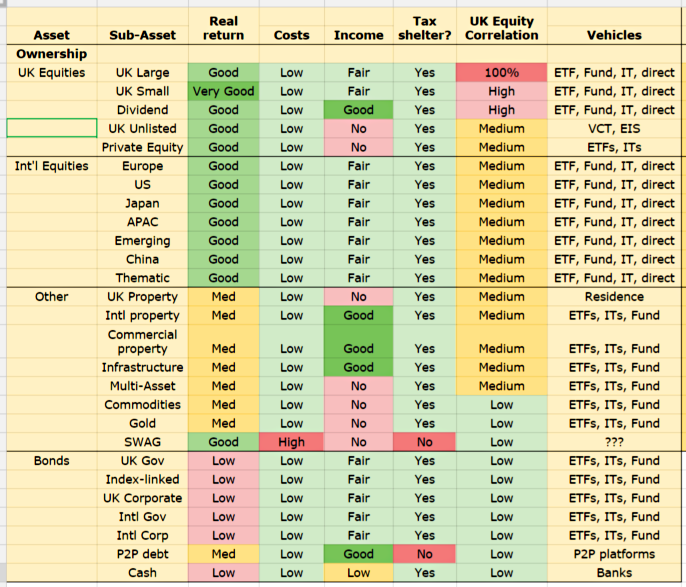
For those of you who prefer diagrams to a wall of text, here’s a table summarising what we have covered so far:


International equities
But we have forgotten about international equities. This is basically just a geographical variation on UK equities.
The UK stock market makes up only 7% of the global market. As you would expect the US dominates.
Everybody will have their own version of how to divide up all the markets of the world, but here’s mine:
- Europe
- US
- Japan
- Asia Pacific (APAC) excluding Japan
- Emerging markets
- China
We can also add “thematic” investing here, for example technology or biotechnology.
International equities share most of the characteristics of UK equities, but have lower correlations to the UK market. In exchange for this they add FX risk.
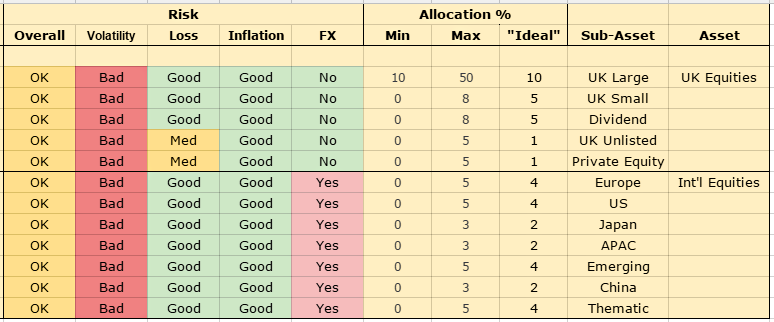
I’ve gone for a simple 50/50 split between UK and international stocks, and adjusted the allocation percentages accordingly.
Here’s how the table looks now:
Property
For most UK investors, the most significant asset class after equities is property.
Many of the US-focused financial sites are cool on property as an investment asset, but here in the UK conditions seem to be different:
- the UK’s population is growing
- planning regulations mean that supply of new houses is inadequate
- the UK has historically had high levels of ownership
- buying a house is tax advantaged (no capital gains on sale of your primary residence)
For this reason I believe that most UK investors targeting financial independence will own a property.
Using round numbers, the average UK property is approaching £300K and the average pot needed for FI (including this house) will be around £1M, so we can use 30% as the average property allocation.
The good news is that property prices are not that closely correlated to UK stock prices, so this won’t destroy your portfolio.
If you want more exposure, trusts featuring UK commercial property, and international property are available.
Other physical assets
We can divide these into three groups:
- infrastructure funds, designed to produce a regular income over the life of a project
- commodities, of which there are several sub-categories:
- energy (oil, gas, etc.)
- agriculture (wheat, corn, soybeans, cotton, sugar, coffee, cocoa)
- livestock (cattle, hogs etc.)
- metals both industrial (iron, aluminium, copper etc.) and precious (gold, silver etc.)
- SWAG (stamps, coins, wine, art and gold) – I would substitute cars, boats and planes for gold in this grouping
Infrastructure fund and commodities – and the multi-asset funds that combine the two – can be useful diversifiers as a small proportion of a portfolio. ((Hedge funds can be added somewhere around here, if you still have faith in any of them )) The question is whether the small benefit is worth the effort.
Each investor must answer for themselves, but they are likely to be more relevant to larger rather than smaller portfolios.
SWAG has shown excellent returns in recent years, and for some types of SWAG, over the long run.
The problem for private investor is accessing these assets at a reasonable cost. (See my article on stamps for more detail). For this reason it is not included in the portfolio.
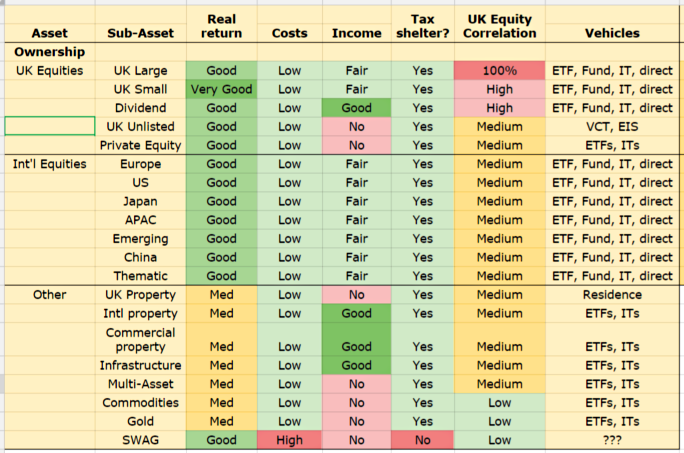
Here’s how the table looks now:

Lending assets
We’ve now allocated 80% of our portfolio, which leaves 20% to spread across the lending assets – cash, bonds and P2P lending.
There are five types of bond available: ((There are actually six, but we’ll ignore high-yield or “junk” bonds as too risky for the returns they offer to a diversified portfolio ))
- UK government bonds, which are “risk-free”
- Index linked bonds, which protect against inflation
- UK Corporate bonds which are riskier but should produce higher returns
- International government bonds, again risk-free in theory, but with FX risk
- International corporate bonds – the riskiest of the lot, but with potentially higher returns
These are unusual times for bonds – record prices at the end of 30-year bull market, record low yields because of record low interest rates – but we’ll ignore this for the purposes of setting a default allocation.
Cash
Let’s start with cash. It’s very safe – guaranteed up to £75K per bank account – but has low returns.
We need an emergency fund of six months’ living expenses. For the typical UK investor reaching financial independence, this could be as little as 1-2% of net worth. Most people will feel more comfortable with more cash than this, so let’s say 5%.
P2P lending
P2P lending is sold as a sexier version of a bank account, with higher returns in exchange for tying your money up for a while.
But there’s no government guarantee if the people you are lending to can’t or won’t pay up, and the system hasn’t been tested through a complete credit cycle.
It’s also the case that the lending rules have been relaxed as the sector has grown. Finally, P2P is currently not eligible for tax shelters.
For these reasons, I’ll limit our allocation to 5%. (If you want to know more about P2P lending, try my article on the sector here.)
That leaves 10% to spread across the four types of bond.
Here’s the final version of the table:

Bargepole assets and vehicles
Apart from junk bonds and SWAG, which we have already discussed, only four of the items mentioned in our initial survey of the terminology have not been included in our hypothetical portfolio. They form two groups:
- Currencies, including crypto-currencies like BitCoin
- EIS and crowd-funding
EIS and crowd-funding are both forms of equity investment in the very smallest and riskiest of companies. EIS is tax advantaged and crowd-funding is not.
I think that both of these products are too risky for the average private investor. Most of the upside from these investments can be achieved through less risky products such as Private Equity funds, VCTs and AIM stocks.
Currencies are a zero-sum game in the long run, and best left to those with day-trading aspirations.
Conclusions
There isn’t space in a single article like this to cover all types of asset in great detail.
What I’ve tried to do is look at the main characteristics of each class, and examine how a UK investor might use them to construct a portfolio for the long-term.
Allocation percentages are just suggestions, and everyone will choose their own numbers. Let me know about yours, especially if they are significantly different to mine.
And if you think I’ve made a big mistake, or forgotten about something, tell me in the comments.
Until next time.
Mike Rawson
Mike is the owner of 7 Circles, and a private investor living in London. He has been managing his own money for 40 years, with some success.


Great article Mike. For investors starting out with a small pot of less than £5k or those investing for children with say a £1K starting point I recently read an article in the FT Money section suggesting a Global Tracking fund or ETF would be a good start in order to maximise the spread of assets whilst keeping costs down. Would you agree with this approach? What sort of size pot would you need to start implementing the above?
Hi Martin,
I think with £1K you should definitely be looking at something like a global tracker.
A fully diversified portfolio would need anything from half a dozen to 50 underlying investments, so the size of pot needed is in the £10K to £100K range.
I like to think of it as a spiral – you start in the centre with the plain vanilla stuff, and as you keep adding money to your retirement pot through the years, you move on to more exotic stuff.
Since you invested there earlier, you should end up with more cash in the core areas by the time you get to retirement.
Mike
Very helpful summary and table, thanks.