Alpha from Short-term Signals
Today’s post looks at a recent paper from Robeco on obtaining alpha from short-term signals.
Contents
Robeco

The paper has five authors, all from Robeco.
- The only one I have come across before is Pim Van Vliet, who rose to prominence when he wrote a book about the low vol phenomenon (that less risky stocks outperform more risk ones, which is against the Capital Asset Pricing Model).
Existing models
Prevailing asset pricing models [use] a limited number of fundamental factors, such as size, value, profitability, and investment. These factors have a low turnover, and their premiums are expected to materialize over multi-year periods. In the short run, however, they can experience large and prolonged drawdowns.
This paper looks at short-term signals that are often ignored – including by index- and ETF providers – because of potentially high trading costs and the lack of risk-based explanations for the returns.
- The authors argue that the Fama-French bias toward small caps (which have been historically expensive to trade) has contributed here.
Trading costs are less of an issue these days, but still not negligible.
These short-term signals provide a string of many small consecutive alphas from entirely different portfolios every month.
The idea is to combine multiple short-term signals with low correlations (eg. momentum and reversal) to combat volatility.
- Another improvement is to only drop stocks from portfolios when their attractiveness drops below a threshold, rather than create a totally fresh portfolio each month.
This is a better match to the way private investors manage their portfolios.
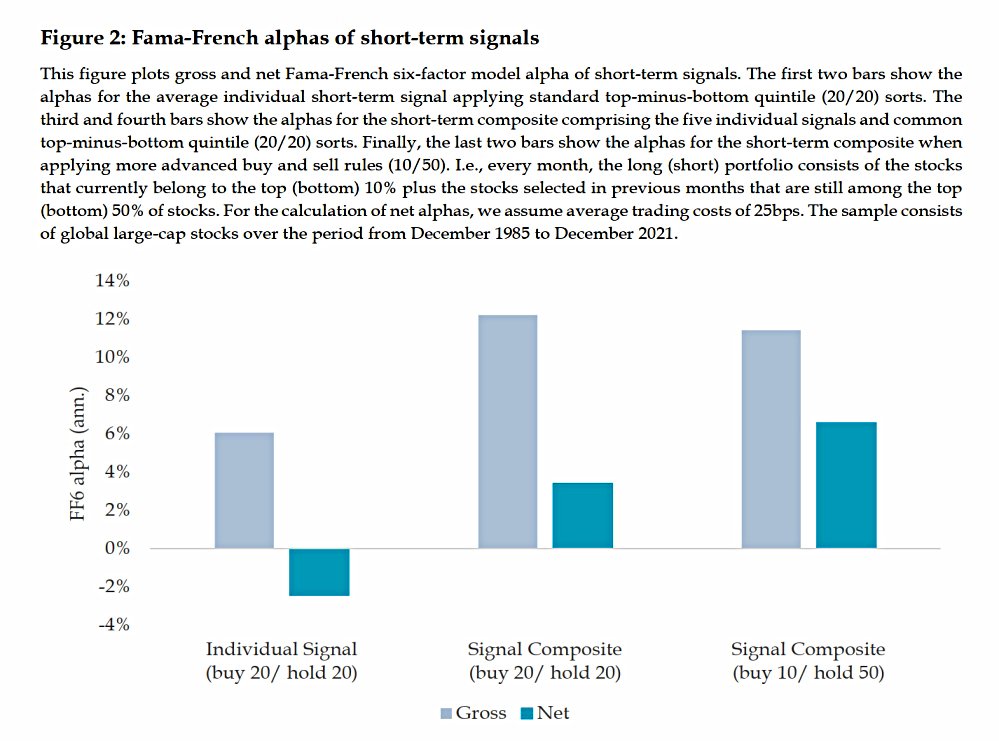
Applying more sophisticated buy and sell rules on the composite only slightly decreases the gross alpha but lifts the annual net alpha above 6% due to substantially lower turnover.
Methodology
The paper looks at all stocks in the MSCI World/ FTSE Developed indices from 1985 to 2021 (an average of 1,750 stocks).
- The five signals used are listed in the table below.
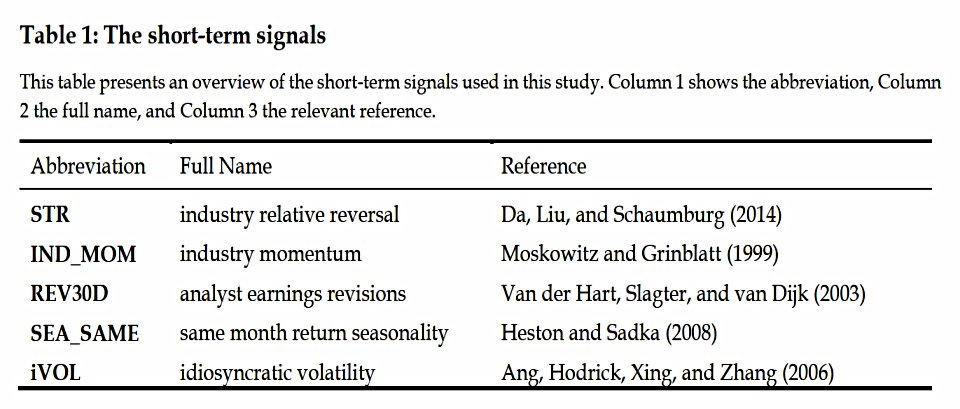
- Stocks with low (high) returns (relative to their industry) over the previous month tend to outperform (underperform) over the next month.
- This is price momentum (from the industry).
- This is earnings momentum (from analyst estimates).
- This uses historical seasonal monthly returns for the forthcoming month over the previous ten years.
- This subtracts French-Fama market, size and value factors from base volatility to calculate idiosyncratic volatility for the stock – low vol predicts higher returns.
There is also a composite signal created by averaging the normalised scores from the other five signals.
All of the signals are calculated separately within regions (North America, Europe and Japan/APAC).
Portfolios consist of the top 10% of stocks that month, plus previously selected stocks that remain in the top 50% of scores.
- The same approach (in reverse) is used for short portfolios.
Results
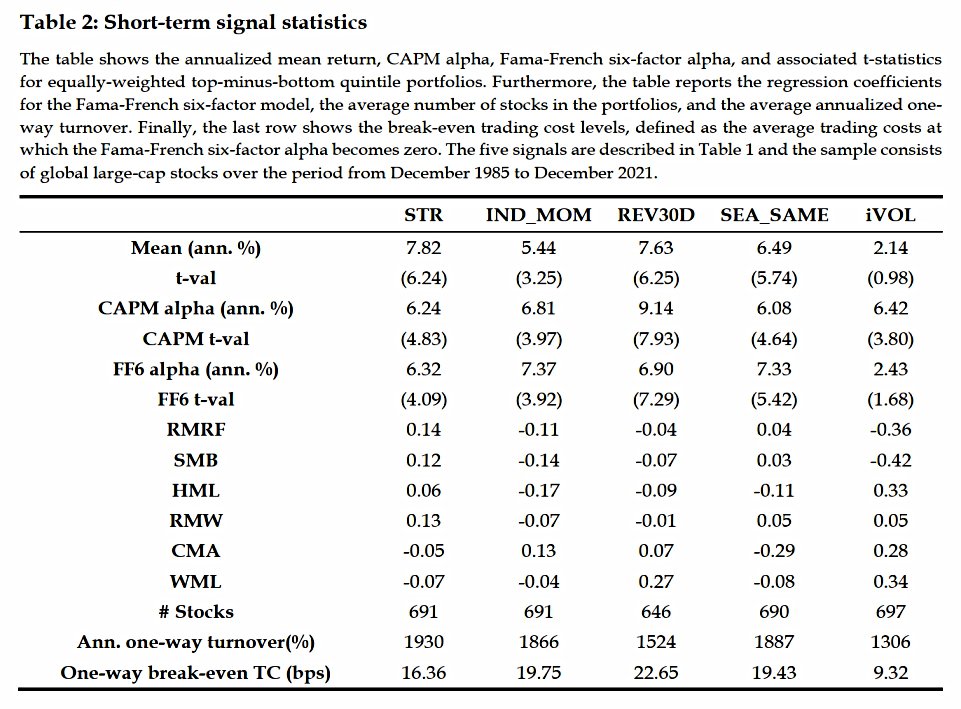
The annualized mean returns range between 5% and 8%. The CAPM alphas range between 6% and 10% per annum. However, this comes at the price of a very high turnover, which is between 1300% and 2000% per annum.
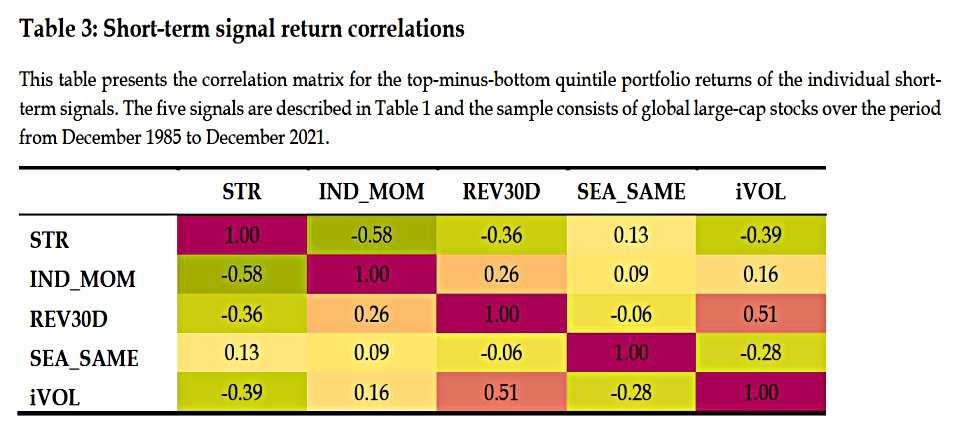
Luckily, correlations between signals are low to negative, which means that diversification benefits are available from combining the signals.
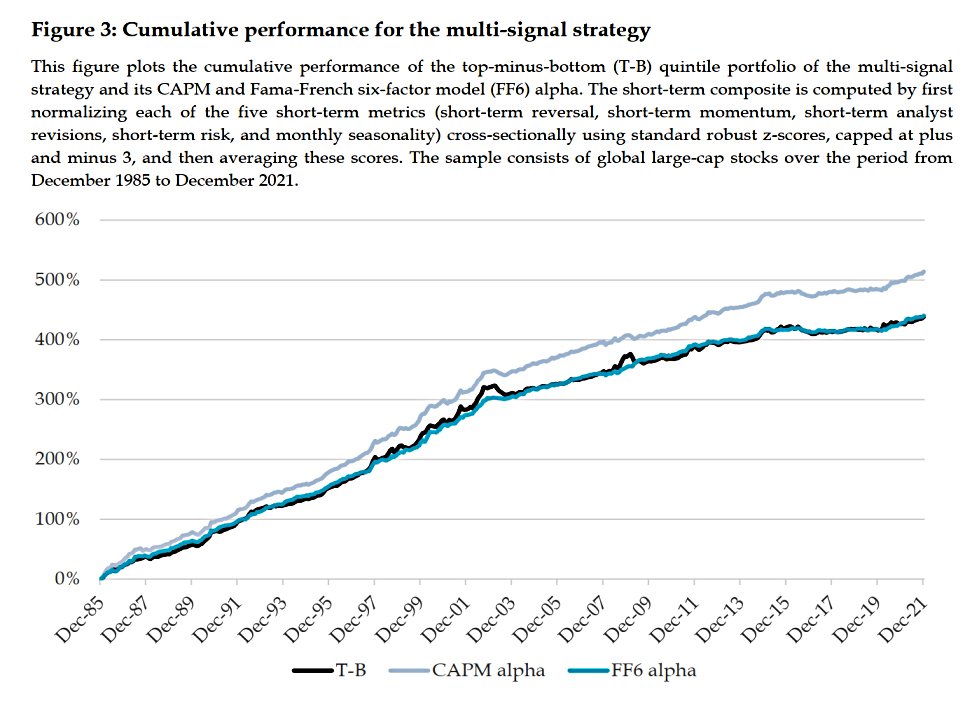
Composite approach
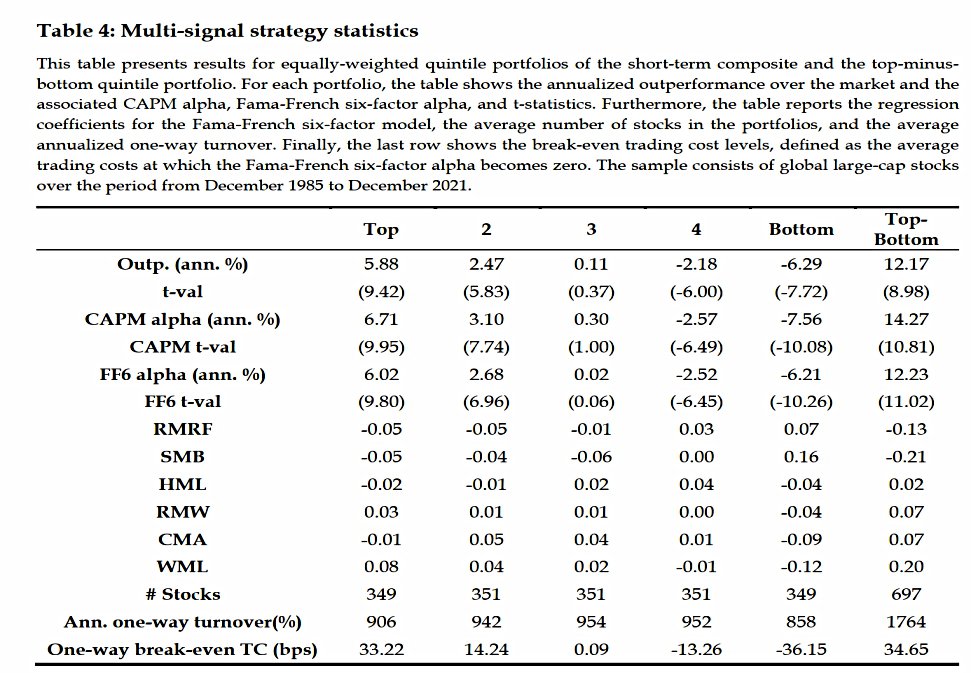
We find a monotonously decreasing return pattern going from the portfolios with the best (Q1) to the worst (Q5) short-term combined scores. The resulting top-minus-bottom quintile has a mean return (CAPM alpha) of more than 12% (14%).
Turnover is still 1800% pa, but this is low enough to deliver positive (and relatively consistent) returns.
Minimising trading
The next step was to apply the “top X% plus previous choices still in the top Y%” rule.
To ensure that the strategies roughly contain a similar number of stocks we simultaneously apply stricter thresholds for X when we relax the threshold for Y. More specifically, we use 15%, 10%, and 5% for X, and for Y, we consider 30%, 50%, and 70%, respectively.
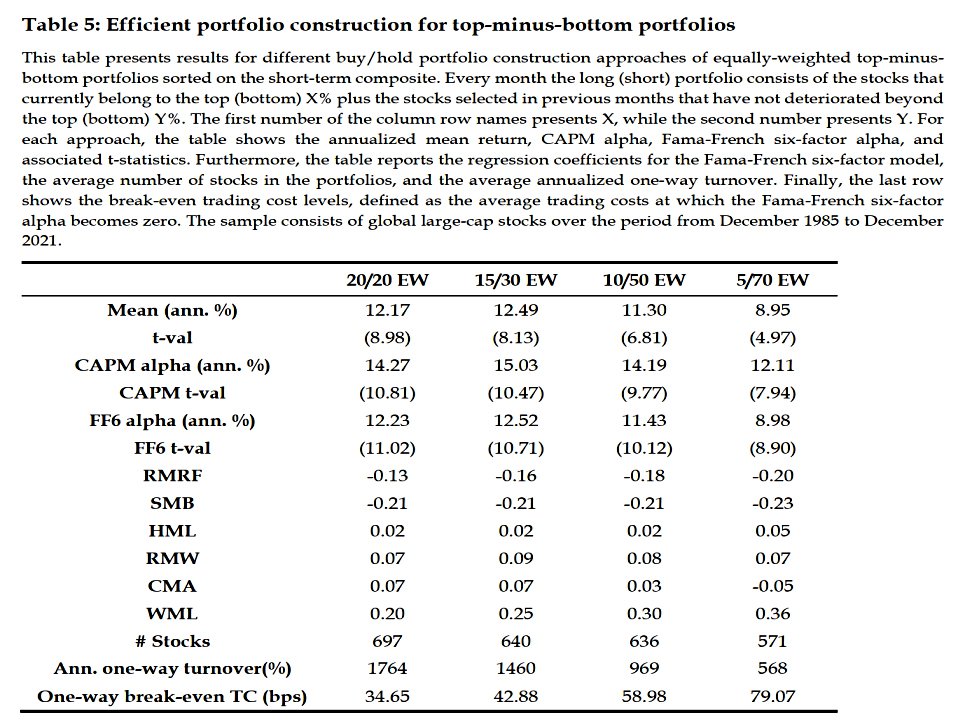
All of these options increase the break-even trading costs level.
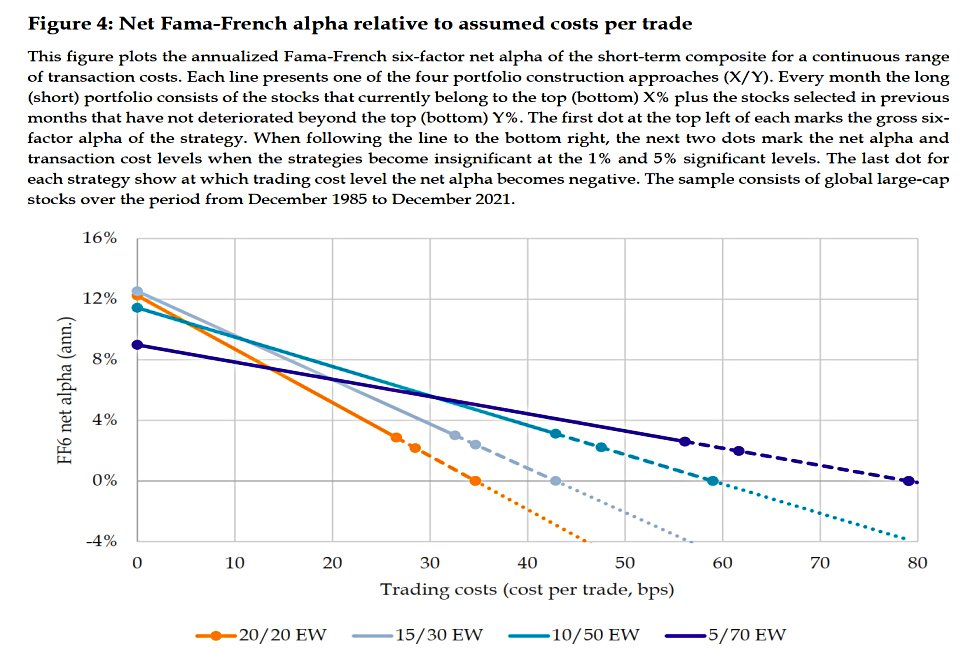
We conclude that the composite strategy is able to generate economically and
statistically significant net alphas, at least when efficient trading rules are applied.
Long only
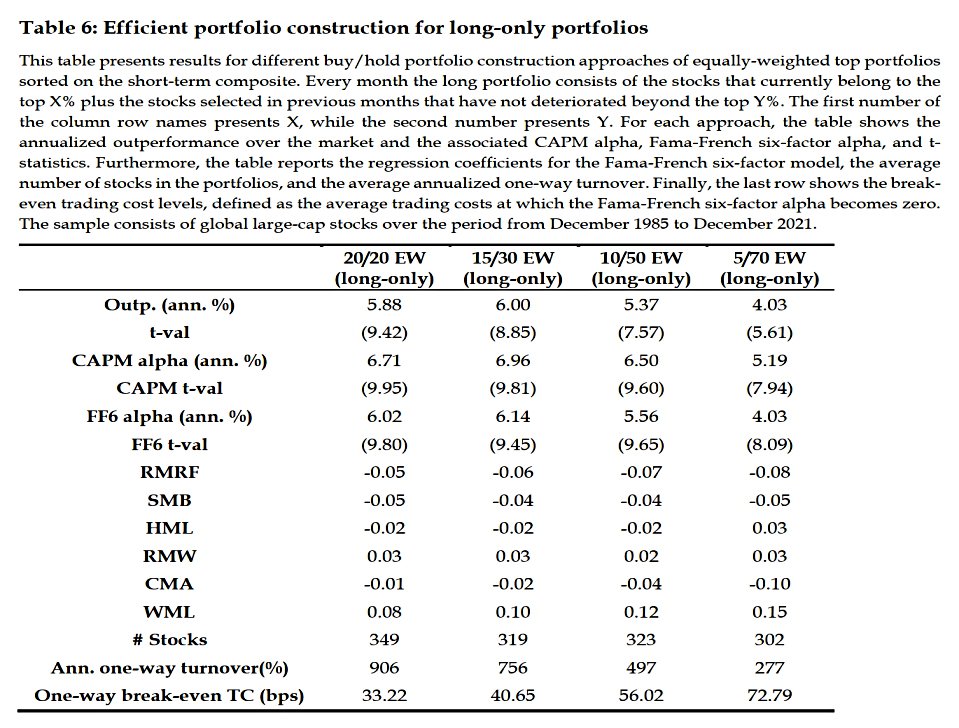
Mean returns, CAPM alphas, and Fama-French six-factor alphas are roughly half for all four portfolio construction approaches.
However, as the turnover and volatility of the returns are also approximately half, t-values and break-even trading costs remain nearly unchanged. Our base results remain strong in long-only applications.
Implementation lags
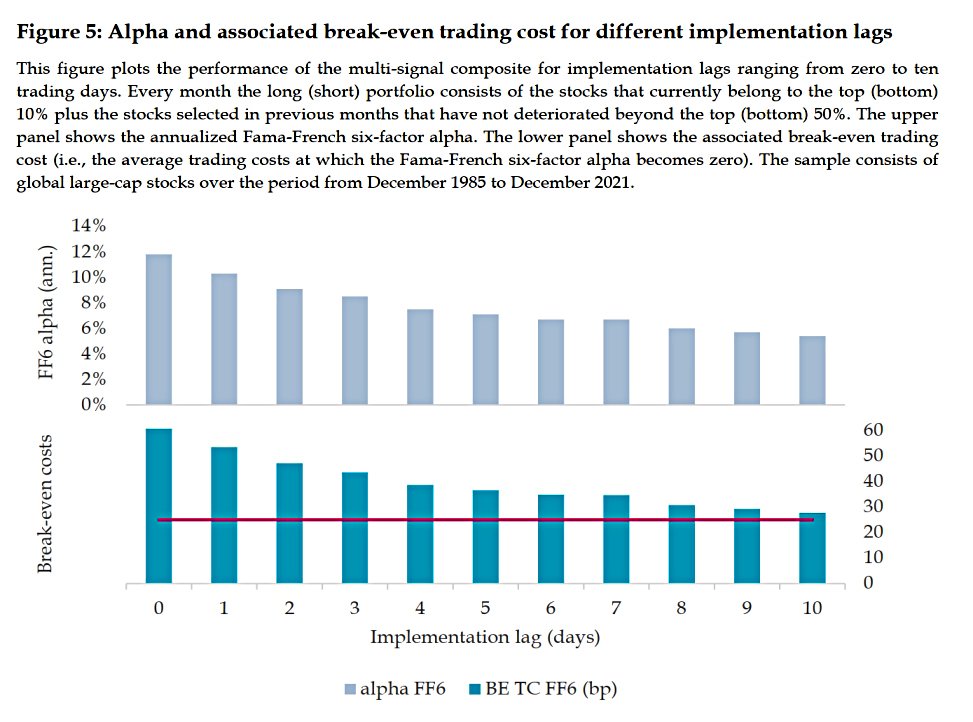
Robeco looked at the effect of waiting for various periods of time after the signals were generated.
- The composite signal was profitable right up to a ten-day delay, though in practice one or two days of implementation delay should be sufficient.
Number of signals
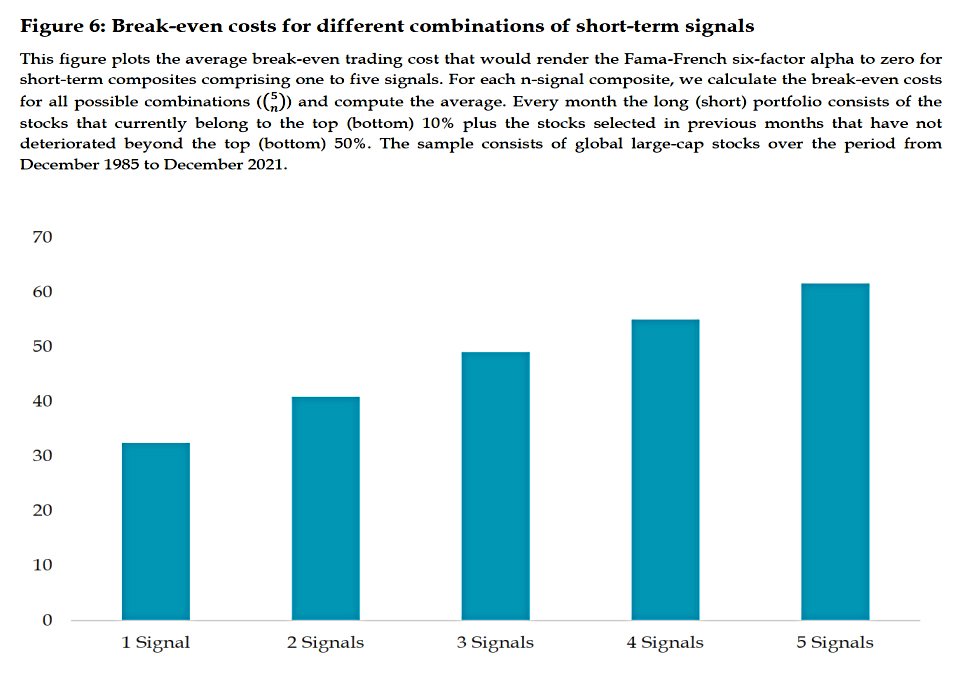
We analyze to which extent our results depend on the number of included short-term signals in the composite. The average break-even costs for individual signals are slightly above 30 bps and monotonously increase when more signals are added.
Regional diversification
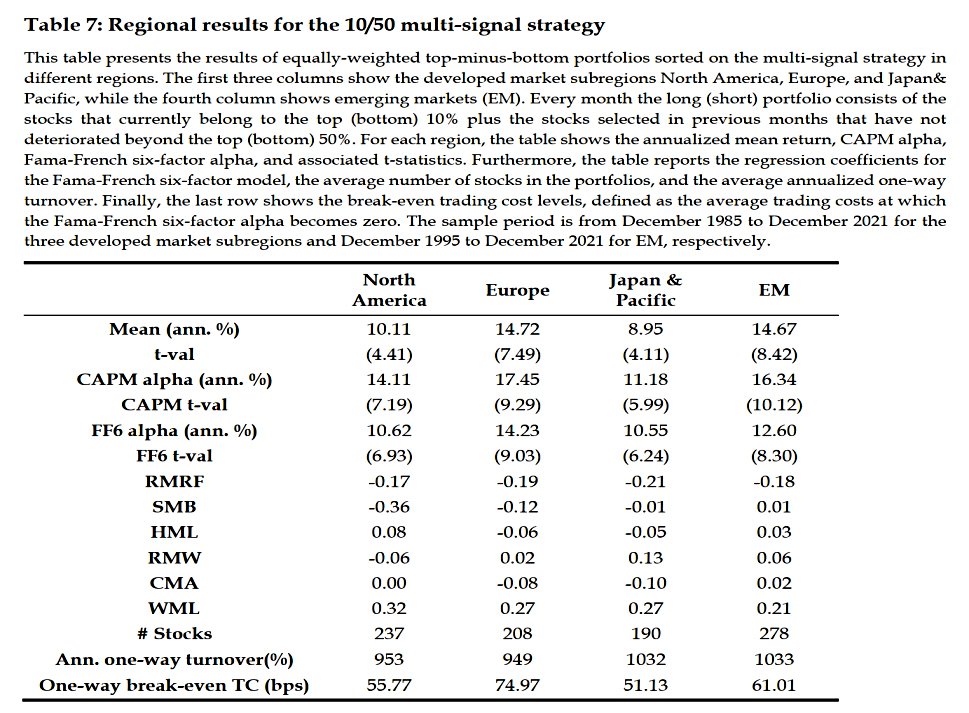
The composite strategy performs best in Europe, followed by North America and Japan & Pacific. However, even for Europe, the t-statistics for the six-factor alpha are not as strong as for the global strategy, which highlights the benefits of diversifying across regions.
Conclusions
The paper demonstrates that high-turnover signals that have been largely ignored due to trading costs and market frictions can be combined into a profitable composite signal when trading costs are minimised through the use of the most liquid stocks and efficient portfolio construction (buy and sell rules).
The strategy also passes a number of robustness tests:
- the results stand up in a long-only implementation
- they survive an implementation lag of one or two days
- the strategy works in all regions and benefits from regional diversification
Whether these signals are easy to implement for private investors is another question for another day.
- Until next time.
Mike Rawson
Mike is the owner of 7 Circles, and a private investor living in London. He has been managing his own money for 40 years, with some success.