Payoff Diversification and Ensembles

Today’s post looks at a couple of short papers from Flirting with Models, about Payoff Diversification and Ensembles.
Contents
Payoff Diversification and Ensembles

The papers date back to 2020 and are both written by Corey Hoffstein.
- Corey is co-founder and Chief Investment Officer of Newfound Research, the quant asset manager where the Flirting with Models blog resides.
Diversification

At Newfound Research, diversification is viewed in three dimensions:
What is the diversification most investors are well-versed in – correlation-based diversification between securities, assets, macroeconomic factors, and geographic regions.
When [is] “opportunity diversification” because it captures the opportunities
that are available when we make investment decisions. This is well acknowledged in private markets where investors often allocate to multiple fund “vintages”.How is “payoff diversification” – every investment style creates a particular shape.
I usually refer to opportunity diversification as time diversification, and to payoff diversification as strategy diversification.
Rebalancing
Any and all trading decisions create a “payoff profile.” These profiles often
fall into two categories: concave strategies that do well in stable environments is
maintained and convex strategies that do better in the tails.
Corey begins by looking at the 60/40 portfolio and the effect of rebalancing back to that allocation.
- Rebalancing helps when relative performance (between stocks and bonds) mean reverts, and hinders when relative performance continues (shows momentum).
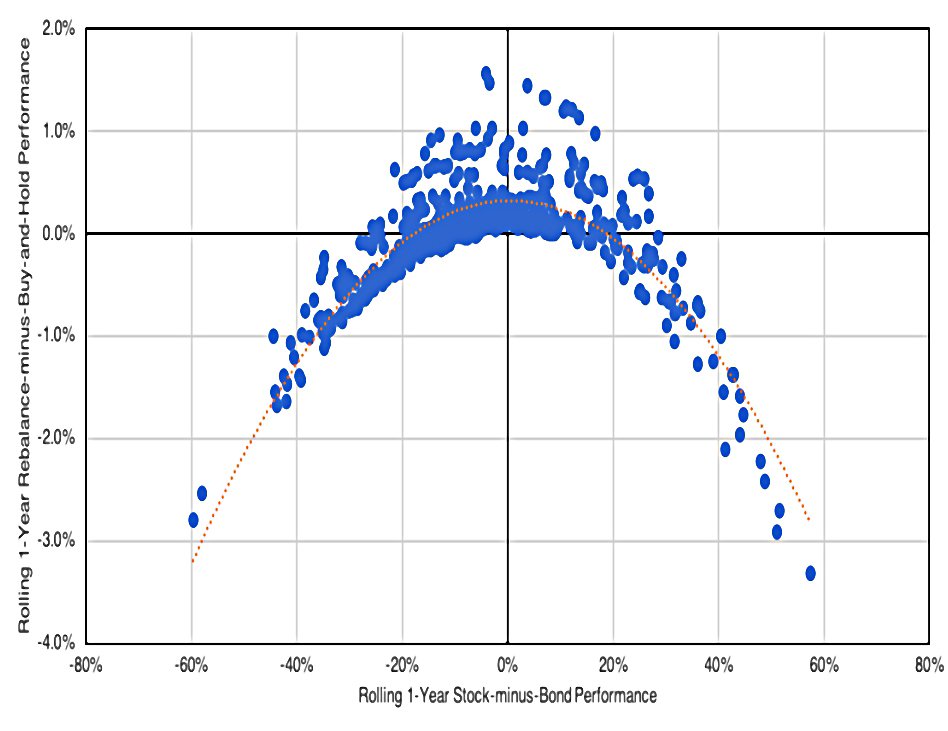
Here the Y-axis plots the impact of rebalancing and the X-axis has bond outperformance (over rolling 1-year periods) on the left and stock outperformance on the right.
What we can see is a concave payoff function. When equities significantly out-perform, the rebalanced portfolio under-performs the drifted portfolio. Similarly, when bonds significantly out-perform, the rebalanced portfolio under-performs.
When the return spread between stocks and bonds is small – mean-reversion – rebalancing generates a positive return.
Corey defines this in option terms as a strangle.
The seller captures the premium when the realized spread remains small but loses money when the spread is more extreme.
Momentum

This is the payoff profile of what Corey calls naive momentum – buying whichever asset (stocks or bonds) has the highest trailing 12-month return.
As this approach is explicitly trying to capture auto-correlation in the return spread between stocks and bonds, we would expect to see almost mirror behavior to the payoff profile we saw with strategic rebalancing.
This is a convex return profile – we profit when the return spread is large and lose money when it is narrow.
Corey reframes this as a straddle in options terms:
The buyer pays a premium but captures the spread when it is extreme.
There is also a scale difference:
The payoff profile for the rebalanced portfolio was between -3.0% and +2.0%, the payoff profile for this momentum approach is much larger, ranging between -30.0% and 40.0%.
Payoff diversification
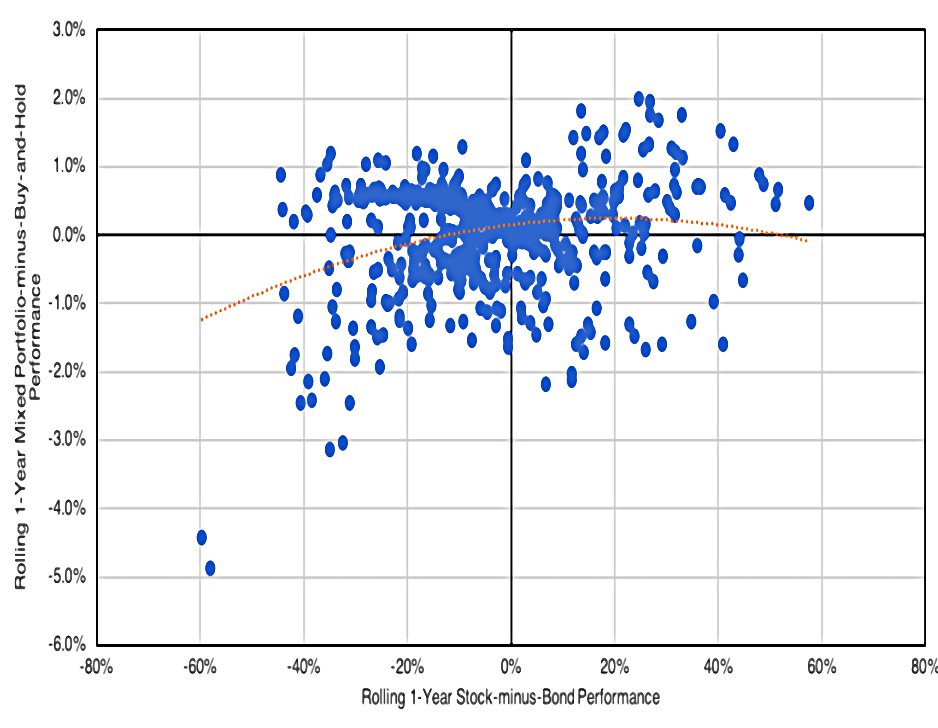
This is the payoff profile for 10% momentum mixed with 90% rebalancing.
- 10% was chosen because the Y-axis on the momentum chart was ten times larger than that of the strategic rebalancing chart.
Because the underlying profiles are mirror images, the combination is roughly neutral t o the spread in stock and bond returns.
Variations within a strategy
The second paper looks at variations within a strategy.
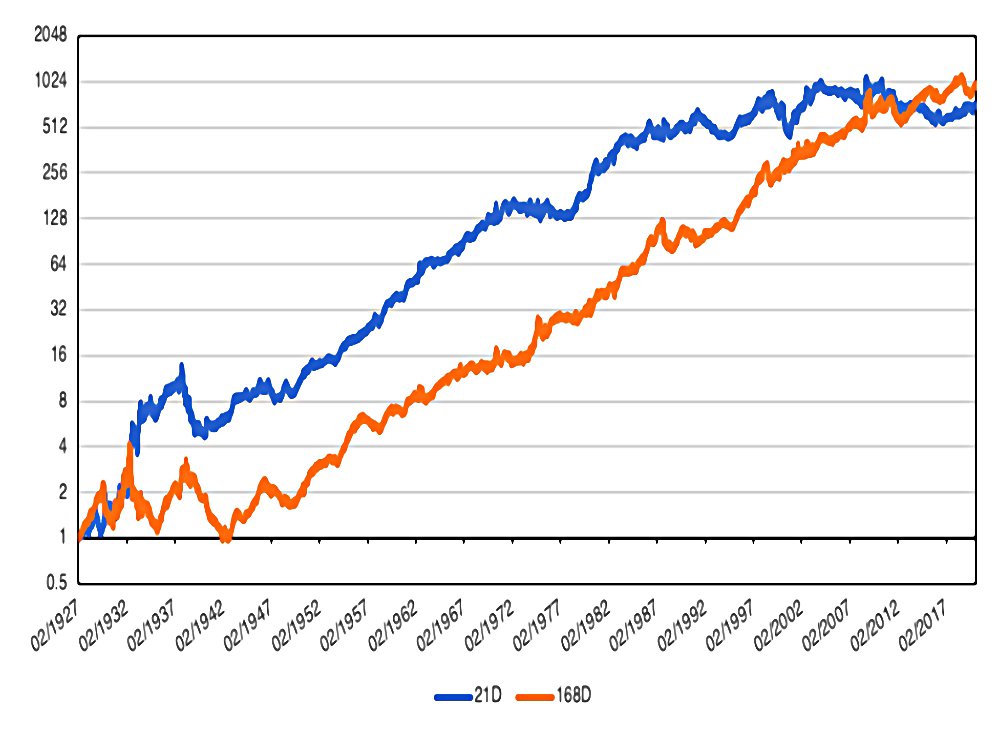
Corey starts with two long/short trend-following strategies in US stocks.
When trend signals are positive, the strategy will be long U.S. equities and short the risk-free rate; when trend signals are negative the strategy will be short U.S. equities and long the risk-free rate.
The first strategy uses a 21-day lookback and holds for one day; the second uses a 168-day lookback and holds for 14 days.
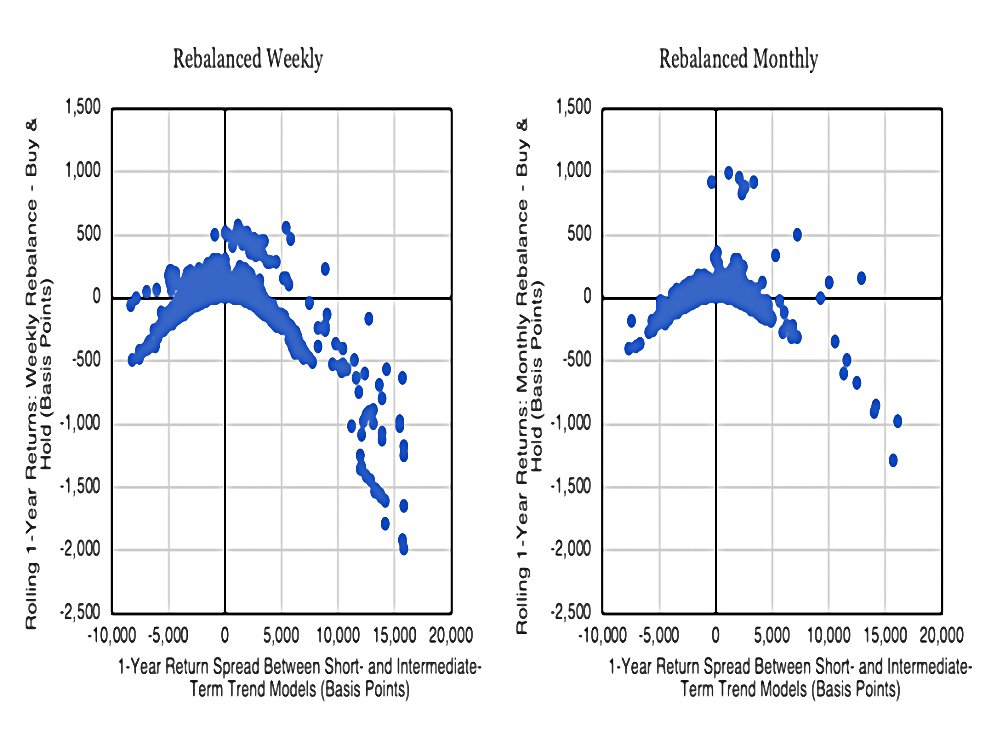
Allocating 50/50 to these two strategies produces a concave return against the relative performance of the two strategies.
- But the shape varies with the rebalancing frequency (there is also some path dependency).
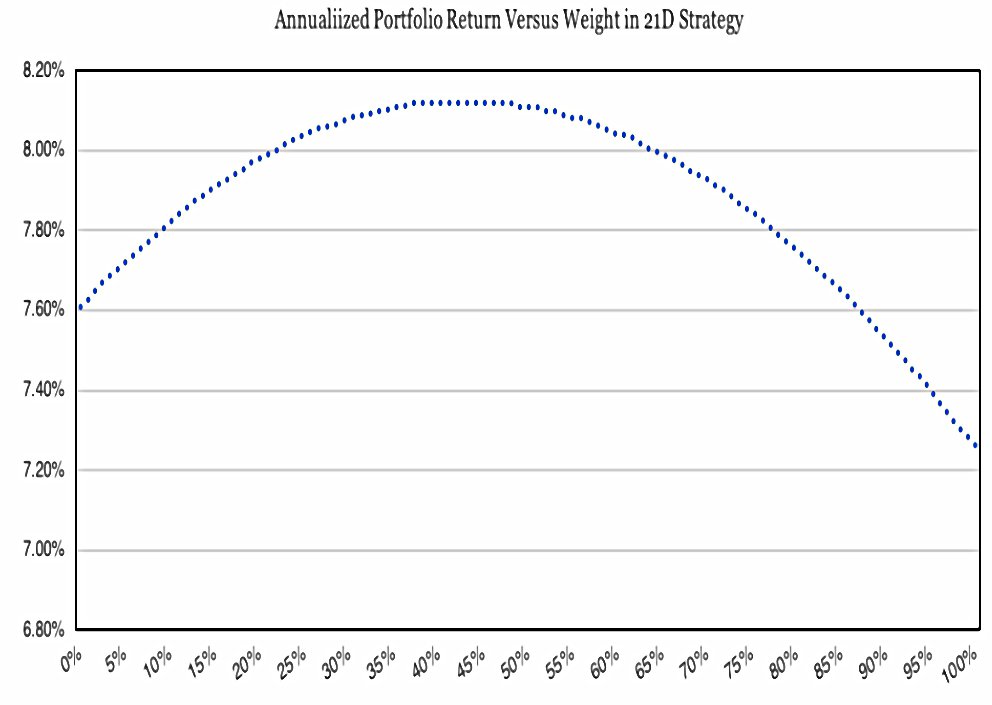
Next, Corey plots the returns under weekly rebalancing from various mixes of the two strategies.
- The sweet spot is 45% of the 21D and 55% of the 168D – this mix outperforms both of the individual strategies.
Using hindsight to look at returns, volatilities and correlations also gives an optimum weight for 21D of 45%.
- Plugging in other correlations shows that even at a 0.9 correlation, it would still be worth allocating 10% to 21D (the 21D allocation is lower because its returns are lower over the period in question).
And even if the 21D return was more than 2% pa lower than the 168D return (it’s actually just 0.3% lower) it would still be worth allocating 10%.
- But when you have no view on (future) returns and volatilities, a 50/50 split is best.
That’s it for today.
- Remember to diversify your portfolio in all three dimensions, and even within strategies (by using ensembles).
Until next time.
Mike Rawson
Mike is the owner of 7 Circles, and a private investor living in London. He has been managing his own money for 40 years, with some success.