Curve Your Enthusiasm
Today’s post looks at a couple of notes from Man Group which examine the implications of an inverted yield curve.
Contents
Curve Your Enthusiasm
The latest note – “Curve Your Enthusiasm” – came out in mid-February, as the gap between the two-year Treasury yield and the 10-year Treasury yield was closing fast.
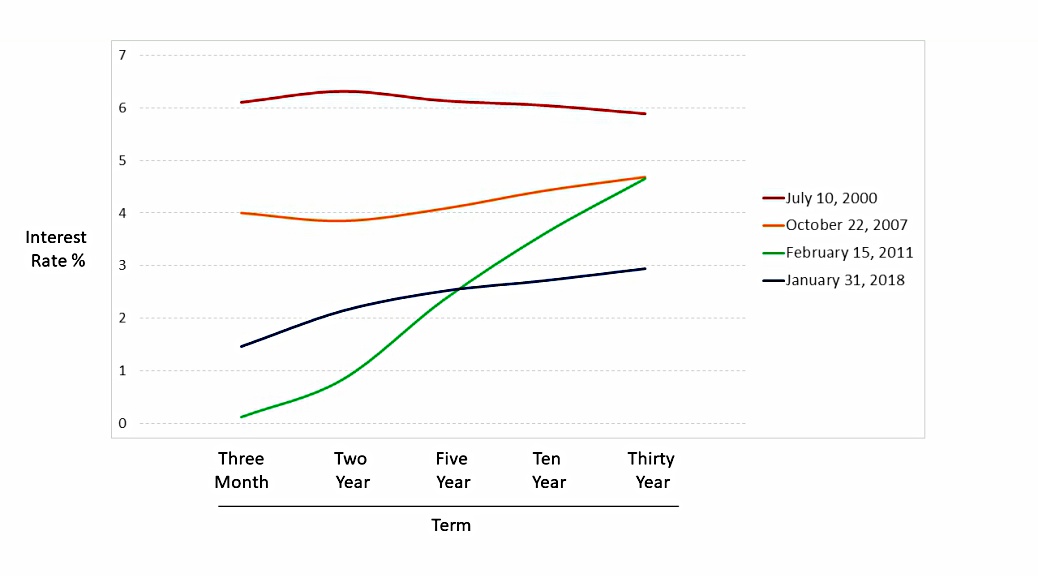
Year-to-date, the US 10-year yield has moved from 1.5% to 2.0%. The 2-year has gone from 0.7% to 1.6%. Thus the so-called 10-2 yield spread has halved from 80 basis points to 40bps.
When the gap turns negative, we have a yield curve inversion.
First observed by our very own Professor Campbell R. Harvey in 1988, the 2-year rate rising above the 10-year has correctly presaged all four of the economic recessions experienced since, including the 2020 recession induced by Covid-19.
So should we be worried about a recession?
- And if so, should we sell equities?
The note refers us to a 2019 paper called “Do 10-2 Inversions Matter?”
Do 10-2 Inversions Matter
The earlier paper begins with an examination of how investors have tried to argue that “this time is different” whenever the curve inverts.
In 2000, ‘this time was different’ because the US was running a surplus, budget deficits were going to be a thing of the past and sovereign signals were no longer descriptive. In 2006 ‘this time was different’ because an Asian savings glut was coming on line, causing similar distortion to the Treasury market.
Man regarded the 2019 inversion as a bad sign – this time was not different (including in terms of “curve denial”).
Why?
First, they explain why the inversion can predict recessions:
It can be interpreted as the bond market saying that the cost of capital (the short end of the curve) is greater than expected economic growth (the long end) and therefore the Federal Reserve has tightened too much, meaning a recession is probable.
Banks – who borrow at the short end and lend at the long end – will be less likely to lend.
- This slows credit creation, which pushes the economy towards recession.
Historical inversions
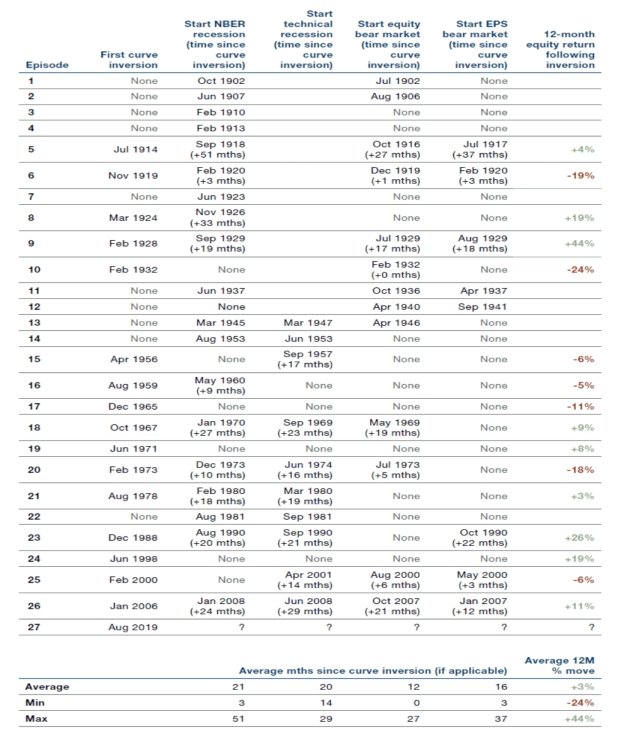
Of the 16 curve inversions excluding the current one, there were only three which did not lead to some kind of negative event, either market or economic. These were December 1965, June 1971 and June 1998.
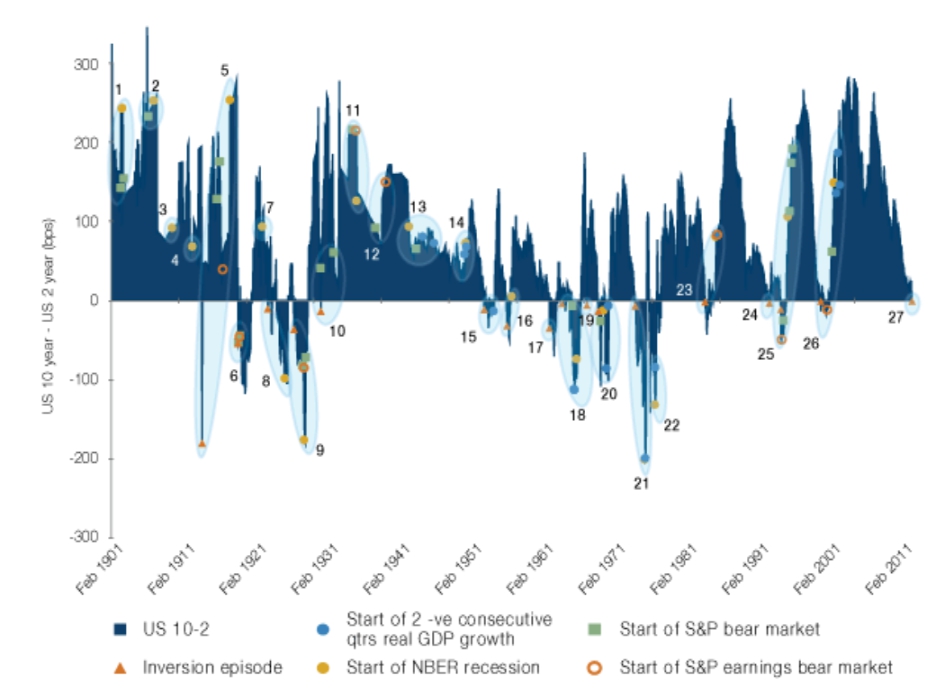
Adverse events include:
- The start of any period that was defined as a recession by the NBER.
- The start of any period after two consecutive negative GDP quarters.
- The start of any 12-month period, where US equities fell by 20% or more (bear market).
- The start of any 12-month period where US corporate earnings fell by 20% or more.
Still relevant?
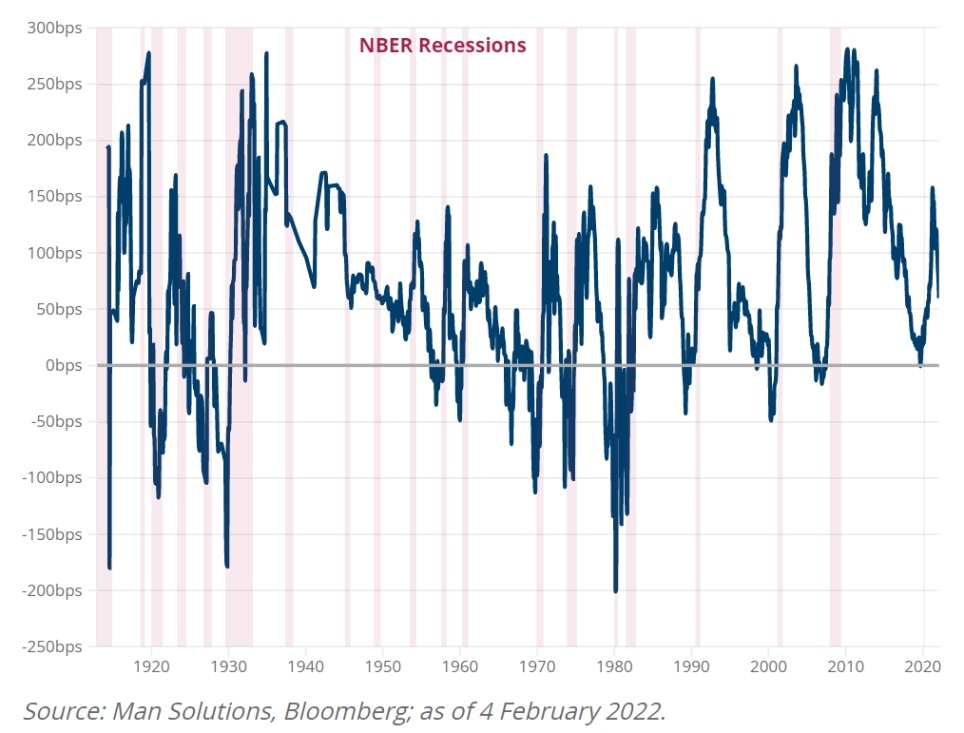
Some critics wonder whether pre-1960 data can still be relevant, but Man thinks that it can:
The dynamics that make an inversion ominous today – cost of capital eclipsing rate of return and banks borrowing short to lend long – were also in place a century ago. Furthermore, the curve inversion has predictive power across
very different regimes.
What to do?
It’s less clear what investors should do when they see an inversion coming.
In the 10 instances where an NBER recession follows a curve inversion, the gap between the two averages 22 months and ranges between three and 51 months.
The NBER definitions are themselves somewhat irrelevant given the lagged release. The 2008 recession (which began in January) was declared in November – bolting horses, stable doors etc.
The link to equity bear markets shows similar variability:
The time between the two averaged 12 months, ranging between simultaneous and 27 months. Equities were positive in the subsequent year on nine occasions, and sometimes significantly so. The average return in the 12 months following an inversion has been 3.5%.
So not exactly a cause for immediate panic.
Back to the present
From the 2022 note:
The curve flattens 80 basis points [on average] in the first 12 months of a Fed tightening cycle. So if the first hike occurs in March, for which the market is now pricing a likelihood of more than 100%, that means we have until the first quarter of 2023 at the latest before the curve inverts, and perhaps much sooner if the current pace of flattening continues.
Conclusions
Man concludes that whilst selling equities immediately after an inversion will often be wrong, pretending that an inversion hasn’t happened will almost always be wrong (in time).
Everyone loves a golden rule, whether it’s “this time is different” or ‘sell equity when the curve inverts, but reality requires rolling up one’s sleeves and considering a broader range of indicators.
And more pithily:
There comes a point where right but really really early, becomes wrong.
To this, we need to add the practicalities.
- Those who run only a concentrated portfolio of stocks will find selling to cash relatively easy.
- What they might find more difficult is working out when to get back in.
Those like me, who run a large (in terms of the number of positions) and well-diversified multi-asset portfolio, will probably prefer to hold through the inevitable bear market.
- Until next time.
Mike Rawson
Mike is the owner of 7 Circles, and a private investor living in London. He has been managing his own money for 40 years, with some success.