Liquidity Cascades

Today’s post looks at a paper from NewFound Research entitled Liquidity Cascades.
Contents
Liquidity Cascades
This paper from NewFound Research looks at three popular explanations for three observations about the markets in recent years.
The observations are:
- volatility from endogenous events (large and sudden drawdowns) persists as markets mature, and appears to be happening with greater frequency
- stocks (particularly US stocks) have been in a bull market since 2010
- non- market-cap strategies (smart beta/factors et al) have mostly struggled
The three explanations are:
- loose monetary policy from the central banks
- the rise of passive investing
- insufficient liquidity as leverage increases

NewFound (NFR) think that the common underlying risk factor is liquidity:
The S&P 500 acts as the keystone to a complex market system held together by arbitrage boundaries. When chaos ensues in one market, these arbitrage bounds can lead to knock-on effects. When these knock-on effects reach the S&P 500, the entire market structure can begin to break down.
The paper looks at these processes in more detail and analyses the investment implications for both profit and protection.
Central Bank Intervention
In 2008, in response to the great financial crisis, central banks became active and perhaps dominant players in the financial markets.
By reducing short-term rates they provided the incentive for investors to bear greater risk, and through market stabilization programs they provided investors with the confidence to do so.
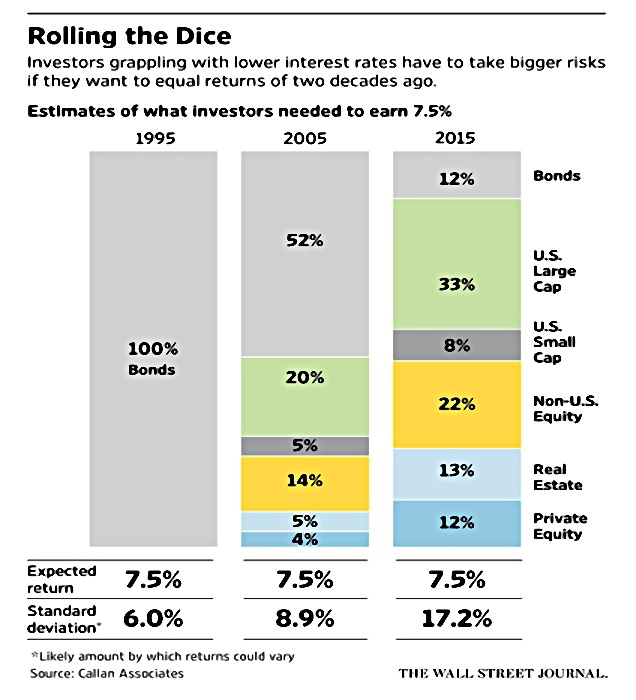
An investor seeking to achieve a 7.5% return must now take nearly three times the risk (as measured in standard deviation) compared to an investor in 1995.
NFR note the increase in call writing (buy-write/covered calls) and put underwriting by institutions in pursuit of yield.
These strategies typically sell short-term out-of-the-money puts and calls in order to harvest the volatility risk premium.
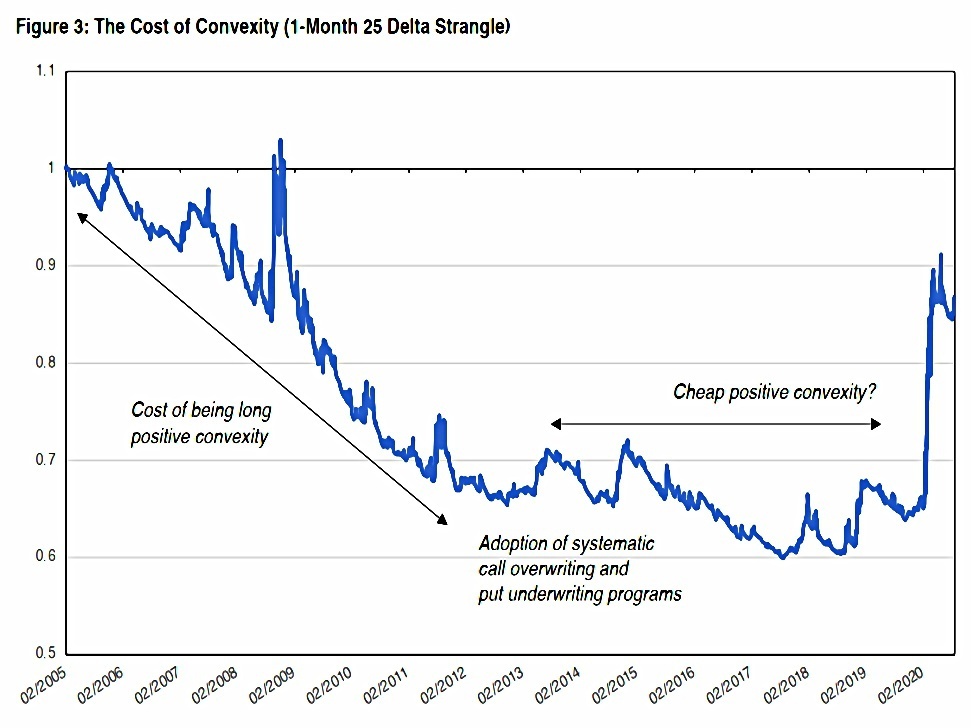
In Figure 3, we plot the opposite trade of many of these programs: the return from systematically purchasing short-term out-of-the-money puts and calls on the S&P 500. In theory, we would expect this trade to cost the volatility risk premium over time, creating a persistent return drag.
Indeed, we see just this from 2005 to 2011. However, as call over- and put under-writing programs were adopted en masse in the early 2010s, the curve flattened.
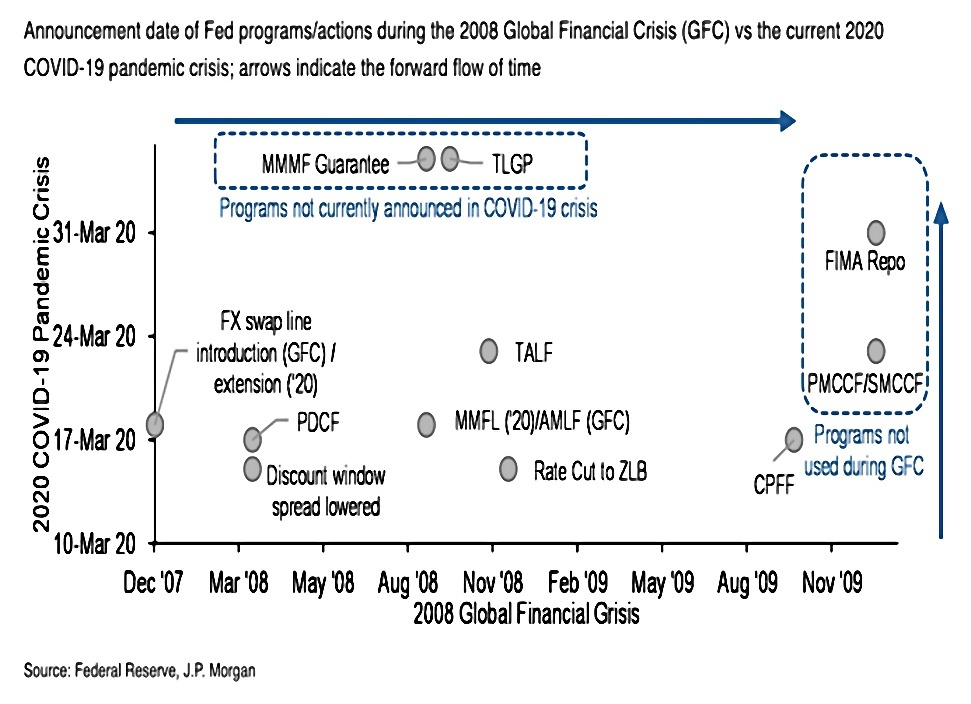
The Fed playbook gives investors the confidence that the Fed will backstop market liquidity by acting as the lender of last resort (the “Fed put”).
- NFR note that hedge fund strategies show structural change dating to unconventional monetary policy announcements.
The problem with increased risk adoption and use of leverage arises when there is market volatility (and reduced liquidity).
- Investors de-risk, putting more pressure on market prices and liquidity (a vicious circle).
Increased risk-taking behaviour also increases the extent to which markets are used as a savings vehicle. (( NFR call this the “moneyness” of the markets, a term which I associate with options ))
- This ties the market to the real economy making it more difficult for the Fed to extract itself from the markets, particularly over a short time period.
Passive Mandates
Passive funds increased their share of US equity funds from 10% to 45% of assets between 1993 and 2016. This trend has several effects:
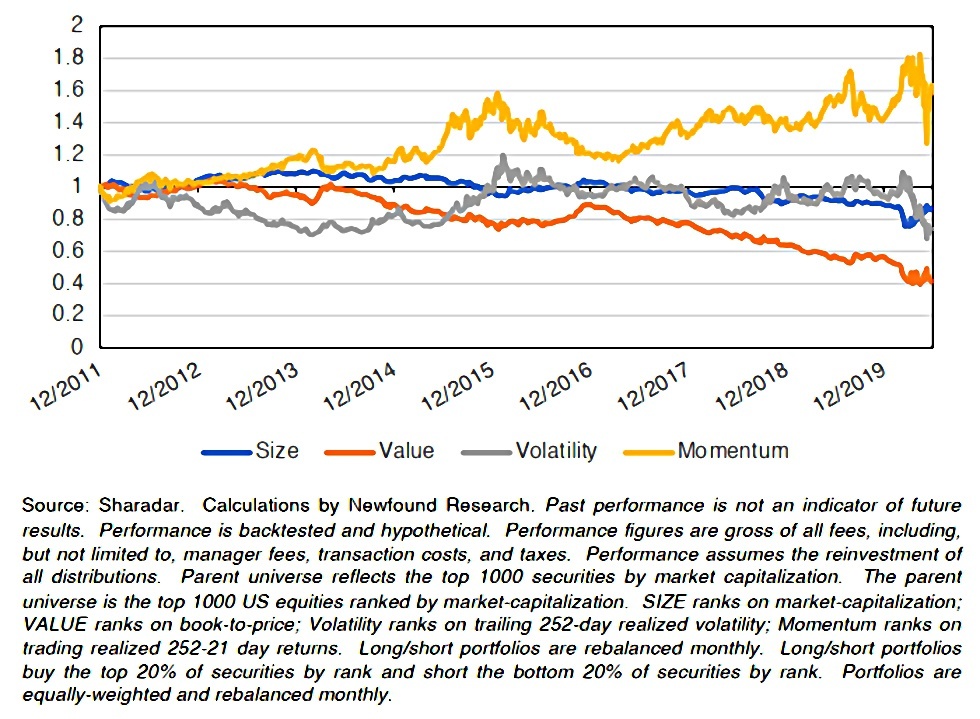
- The use of passive indices as benchmarks leads to funds being withdrawn from underperforming managers and reallocated to outperforming managers.
- This leads to selling underperforming shares and buying ones that have done well.
- This is momentum and it’s the best-performing of the traditional factors in recent years.
- The move from active to passive mandates leads to “buy to cover” trades on the active bets (closing trades).
- This will lead to the selling of stocks found in “losing” strategies (eg. value in recent years) and buying the opposite stocks – this leads to buying of large caps.
- When the 10 ten stocks in the S&P 500 are 30% of the index, almost any fund with a high active share will be underweight them.
- Once again, this is reflexive – buying large caps makes them larger and leads to more buying (vicious circle).
There are also impacts on market stability. NFT split investment strategies into convergent and divergent:
Convergent are those strategies which are anchored to a level (e.g. value or mean reversion) where investors sell when price is above the level and buy when it is below. Conversely, divergent strategies try to profit from price continuation (e.g. momentum or trend).
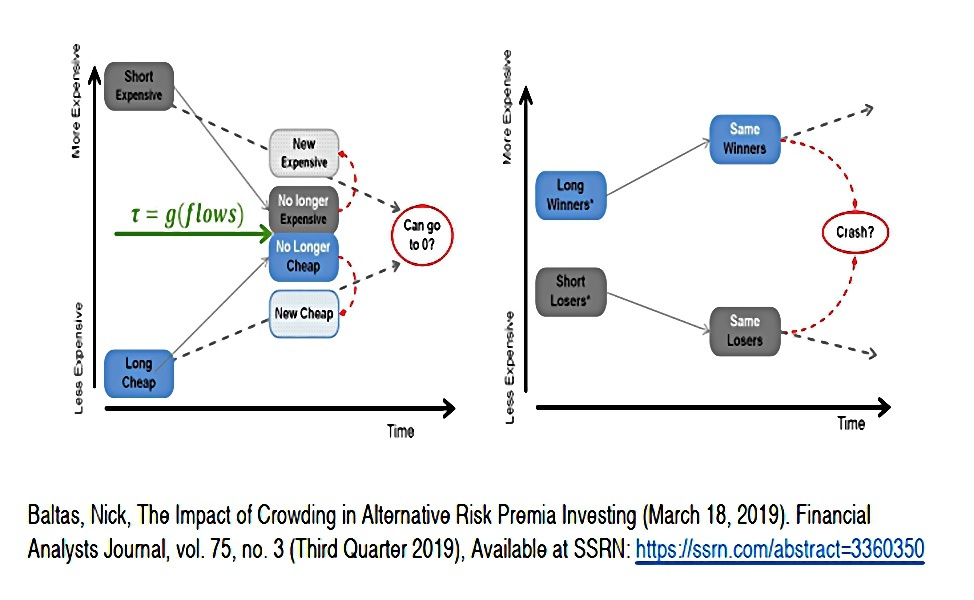
Convergent strategies are stabilising – winners are sold (at eg. higher than intrinsic value) and losers are bought.
- Divergent strategies have the opposite effect.
Note that passive indexing (including smart beta) is a divergent strategy that buys winners.
This has implications for pricing:
Flow traded to track a basket is incentivized not to identify the right value for a given security, but to minimize the impact of that flow in the market and execute the trade as efficiently as possible.
Active managers should work to accurately price securities in a normal market.
In distressed market environments, there may not be sufficient liquidity (or willingness) to step in and correct this behavior. This may be further exacerbated if markets are dominated by basket traders.
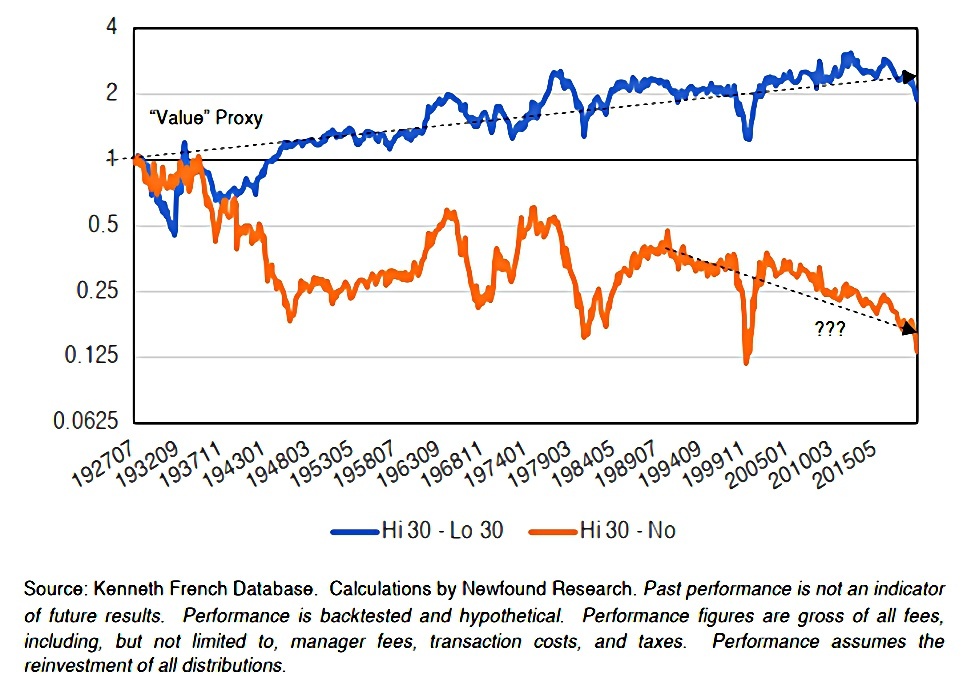
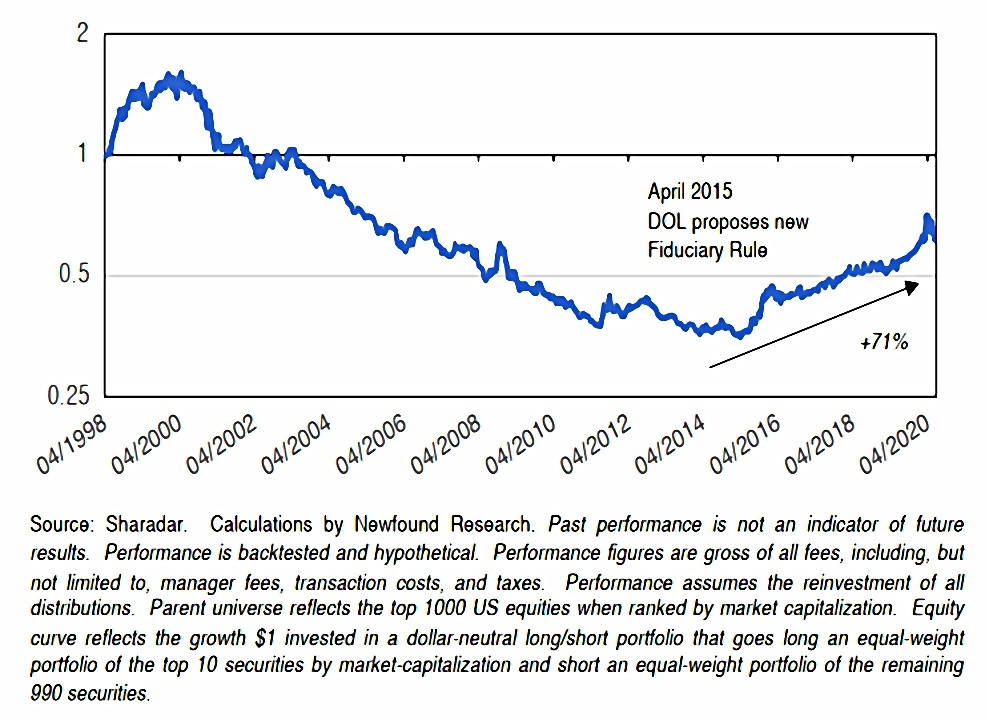
NFR also note that dividends from stocks in indices will be reinvested disproportionately in the low- and non-yielding components of the index (since the value of the stock issuing the dividend will drop).
In a market where prices are dominated by basket trading, however, we would expect to see low- and no-yielding stocks out-perform higher yielding stocks over time.
Insufficient Liquidity

The next section looks at the tendency of liquidity to decline during periods of stress.
- HFT and its use of leverage has only made this worse in recent years.
This creates problems for systematic hedgers (eg. option dealers), who need more liquidity during a crisis.
Call options are sold by investors (e.g. as a covered call) whereas deep out-of-the-money puts are bought for protection. This means that dealers, who are on the other side, have to hedge their long call and short put positions.
In calm markets, the calls are delta hedged using the index.
As the index goes up, they sell exposure, and as the index goes down, they buy exposure. In this way, dealers act to stabilize markets as a convergent trade and dampen volatility.
If there is a sell-off, the puts must be hedged.
As markets go up, they buy and as markets go down, they sell. This creates a potentially destabilizing force, acting as a divergent trade and further demanding liquidity when there is none.
There’s a lot more detail on this in the paper, for those who are interested.
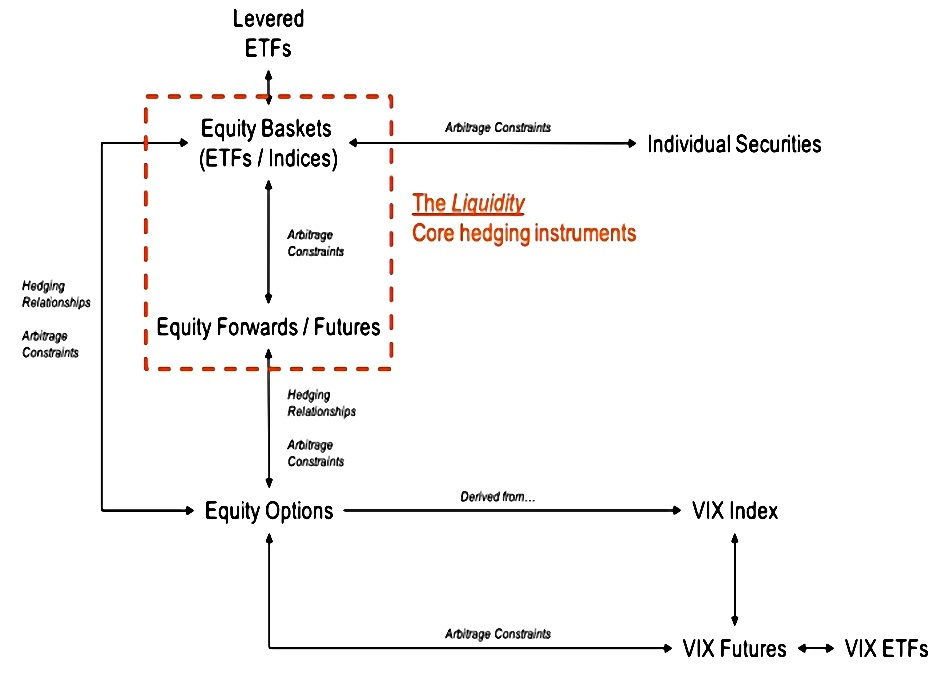
What keeps the entire system in line is arbitrage. We can think of the system almost like a spider’s web, with different arbitrage bounds providing stability. The S&P 500 is the keystone of the entire hedging complex. Functional liquidity in the S&P 500 ultimately makes or breaks markets.
NFR also recast the VIX as a measure of market liquidity:
If we buy a put option, the dealer is going to try to hedge that put option. In thin market environments, the cost of hedging will go up. As option prices and implied volatility are intrinsically connected, a higher price implies a higher implied volatility.
As the VIX is calculated using the implied volatilities of the S&P 500 option chain, we can see that liquidity of the S&P 500 itself will ultimately impact the level of the VIX. A lack of liquidity can rapidly drive the VIX higher.
Icarus trades
The second part of the paper looks at what trades to take on the basis of this understanding of market liquidity.
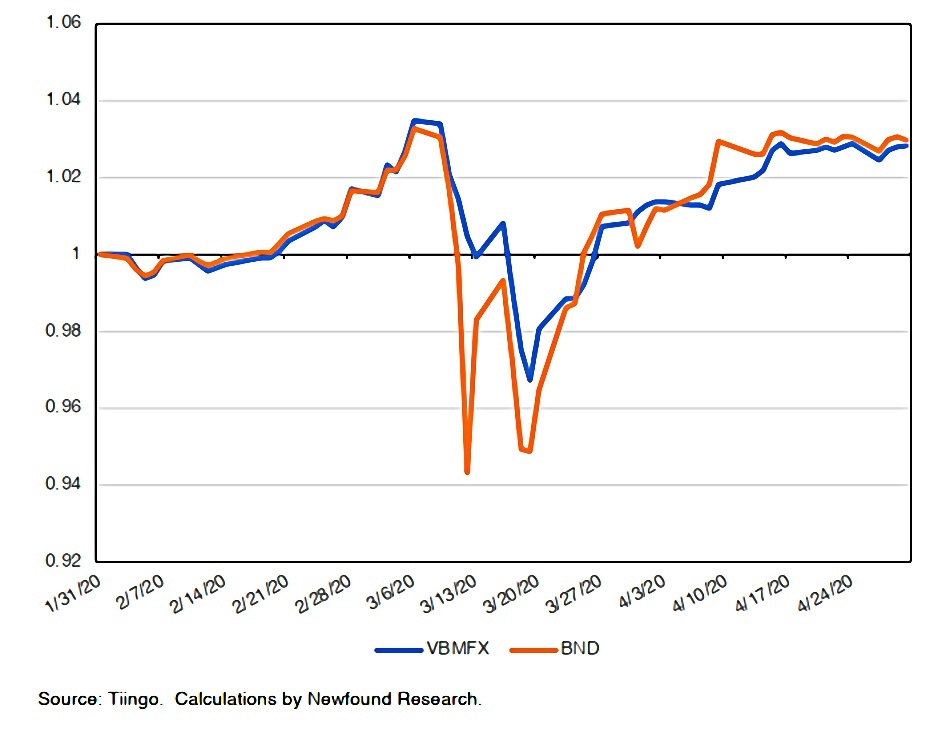
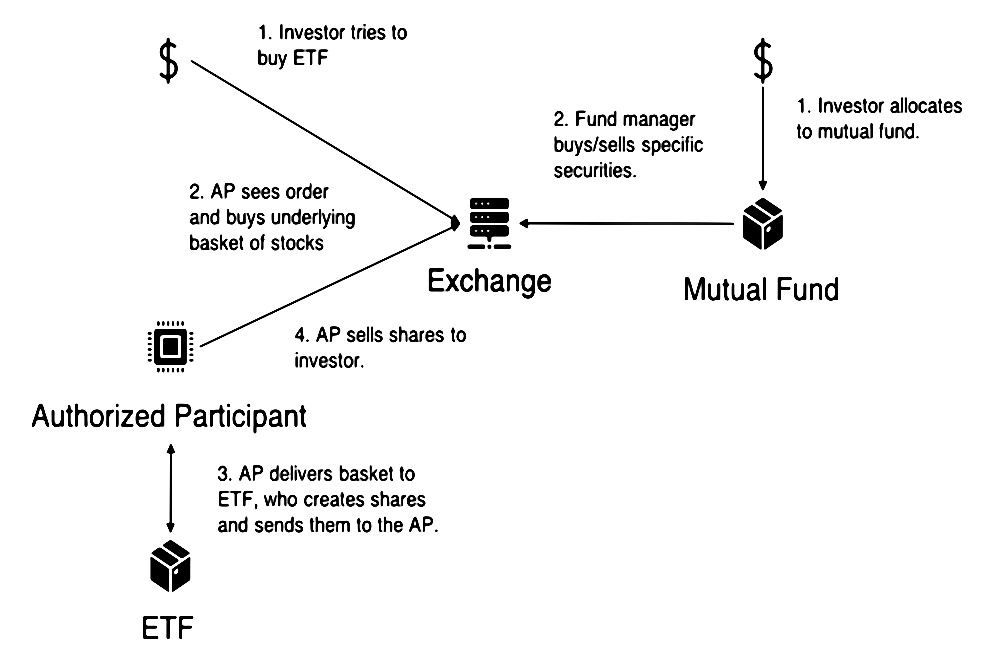
We may be able to exploit liquidity mis-matches in the fixed income market by purchasing a fixed-income mutual fund and then jumping into an equivalent ETF during periods of significant price dispersion.
In March 2020. the Vanguard Bond ETF traded more than 6% below the equivalent mutual fund.
- Even bigger gaps appeared between municipal bond funds.
Tilts towards momentum, large-cap and non-dividend stocks could also be considered, but NFR suggests taking the other side of a crowded trade.
If we believe that institutions will continue to be structural sellers of shortdated options, buying those options may provide us with convexity at much cheaper premiums than historically available.
And if we believe that the Fed is permanently entrenched as a player within markets, the simplest trade may simply be to apply leverage.
The Daedalus Path
Daedalus tried in vain to persuade his son Icarus to take the middle course.
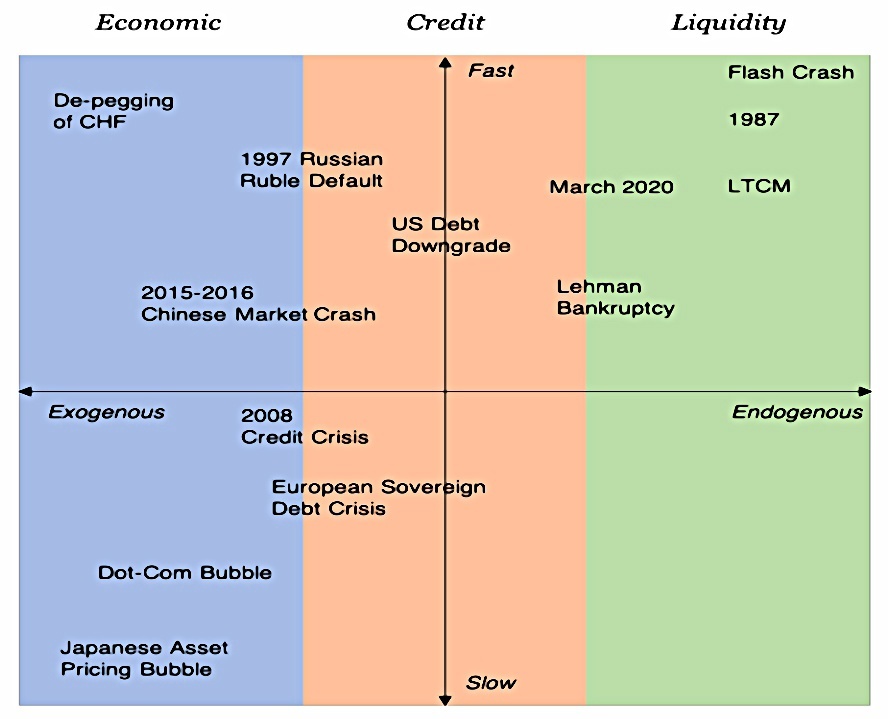
While liquidity cascades may be an increasing risk of modern markets, other fundamental risks have not necessarily subsided. Those strategies appropriate for an endogenous liquidity event may not be appropriate for an exogenous economic event.
The speed of the event matters, too.
We believe we must look for so-called “positive carry, anti-carry trades”: those trades with positive expectancy in normal environments that also potentially provide a convex hedge in times of stress.
NFR supplies several examples:
- Long momentum and mega-cap equities, plus a deep out-of-the-money equity index put.
- Long strong balance sheet stocks and short parent equity index (especially small-caps which are particularly susceptible to credit risk).
- Long equities plus defensive trend following.
- Active volatility strategies that exploit mispricing created by structural volatility sellers.
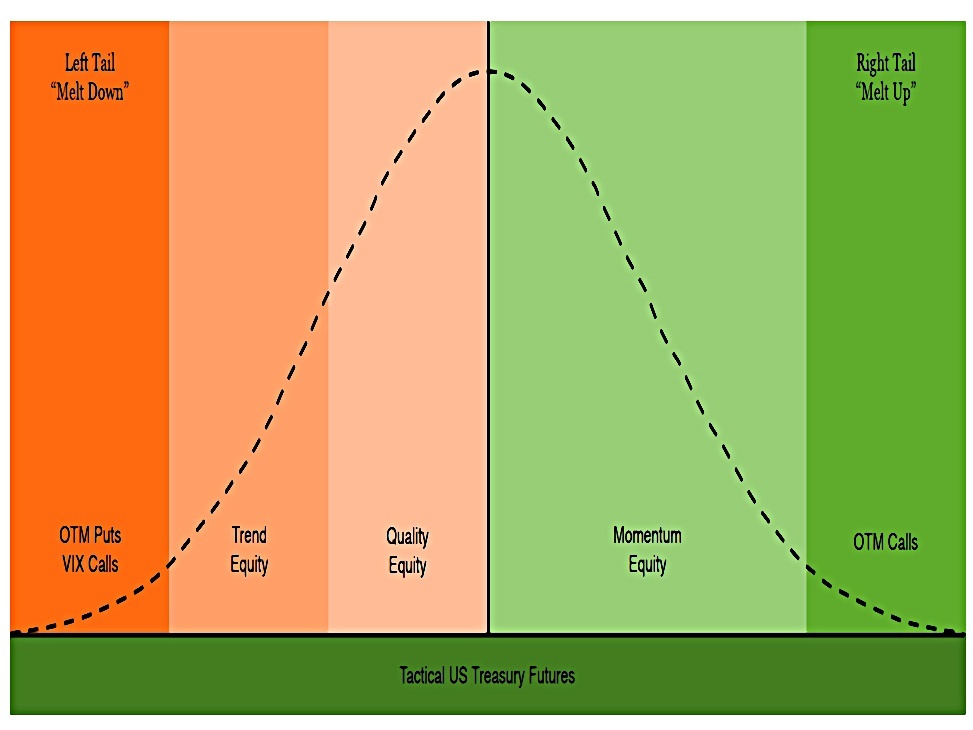
The portfolio
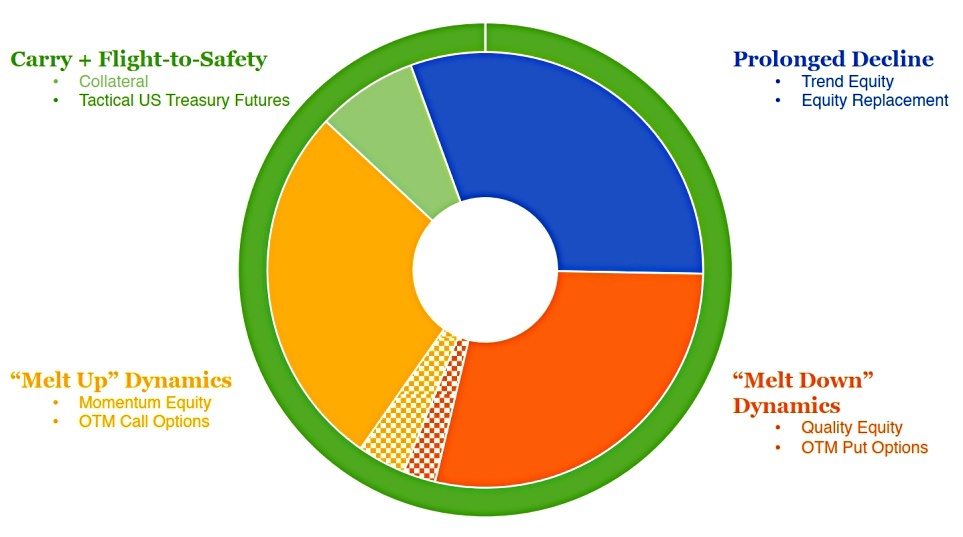
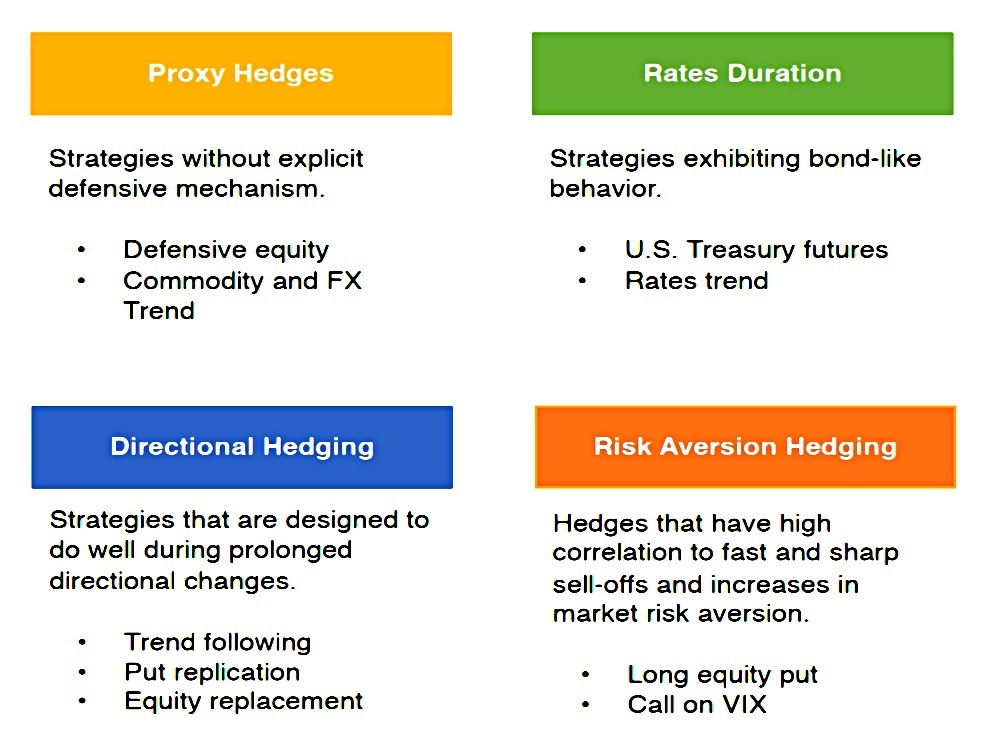
NFR provide a portfolio to cope with three return regimes:
- prolonged declines (trend-following)
- quick melt-downs (quality stocks and OTM puts)
- melt-ups (momentum stocks and OTM calls)
Conclusions
It’s been an interesting if somewhat difficult paper.
- The central arguments are easy to accept, but really boil down to accepting – and preparing for – more melt-ups and melt-downs.
Managing risk through the Loop requires finding balance in opposites: positive carry, anti-carry trades. The duality of this structure pairs offense with defense, seeking enhanced returns to help offset the cost of convex hedges that may allow investors to become liquidity providers during periods of market stress.
The more depressing question is how the Fed gets out of what NFR call the Market Incentive Loop if indeed they can.
- Until next time.
Mike Rawson
Mike is the owner of 7 Circles, and a private investor living in London. He has been managing his own money for 40 years, with some success.