
Dynamic leverage

Contents
Dynamic leverage
Today’s post looks at a paper I found on Reddit that deals with dynamic leverage.
IHateProtoss
I found the paper at the end of July in the /r/LETFs subreddit, a forum that deals with leveraged ETFs.
- It’s from a user called IHateProtoss (IHP), who I know nothing about – Reddit recently introduced a feature that allows users to hide their posts, which makes it difficult to know who you are dealing with.
- I believe he is named after (his attitude to) an alien species from the video game StarCraft.
The Reddit post links out to a site called https://pages.waterruup.to/ – again, I know nothing about this.
- But what the heck, the article has lots of pretty graphs so let’s not be too hasty in judgement.
Summary
IHP starts with a tl;dr, which is always useful.
I expect the stock market to go up in value over time, so it’s a positive expected-value game you want to play as much as you can.
This means having your money in the market for as long as possible.
- If you are young, most of your money (earnings) is in the future, and the best way to pull it forward is to borrow money (use leverage).
The point of the paper is that fixed leverage (2x or 3x, much higher than I would consider or is even practical in UK tax shelters) is risky, and variable (dynamic) leverage is safer and better.
IHP has this to say about volatility:
1) it’s much easier to predict how volatile the market will be than where it’ll go, and
2) high-volatility periods, historically, haven’t produced proportionally large returns
I agree with 2), but I’m not sure about the “predict” part of 1) – sure, we can measure volatility, but predict it? And predict it better than price momentum?
Volatility decides leverage
The problem with most leveraged ETFs (LETFs) is the daily reset – we can’t buy a contract for leverage five, ten or twenty years out.
- The daily reset leads to volatility decay.
- The more volatile the underlying asset, the higher the hurdle rate than the returns need to clear in order to compensate for the decay.
- That’s why LETFs work well on indices and badly on single stocks (and crypto).
But volatility isn’t fixed, and like price appreciation (momentum), it clusters.
- Handily, high volatility is also associated with low returns.
So dialling down the leverage when volatility is expected to be high should help us.
IHP uses a version of the Kelly formula to work out what the optimum leverage should be:

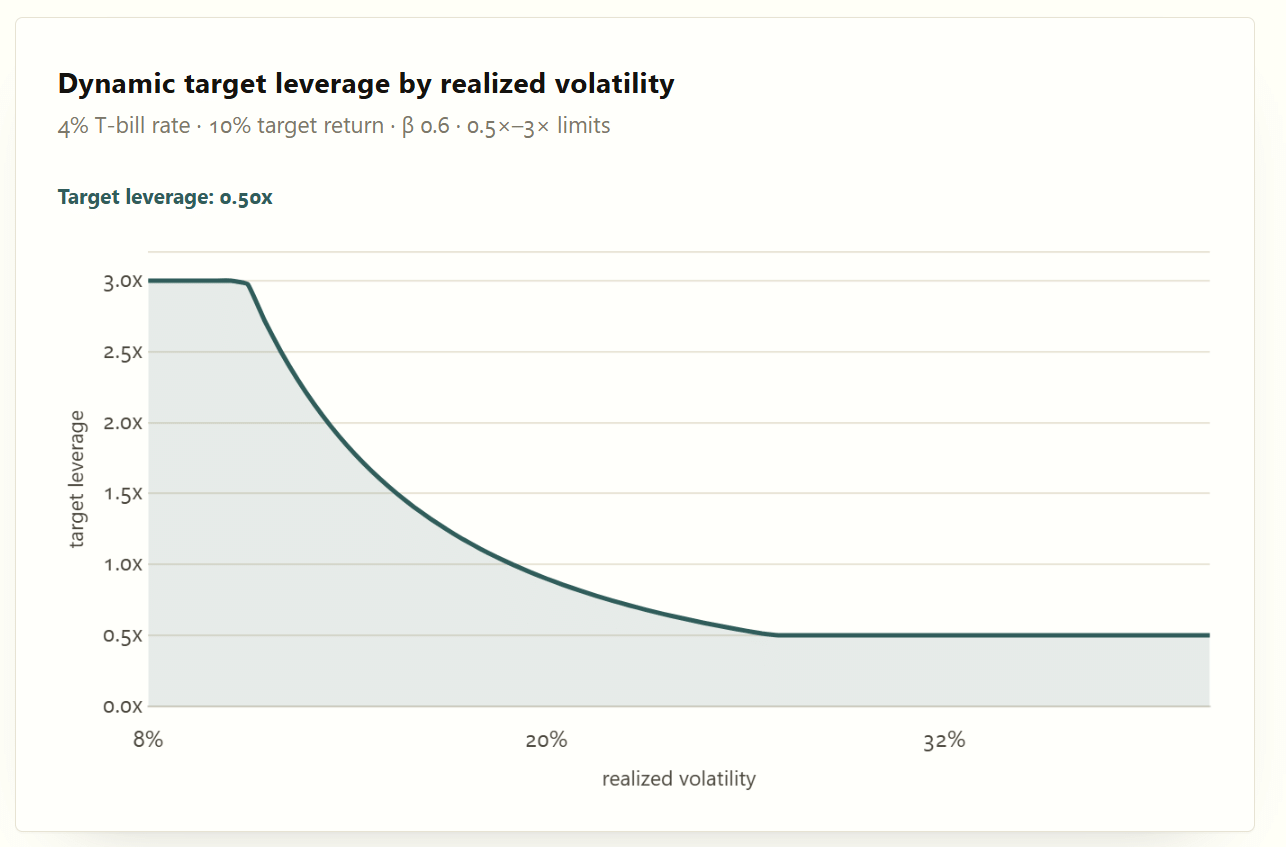
The chart shows leverage varying between 3x and 0.5x.
- Here in the UK, I won’t be able to come close to 3x
- And 0.5x means going to 50% cash (T-bills), which is again non-trivial for a large portfolio
So for my purposes, I just need to know when to switch from “high” leverage to “low” leverage (with maybe a “medium” level thrown in there if I’m feeling sophisticated).
The volatility of the SPY index ETF is usually between 12% and 17%, which just about covers the curvy bit of the chart.
Performance
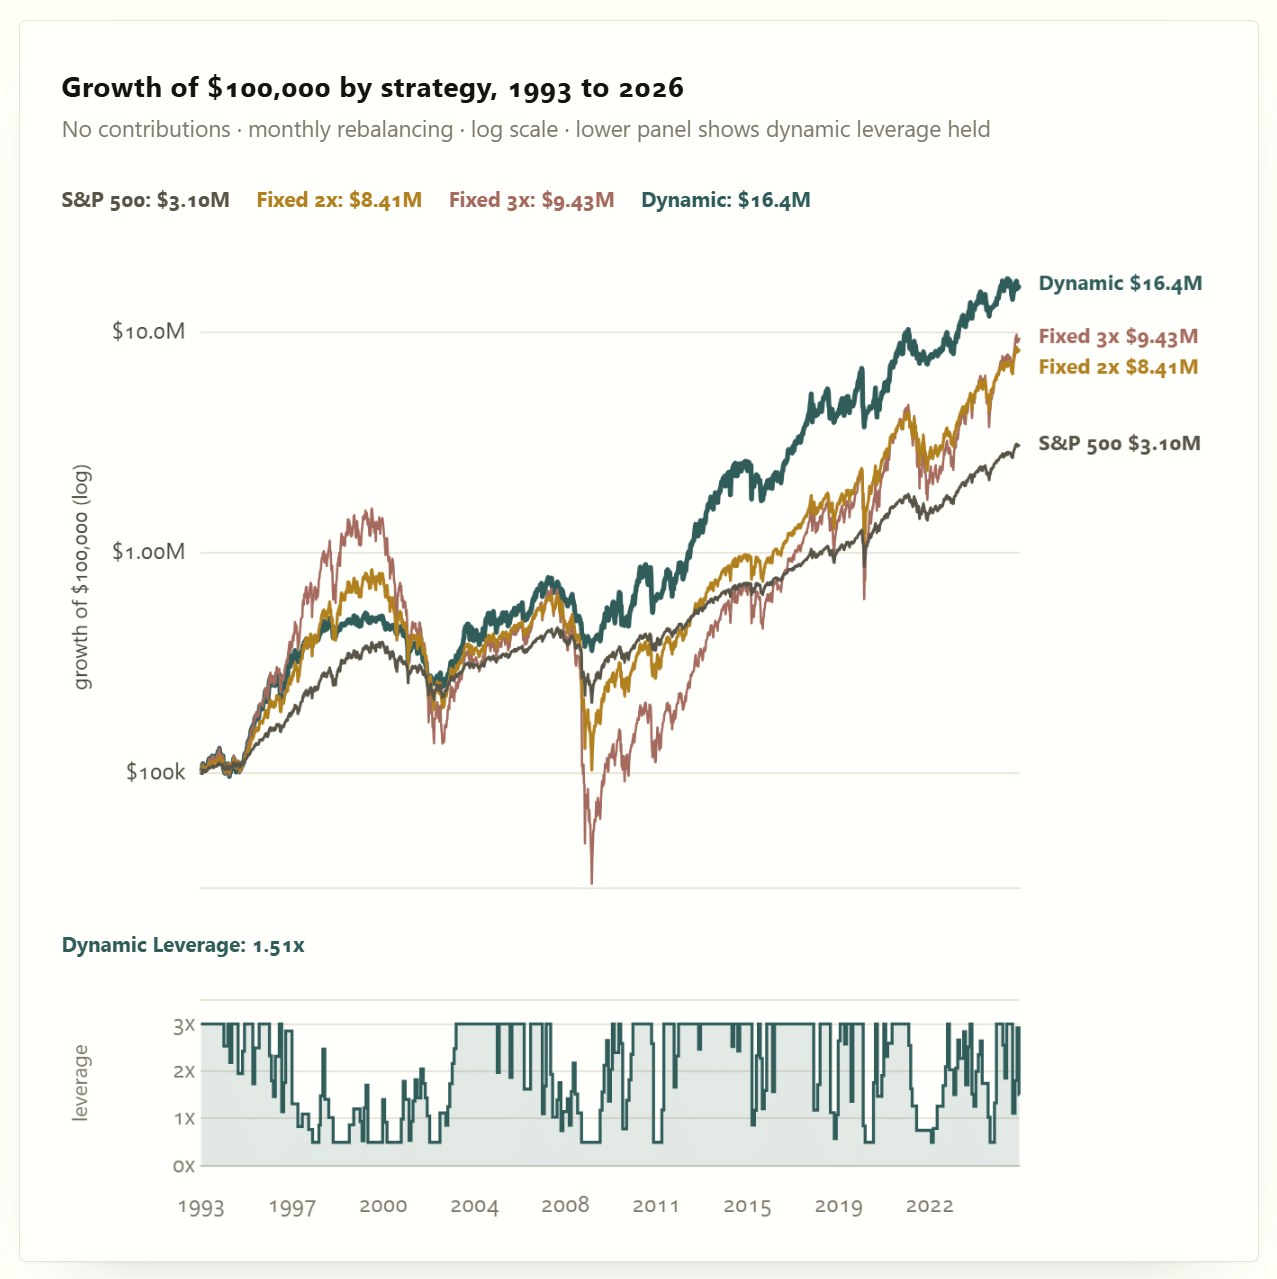
IHP compared Dynamic Leverage (DL) to 3X, 2x and 1x from 1993 to 2026.
Which covers the dot-com crash, the GFC, COVID, and the 2022 rate shock.
DL does well.

Scenarios
As well as the past 30 years, IHP looked at lots of future scenarios:
I built eleven different versions of the world: an AI boom, an AI bubble burst, a slow bleed, a rate shock, a prolonged geopolitical freeze, and several others.
Each version moves through hidden macro regimes that drive returns, volatility, and rates together. I probabilistically sample those regimes to construct thousands of fifteen-year paths, then compare every strategy.

The model weights are in an appendix.
The two regimes that matter most to the left tail, Crisis and Stagflation, are also the two that 1993 to 2026 cannot calibrate honestly, because the sample has few true crises and no 1970s stagflation. I trust the ranking across worlds much more than the terminal dollar amount from their weighted mixture.

IHP provides a dynamic chart (you can click to resample the results) of the four strategies against scenarios with different levels of future “luck” (P10, P25, P50, P75).
- I did a bit of clicking around, and DL seems to do particularly well on the unlucky paths.
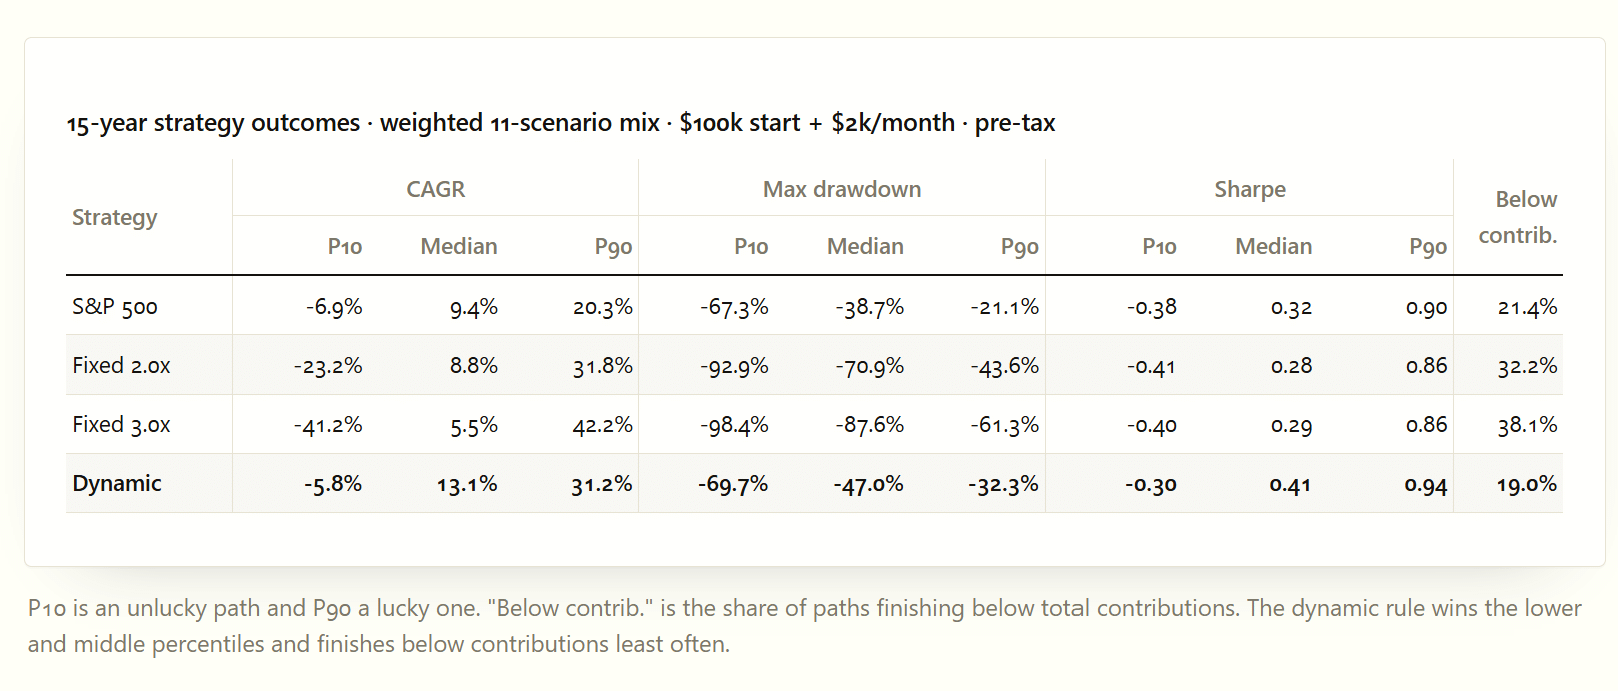
On final wealth, dynamic basically does what I wanted: it keeps most of fixed 2×’s upside, while its bad outcomes look much closer to 1× than fixed leverage. Fixed 3× still wins the best worlds, but its bad worlds are much worse.

CAGR tells the same story another way: dynamic has the highest median, with a much tighter range than fixed 2× or 3×.

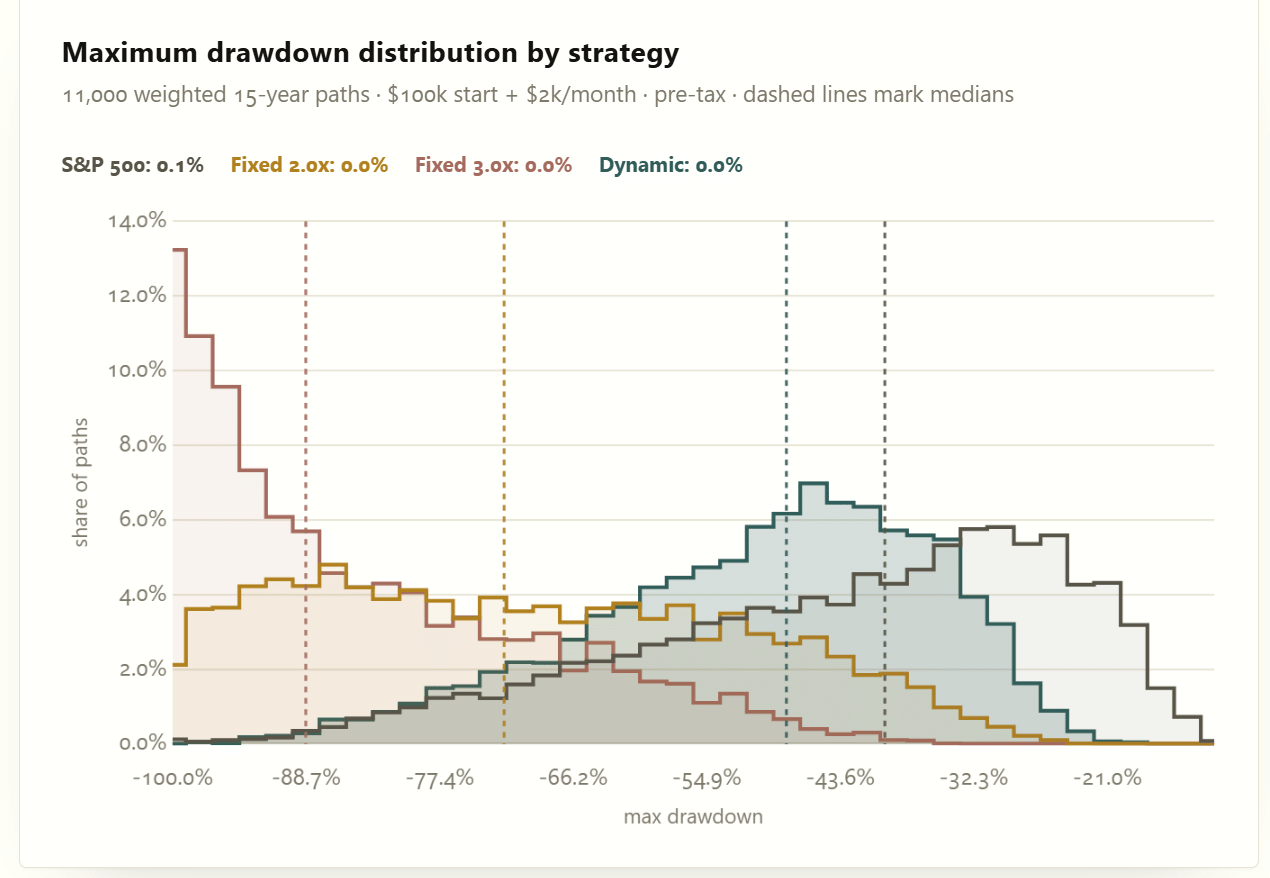
Drawdown matters more to me than the extra money in the best paths, and this is where the result is clearest. Dynamic is much closer to 1× than 2×, and nowhere near as bad as 3×. When volatility spikes, it sheds leverage while the fixed strategies keep all of theirs.
Here’s a summary table for the four strategies:
Costs
It’s not clear whether the charts above take account of costs, but IHP does deal with this in an appendix:
LETFs pay financing costs and daily-reset drag, options pay through IV premium and spreads, and dynamic trading can realize taxes. After accounting for those, I still get the same answer as the historical backtest: dynamic keeps most of fixed leverage’s good outcomes and makes the bad ones much less ruinous.
Conclusions
IHP is American, so he uses fixed leverage in his taxable accounts and DL only in tax shelters.
- I only have tax shelters at the moment, so this trade-off calculation hasn’t arisen for me yet.
I’m already sold on dynamic leverage as a concept, though I can’t (and probably wouldn’t in any case) implement the extreme values in this paper.
- But I like the support offered by the analysis, and I will be pushing ahead with my gradual implementation.
I doubt I will get past 10%-15% leverage in the good times, and I probably won’t drop below 5% to zero leverage in the bad times.
- But we shall see – we’ve been in the good times for a few years now and a regime change seems plausible in the next year or three.
That’s it for today.
- Until next time.
Mike Rawson

Mike is the owner of 7 Circles, and a private investor living in London. He has been managing his own money for 40 years, with some success.





The point about volatility clustering being more forecastable than direction is the part worth testing, but the Kelly-derived leverage range of 3x to 0.5x seems impractical if you’re constrained to a couple of discrete levels anyway. Before trusting the signal, backtest it against a simple rule using realized volatility over a short window versus a longer one, and check how often the switch actually triggers. A single threshold with hysteresis would cut whipsaw trades and make the whole thing easier to execute.
Thanks for that. I think at my level, the only takeaway is that good times = higher leverage and bad times = lower leverage. Which is intuitive, but it’s nice to see someone dig into it.