HFEA 3 – Why not use leverage?
Today’s post is another in our series on Leveraged ETFs.
Contents
Why not use leverage?
Today we’re going to look at a couple of posts from the Mindfully Investing website, one of the few investing blogs to have examined leveraged ETFs.
- The first post is called Why not use Leverage? and dates back to February 2020.
Karl Steiner, who writes the blog, was responding to a reader question:
A mindful investor would favor a 100% stock portfolio over a long time horizon because volatility becomes less important over time. Would you, via the same logic of volatility, recommend a more leveraged portfolio?
The volatility of leveraged ETFs is roughly proportional to their leverage.
- So the theory is that over a long enough period, we might get positive returns despite the higher volatility.

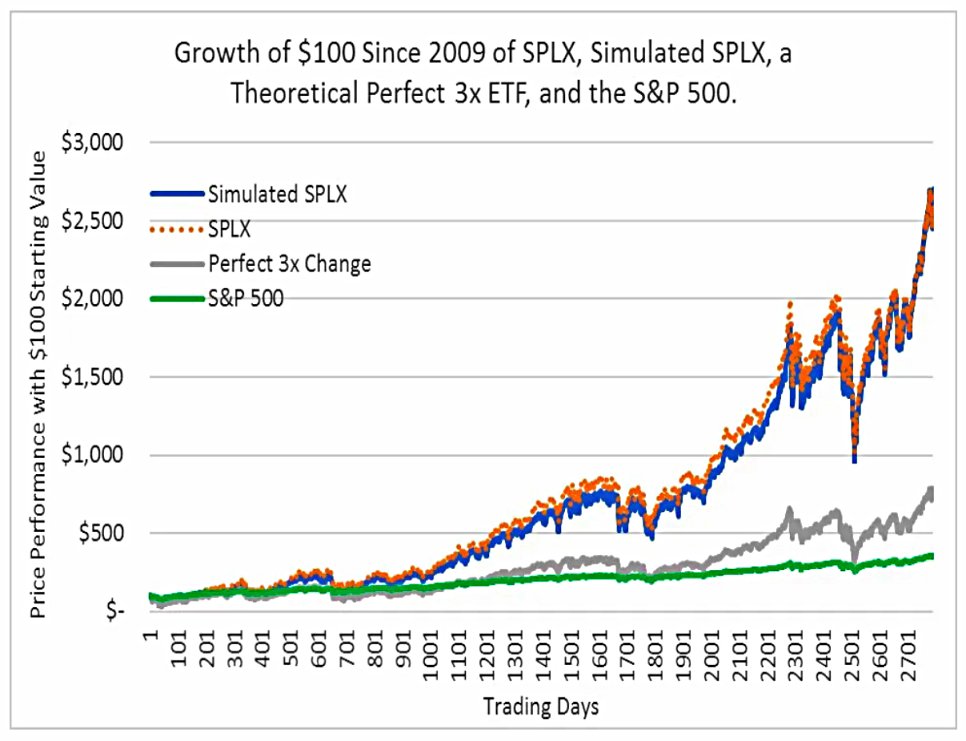
The chart shows how the oldest 3x S&P 500 ETF (SPXL) has outperformed the S&P 500 over a decade since 2009.
- Volatility was 35% rather than 13.5%, and the max drawdown was -50% rather than -18%.
Karl notes a few “cons”:
- Volatility decay (which he calls reset decay) could be dangerous in a flat but volatile market
- But of course, the market isn’t usually fla,t, and goes up 73% of the time
- The track record of leveraged ETFs is very short
- Recent years (( At least 2009 to 2020, which Karl was writing about )) have been calm and bullish (( But note that Tony’s work in our HFEA-2 post looked at longer and earlier time periods ))
- The leveraged performance is lower than the leverage would lead to believe (though potentially still higher than 1x performance)
The mindful research
Like me, Karl was frustrated by the lack of articles on leveraged ETFs, so he decided to dig deeper:
I used distribution statistics on S&P 500 price changes going back to 1964 to develop a “random future market generator”. I used historical daily price changes of SPXL to develop a simple mathematical simulation of how SPXL would react to S&P 500 price changes output from the random future market generator.
The data comes from 1964 to 2018, with an average return of 6.8% pa (ignoring dividends).
The results
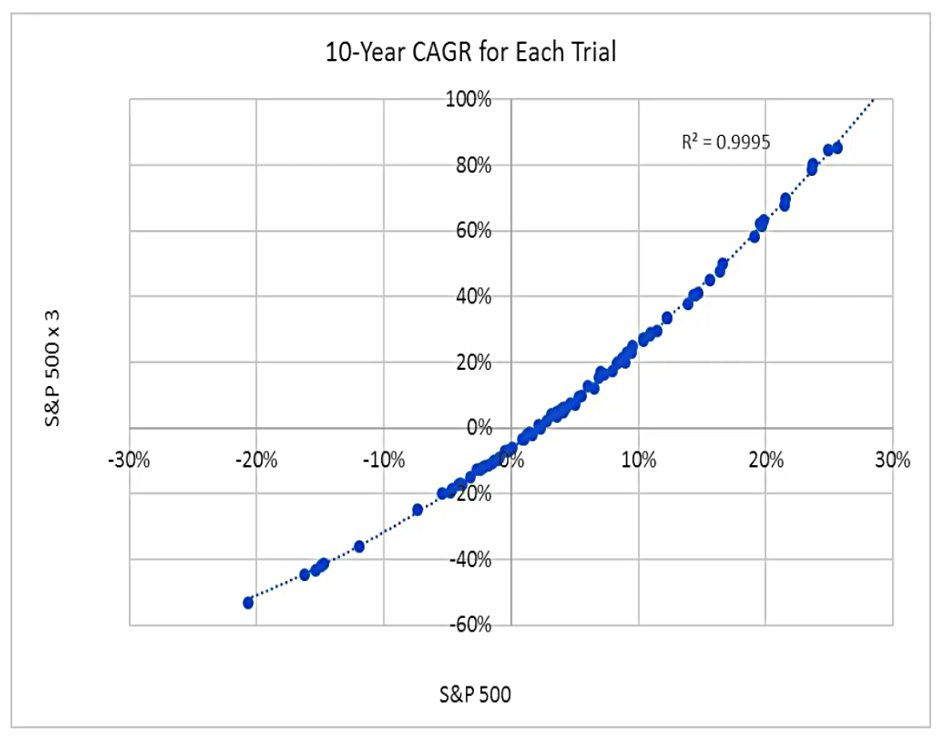
The chart shows the CAGR relationships between 100 trials of 10-year SPLX simulations and random SPX returns (ignoring dividend reinvestment).
- There is a very predictable relationship between returns, and the multiple is somewhat less than 3x (eg. for SPX = 10%, SPLX = 25%).
Also:
When the S&P 500 annualized price returns are slightly positive (in the 1% to 4% range), SPXL would lose money. When the S&P 500 10-year CAGRs exceed 3.5%, SPXL returns exceeded the S&P 500 returns.
This is the 40th percentile of the (simulated) future returns distribution, so you have a 60% chance of outperformance with SPXL.
The assumes that future S&P returns will match the historical data.
- You might feel that future returns will be lower – if returns averaged 3% pa, you would have a greater than 50% chance of underperforming with SPXL.
It also assumes that SPXL behaves as it has in the past.
What would happen if SPXL started to drift toward a perfect 3x relationship instead of the historic averages of 3.44x up and 2.89x down?
Clearly, a lot (but by no means all) of the outperformance would disappear.
- And of course, SPXL performance could become more skewed rather than less.
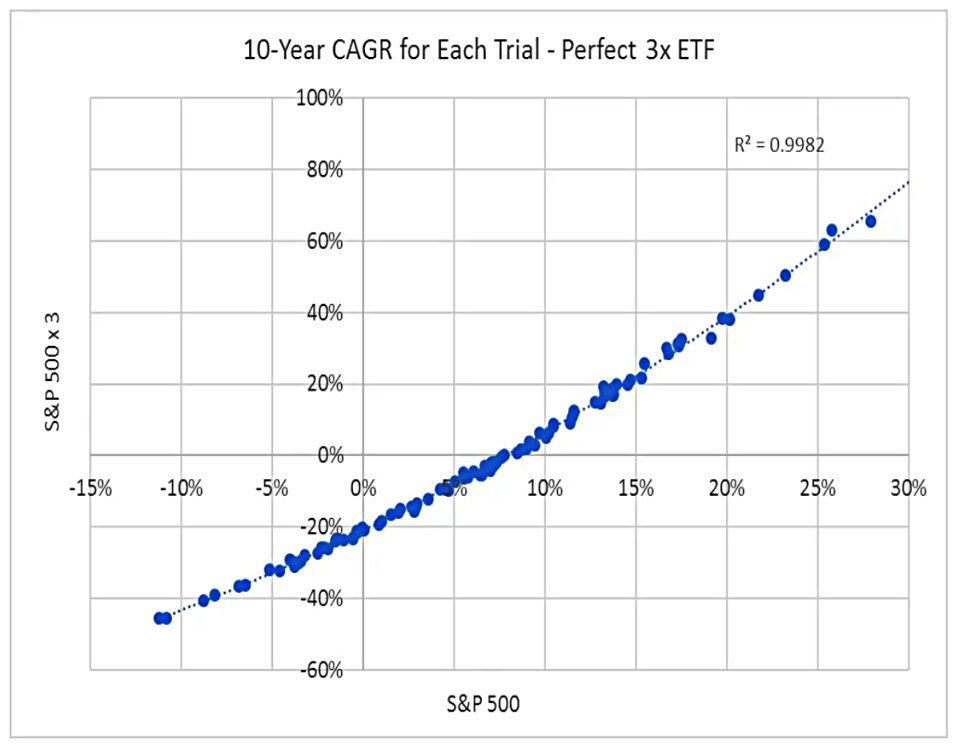
This [perfect 3x behaviour] shifts the CAGR relationship between the S&P 500 and the 3x leveraged ETF substantially in a negative direction.
The breakeven point is now 11.5% pa return from the S&P 500, which gives a 71% chance of underperformance.
- There’s also a 57% chance of negative performance from the perfect 3x ETF.
Another tug
So that was the end of Karl’s first article, looking at a single 3x ETF.
- But one of the comments on the article pointed him at the HFEA portfolio, and so in November 2020, he returned with a second post.
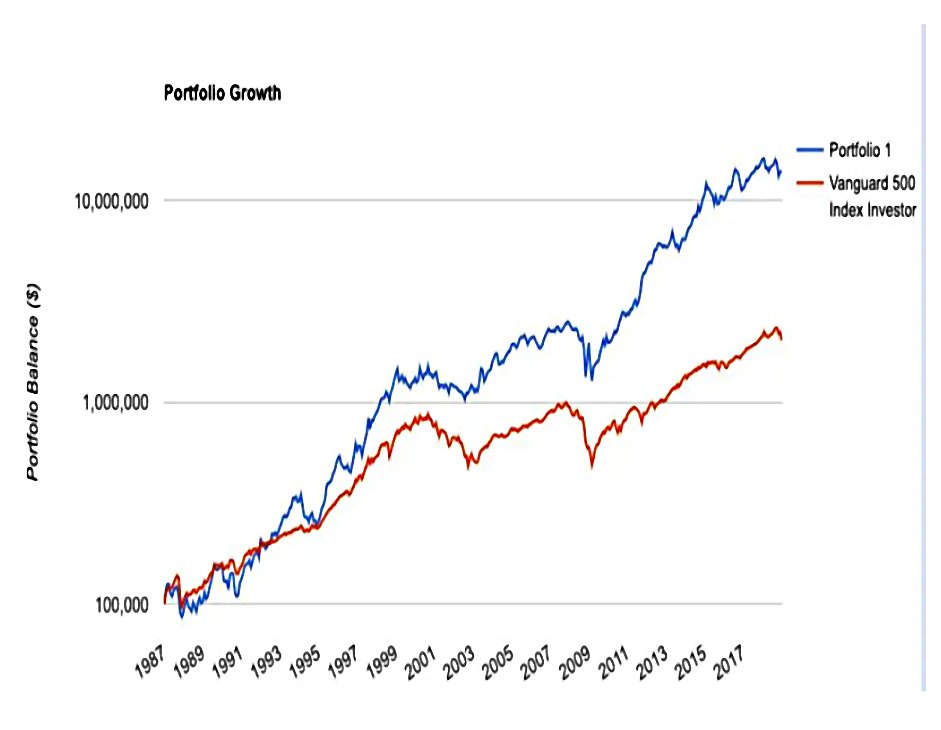
As we know, the HFEA portfolio beats the S&P 500 (the chart goes back to 1987).
- Karl’s first point is that this 30-year period was a massive bond bull market, where long bonds frequently outperformed stocks.
That said, there are rarely simultaneous (government) bond and stock crashes, and it usually takes very sharp increases in interest rates to hit stocks hard.
Headwinds and tailwinds
Karl looked at the distribution of headwinds and tailwinds over the simulated dataset (1964 to 2018) used to discuss HFEA on the Bogleheads forum.
- Rising interest rates = bonds headwind
- Falling interest rates = bonds tailwind
- Rising PE ratios = stocks tailwind
- Falling PE ratios = stocks headwind

Stocks had a tailwind 55% of the time, and bonds had a tailwind 59% of the time.
- Simultaneous tailwinds only occurred 44% of the time, and simultaneous headwinds were present 30% of the time.
Next, Karl looked at how a 50/50 portfolio of UPRO and TMF would have performed under these regimes. (( HFEA is actually 55/45, but the comment on Karl’s original post mentioned 50/50 ))
- It’s not clear whether Karl is implementing quarterly rebalancing, or just buy and hold. (( Karl says that his numbers closely match HedgeFundie’s over 64 years ))
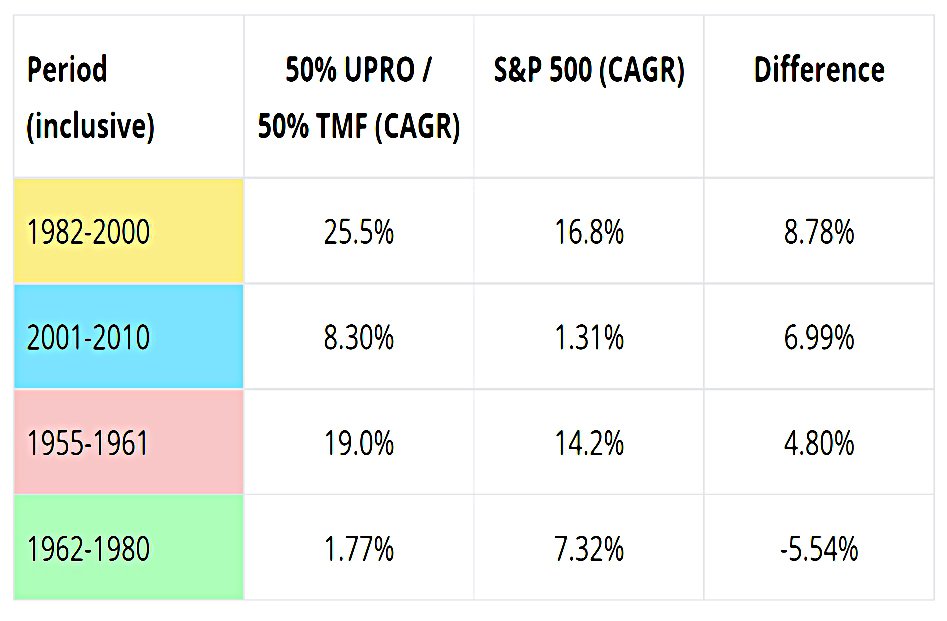
The only regime where HFEA doesn’t outperform is when both stocks and bonds have headwinds.
- 2011 to 2018 matches the yellow regime; Karl chose 1982-2000 because it was longer.
Karl concludes that this data gives HFEA a 70% chance of outperformance.
Sequence risk
Karl wanted to analyse what might happen when two regimes occurred one after another.
- The following three charts all have the difficult green regime second but vary the preceding regime.
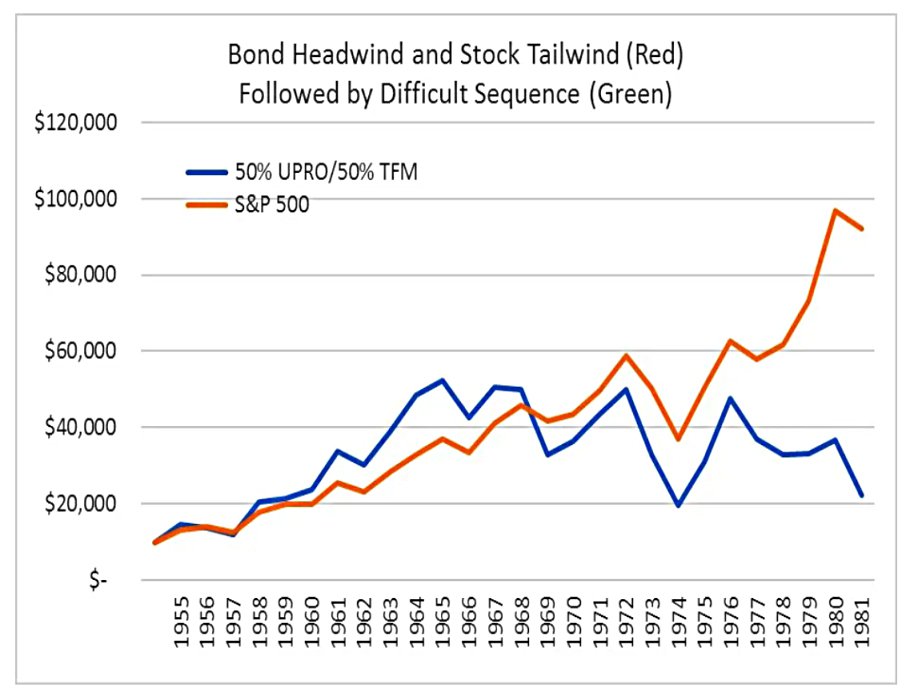
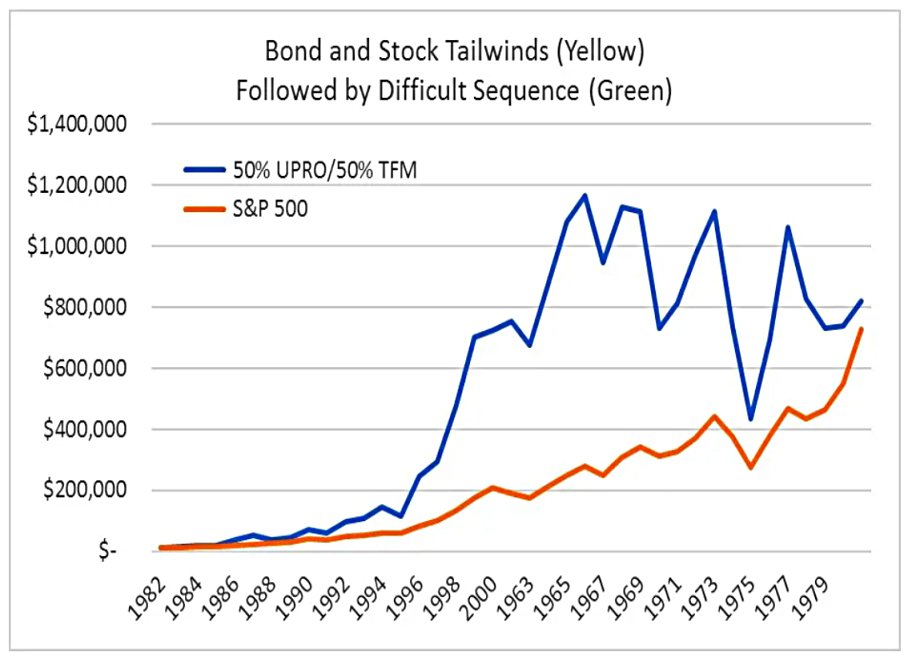
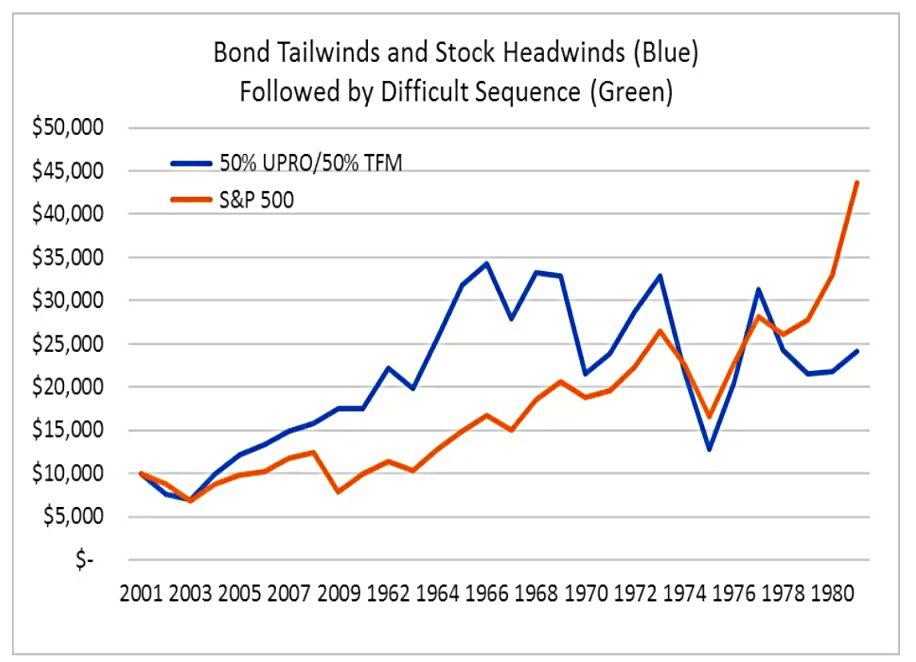
Bond headwinds followed by dual headwinds is the worst sequence for HFEA, but even in the other two cases, the S&P 500 either catches up or overtakes HFEA.
- So we want to avid dual headwinds if we can.
No data is provided on how frequently these three patterns might be expected, and I’m not sure that it could be.
- Instead, we need to assess how well we think the future will match up to the period that has been analysed.
Future returns
Karl felt in 2020 that future returns would be lower than past returns.
- He plugged these projections into a model of future returns for UPRO and TMF.
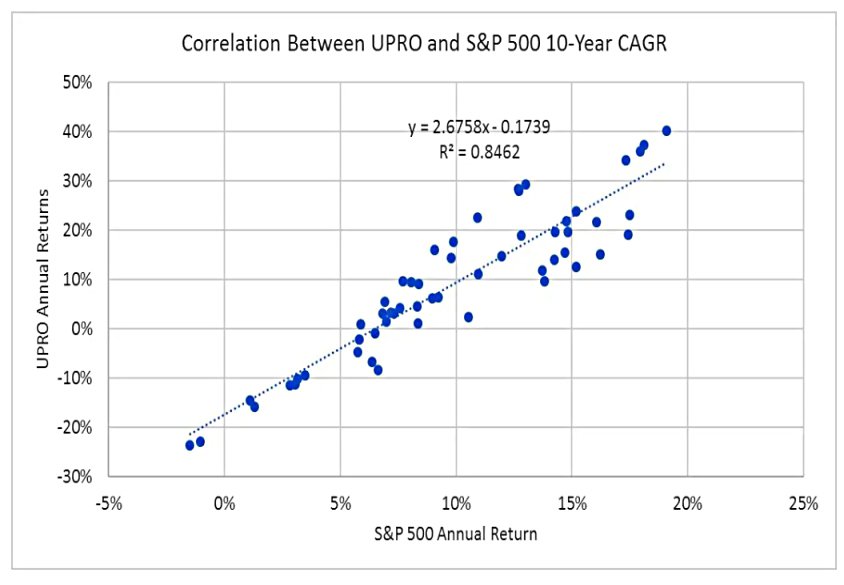
For stocks, I calculated 10-year CAGRs on a one-year rolling basis going back to 1955 for both UPRO and the S&P 500. I plotted the CAGRs in this scatter plot, which also shows the best fit line with a very respectable r-squared value of 0.85.
Karl’s projected 5% pa return for the S&P 500 gives us a 10-year CAGR for UPRO of -4.0% pa.
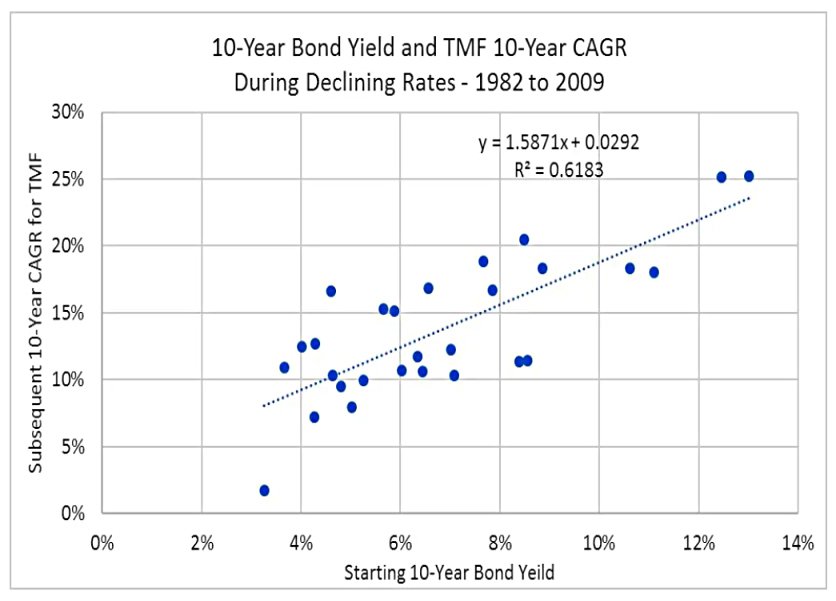

For bonds, I plotted the past one-year rolling 10-Year CAGRs for TMF against the starting 10-year bond yield for each period.
HFEA uses long-term (30-year) bonds but Karl thinks the data is too spotty so he’s swapped in the 10-year.
There are two plots because the relationship is different when interest rates are rising versus declining.
Using the “current” (2020) 10-year bond yield of 0.85% as the likely forward return, Karl gets two answers:
- CAGR of -13.2% for the next 10 years, if rates are generally rising
- CAGR of +4.3% for the next 10 years, if rates are generally declining.
Karl is not convinced that the Fed is no longer prepared to raise rates substantially (as many on the Bogleheads forum argue) and thinks that negative rates are even less likely.

Plugging in these numbers (and using annual rebalancing), Karl comes up with very different answers depending on the interest rate regime.
- With declining rates, HFEA still outperforms, but with rising interest rates, the HFEA CAGR is 8.4% below that of the S&P 500.
Conclusions
Karl eventually came around to the idea that HFEA can work, though he doesn’t feel it’s worth the risk of underperformance.
- More importantly, he expects low returns and rising interest rates in the near future, which are both negative for the HFEA.
It’s no great shock that if you expect both bonds and stocks to do poorly, leveraging up a portfolio of these two assets will not fix the problem.
- But Karl is right to point out that HFEA is a gamble on future conditions, and I don’t believe that it’s suitable for a large proportion of your overall portfolio. ((HedgeFundie himself has said that he only has 15% of his assets allocated to HFEA ))
However, I do still think it’s worthy of further investigation.
- Until next time.
Mike Rawson
Mike is the owner of 7 Circles, and a private investor living in London. He has been managing his own money for 40 years, with some success.