Morningstar Safe Withdrawal Rates

Today’s post looks at a recent report from Morningstar on Safe Withdrawal Rates.
Contents
Safe Withdrawal Rates
We’ve looked at SWRs on many previous occasions, though not for a while.
- The report we’re looking at today – called The State of Retirement Income – dates to November 2021, and Morningstar have said that they will provide annual updates.
SWRs are hard because we don’t know when we will die, and we don’t know what future returns will be.
- We need to strike a balance between living more frugally than we need to and running out of cash.
The starting point for most people on withdrawal rates is the 4% rule which originated in the States in the 1990s with William Bengen.
- For a variety of reasons (including the UK vs the US market, retirement time horizons, and starting stock market valuations and bond yields) we have found that 3.25% pa is actually a better starting point for UK investors.
You can do better than this with dynamic rules (which we’ll discuss below) but 3.25% makes a good set-and-forget failsafe rate for a retiree who doesn’t want to run out of money over 40 years or more.
- Of course, in practice, people tend to spend less as they get older, particularly after the age of 75 – so there is a margin of safety built-in here. (( There’s also a spike right at the end of life, as health and care costs rise ))
Financial planner Michael Stein called the lifestyle phases that underpin that spending trajectory the “go-go,” “slow-go,” and “no-go” years.
Asset allocation is also important, as we’ll see.
- And the target success rate is also a factor – I target 100% success, but lots of the literature will settle for less.
Bengen looked at a 50/50 stock/bond portfolio and targeted a 30-year retirement with a 90% success rate.
- Morningstar’s paper revises the 4% rule down to 3.3%, very close to my own rule of thumb.
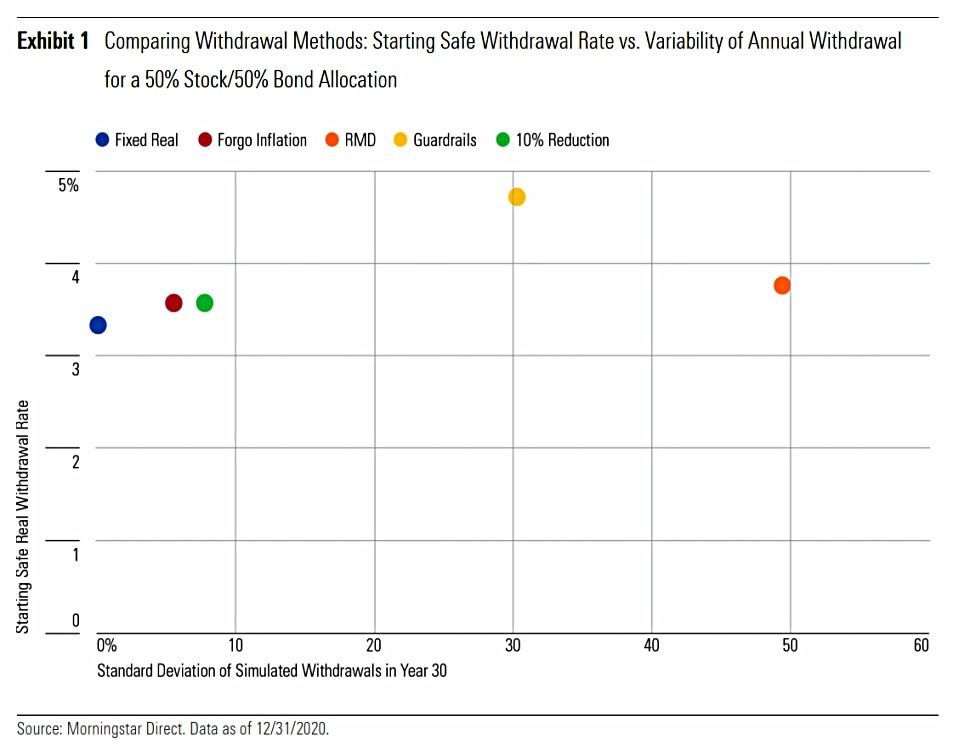
The first chart in the paper compares the impact of the various tweaks it considers:
- Ignoring inflation
- RMDs (age-related minimum withdrawals, popular in the US)
- Guardrails (dynamic withdrawals)
- 10% reduction
All of these increase the starting withdrawal rate at the expense of more variability in potential (simulated) withdrawals in year 30.
By tethering spending to market conditions, variable strategies lead to more efficient portfolio consumption but lower ending balances in many cases.
Returns
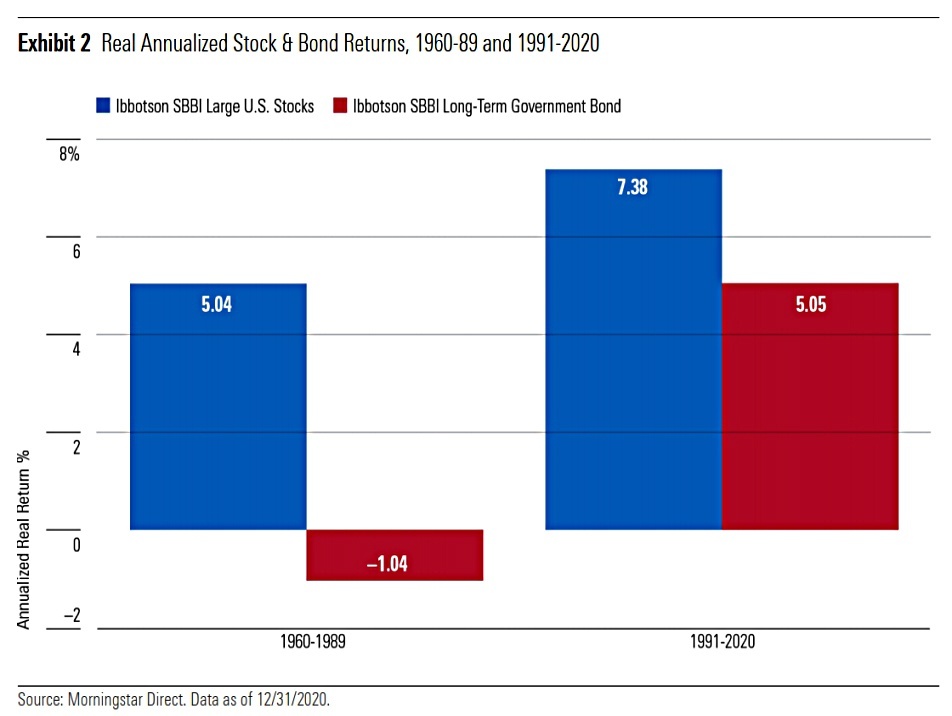
The past 30 years have been exceptionally strong for both stocks and bonds, supporting a high safe withdrawal rate. But the 30-year period that preceded it was much less robust, especially for bond investors.
Inflation has also been low in recent decades and looks to be making some kind of a return.
Inflation averaged just 2.5% from 2000-10 and dropped even lower, to just 1.9%, from 2011-20. But retirees in other eras have not been so lucky. Inflation averaged 7.4% per year in the 1970s and more than 5% per year in the 1980s.
History
Morningstar used the following assumptions:
- 30-year time horizon
- This is too short for me – I expect to be retired for 35 to 40 years
- Withdrawals are inflation-linked, but taxes are ignored
- The inflation regime has a big impact on bond returns in particular, so this can be significant
- Monte Carlo simulations are used (randomised annual returns)
- I don’t like Monte Carlo because it ignores the sequencing found in equity returns (very bad years are usually followed by very good ones)
- 90% success rate
- I have a big problem with this – I have one shot at retirement, and I need certainty
- Six asset allocations (portfolios) – 100%, 75%, 50%, 25% and 0% stocks, with the rest in bonds and cash, and “the matress” (cash).
- The lack of international diversification and absence of other assets like commodities, gold, PE, VC, hedge funds and trend-following is disappointing.
Here are the results:

From that chart, most people would probably choose either 75% or 50% stocks.
Stocks have more volatility, but generally produce higher SWRs and higher terminal values.
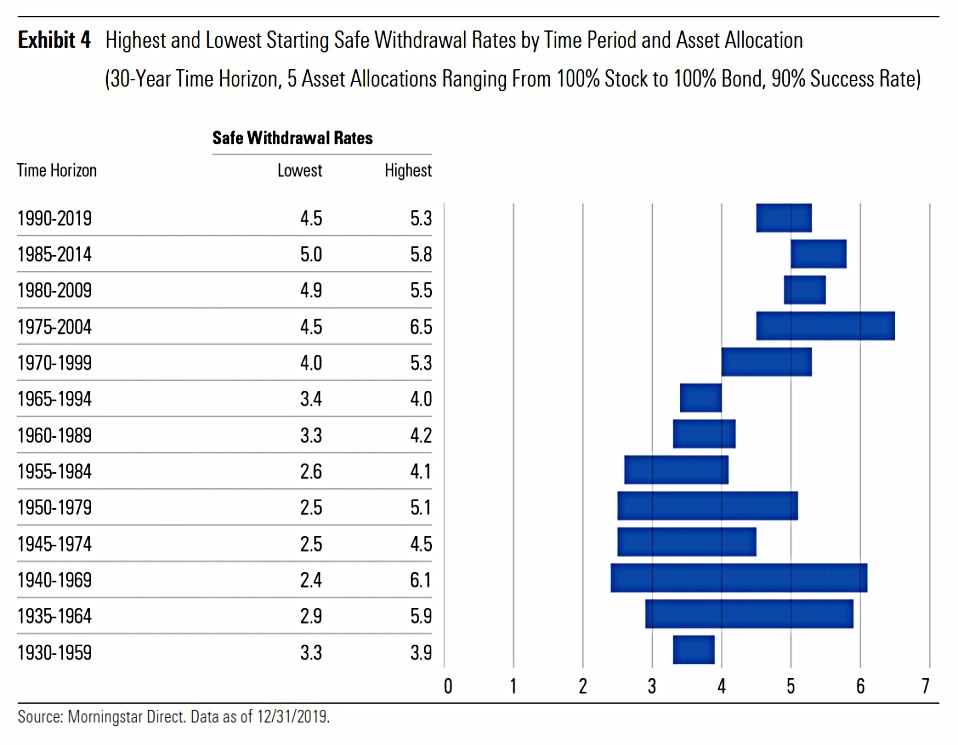
Looking at overlapping time periods, varying economic conditions mean that sometimes asset allocation is very important, and at other times it makes little difference.
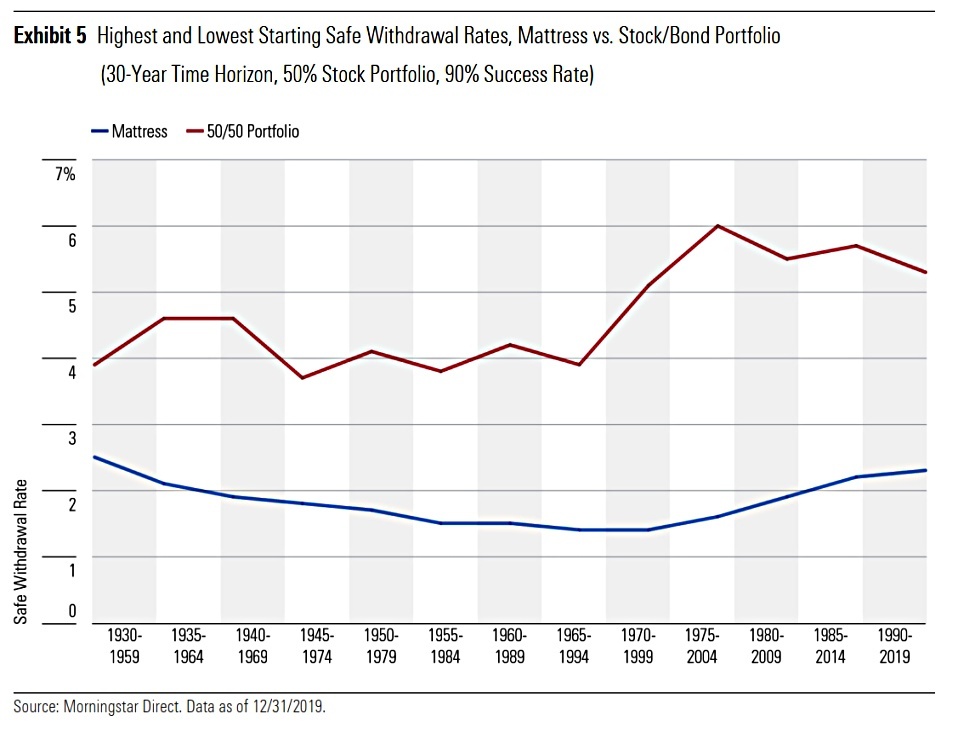
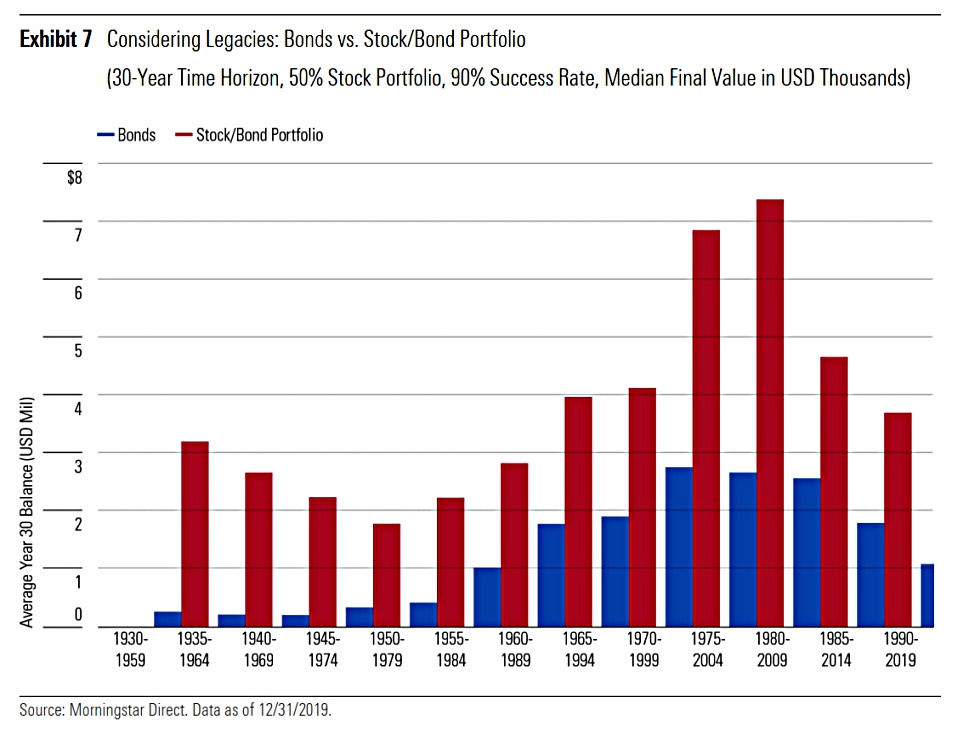
The next chart shows the vulnerability of the mattress portfolio (which offers a nominal 3.33% pa if depleted over 30 years) to inflation.
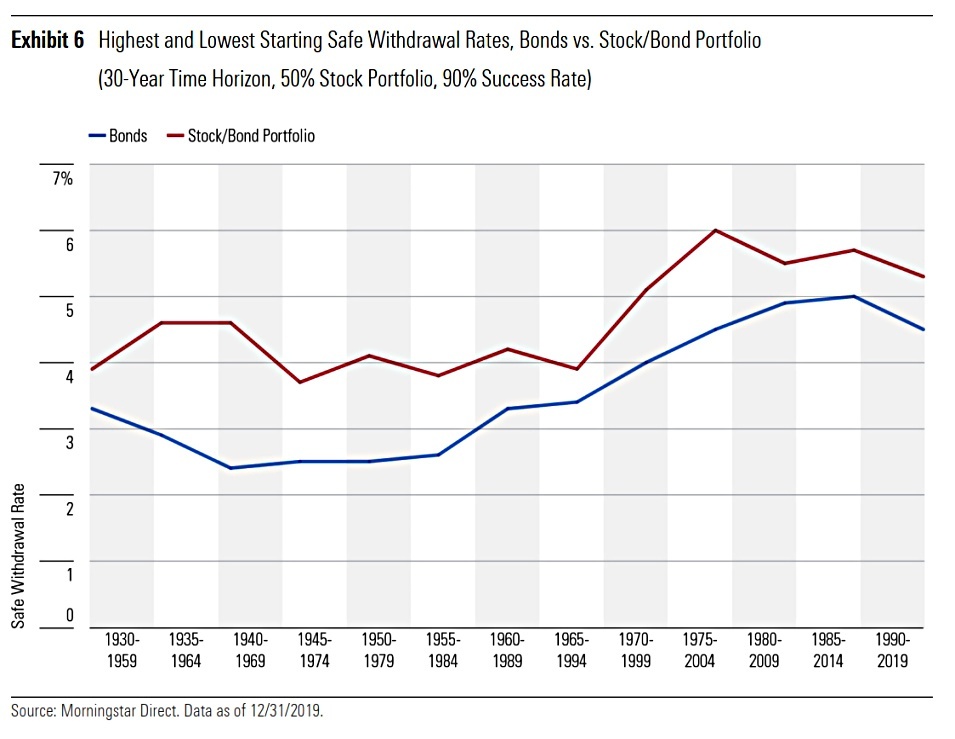
The 100% bonds portfolio has similar issues.
The future
The next few decades probably won’t look like the last few:
- stocks returns will probably be lower
- bond yields could rise, which will increase returns in the long run, but hurt them in the short term
- inflation could return, potentially affecting both stocks and bonds
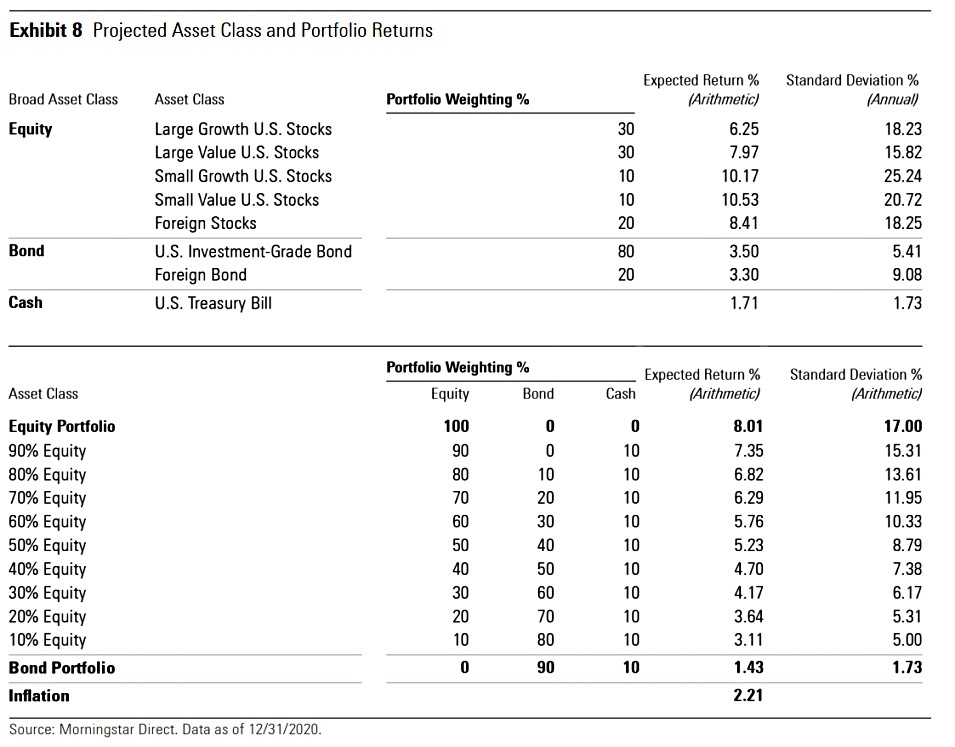
To help deal with this, Morningstar broadens the portfolios it looks at:
Projecting future results permits the use of more varied portfolios than when assessing past performances. The data limitations have been eliminated. Consequently, unlike with the historic portfolios, which held only U.S. assets, the forward-looking portfolios contain foreign securities. They also incorporate separate estimates for growth- and value-style equities.
The tables below show the Morningstar estimates for future returns:
SWRs can be derived from these estimates:
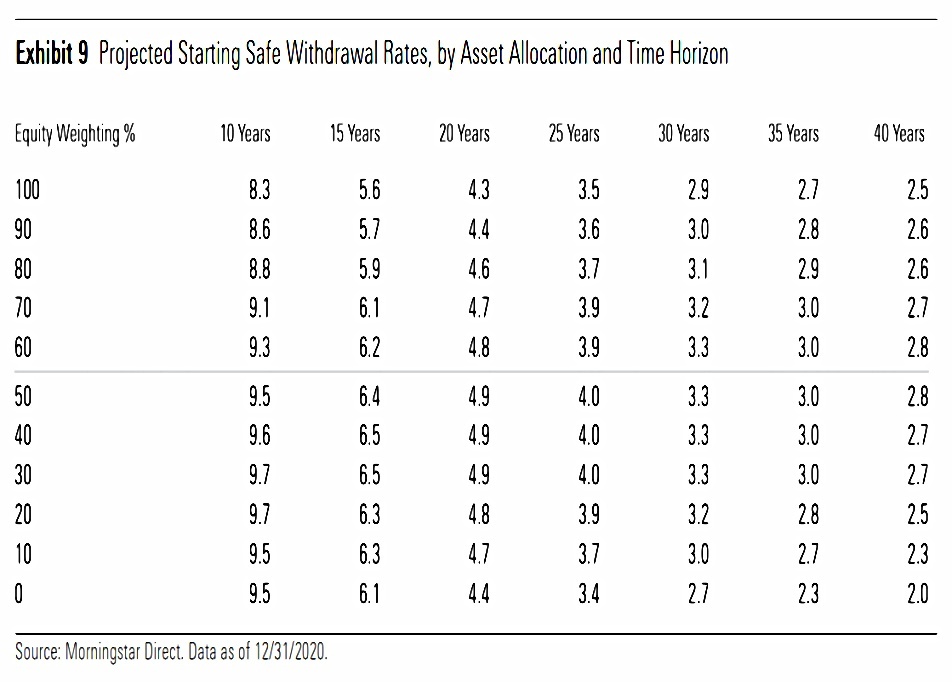
Note that time horizons have now been extended to 40 years, but target success rates remain at 90%.
- The SWRs are lower than before, with a 70% stock portfolio producing 3.2% over 30 years, or 3% over 35 years.
30% to 60% stocks looks like the sweet spot going forward.
Flexible strategies
The paper looks at four strategies:
- Forgoing inflation adjustments
- Using RMDs (age-related minimum distributions)
- Guyton-Klinger guardrails which rachet up and down depending on market performance
- 10% reduction in withdrawals after a down year
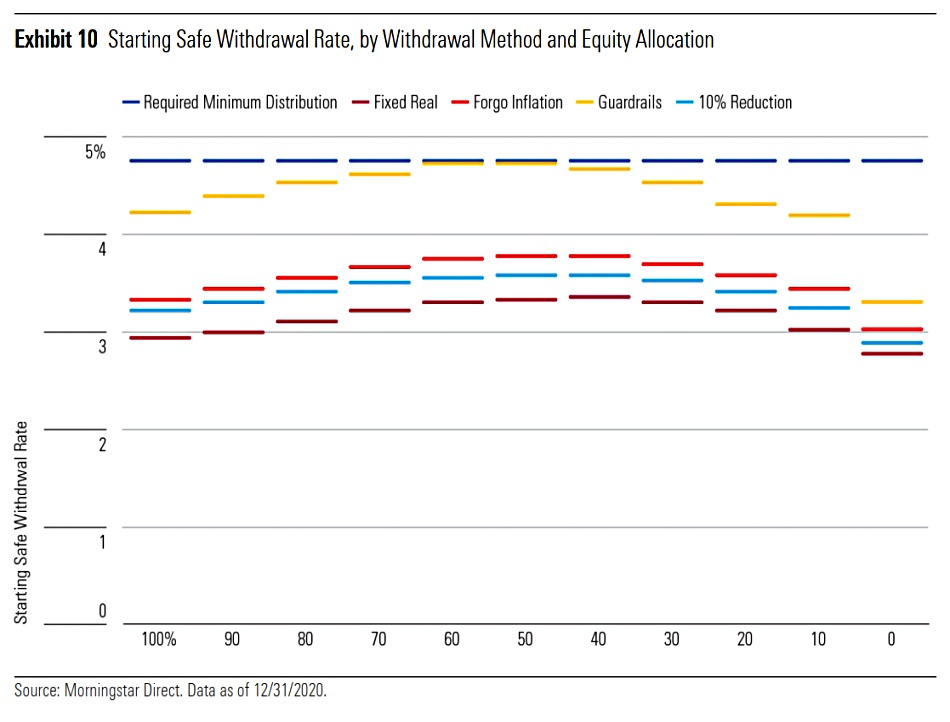
The first comparison is the starting SWR.
- All the flexible methods look good here (using the 90% success target).
- A balanced equity allocation works best.
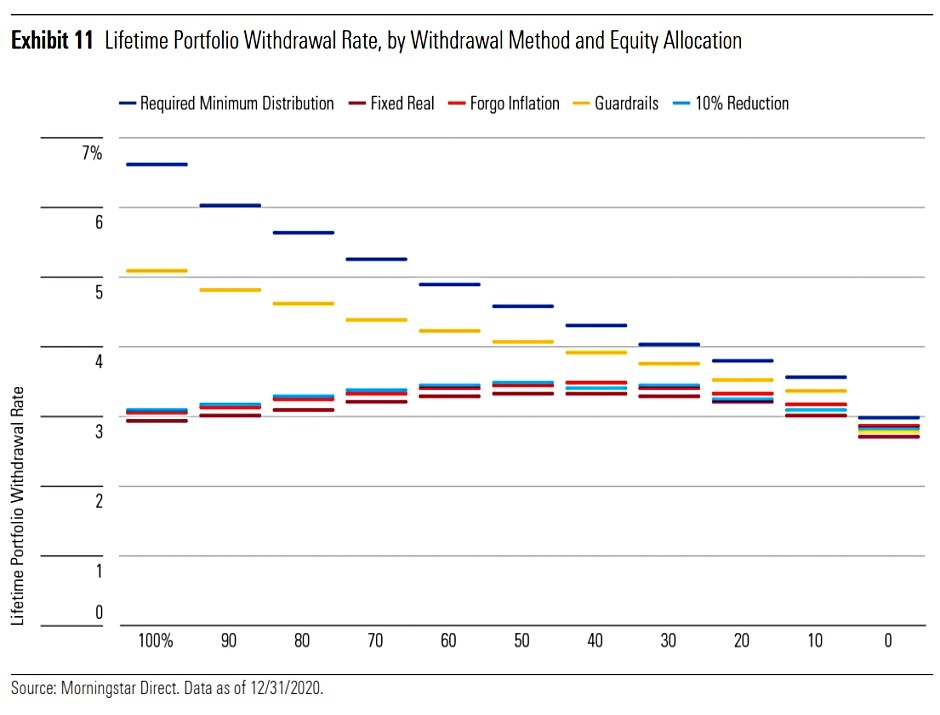
Looking at lifetime SWR, RMDs and guardrails come out best, particularly with higher equity allocations.
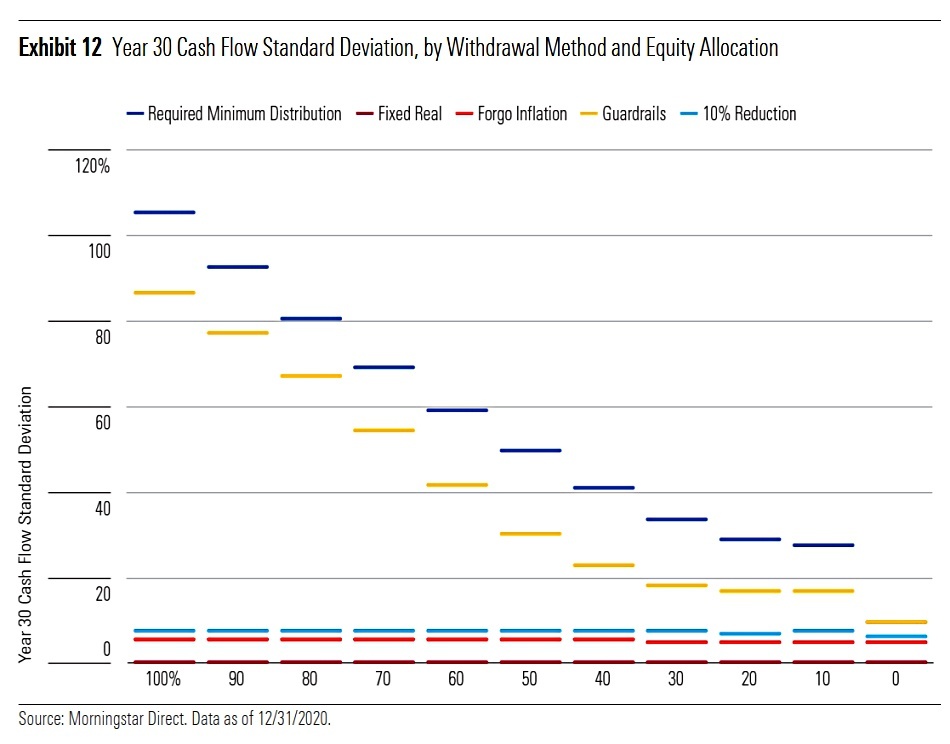
The first trade-off for this is increased variability of returns.

The second trade-off is in the terminal value (in year 30).

The table summarises the numbers for the flexible methods.
Additional Strategies
The next two chapters of the report run through some ways to boost your SWR, but they are all pretty obvious and/or undesirable:
- Use tax shelters
- Keep your costs low
- Sell expensive assets to fund cashflow (basically, follow a rebalancing strategy)
- Reduce your target success rate (not for me – I’m aiming for 100%)
- Use “inflation-minus” uplifts to reduce spending as you age
- Improve investment performance (I’m not sure how to do this beyond getting your asset allocation right)
- Delay retirement
- Reduce your living expenses
- Make use of state pensions, DB pensions and annuities
- Tap non-portfolio income streams (side hustles, passive income, royalties etc.)
Getting ready
Chapter 9 of the report looks at the retirement process:
- Set a retirement date
- Work out your expenses (cash flow needs)
- Access your non-portfolio income streams
- Choose a withdrawal system
- Work out which accounts you will access first
- Implement an asset allocation to match your cash flow needs and time horizon
Conclusions
I didn’t expect this report to have any impact on my own SWR.
- My living expenses only amount to 0.7% of my portfolio, so I don’t need to optimise my withdrawal rate too closely.
I use a hypothetical rate of 3.33% when I benchmark my portfolio performance, but otherwise, I don’t think too much about it.
- At the same time, it’s always good to know how the industry sees problems like this, and which solutions they are actively marketing.
For me, the worrying part of the paper is the underlying assumptions that are still in use almost 30 years after Bengen’s initial paper:
- A 30-year retirement, and
- A 90% success rate.
I know a lot of people are aiming to retire younger than the state pension age, and many of them will be keen on a 100% success rate for their only shot at retirement.
- I also think the use of a simple stock/bond portfolio lacks ambition, but multi-asset portfolios appear to still be beyond most investors.
I accept that the variable withdrawal systems in the paper can be used to boost SWRs, but they come with trade-offs (primarily variability of cash flows and an increased risk of spending your inheritance).
- For those whose pension pot is in the 25x to 33x range (compared to annual expenses) they could prove useful, but the best solution is to save more in the first place.
Perhaps the most interesting point is that lower expected returns in the future point to a lower equity allocation, but there are a couple of caveats:
- The result depends to an extent on low inflation, since higher inflation would impact bond returns differently
- We don’t know how a 100% success target and a 35- or 40-year retirement horizon would impact the ideal allocation
Until next time.
Mike Rawson
Mike is the owner of 7 Circles, and a private investor living in London. He has been managing his own money for 40 years, with some success.


Your low living expenses rate [0.7%] implies, at least historically, that a perpetual portfolio is likely. Is your living expenses rate calculated from just financial assets or is it derived from a broader perspective, e.g. total wealth?
I base everything I do on total wealth. Mental accounting impacts decision-making.
And in the real world, my withdrawal rate (but not my spending) is determined by the tax system, and the maximum cash flow I can efficiently generate.
Thanks and I agree.
The only point I was making was that your living expenses rate is not exactly comparable with the withdrawal rates quotes in, so called, safe withdrawal studies – which is normally set by the first w/d only.
Some examples could include: a) you might elect to w/d more than is strictly necessary to optimize vs taxation – depending on how you optimize, b) the presence of property in the denominator reduces the apparent overall rate, c) fixed income payments, etc
To me, that’s all mental accounting. The question is whether you will run out of money before you die. The failsafe withdrawal rate is 3.3% pa (approx). If you spend less than that you should be fine. I spend 0.7% pa.
That’s the only comparison I am making. IFAs (and financial services firms like Morningstar) may have other objectives when calculating an SWR.
Bill Bengen, the investor of the 4% rule, has revisited his study to include recent data. He now suggests 5% may be appropriate for many. Perhaps time to revisit this one?
I think Big ERN’s work on SWRs is the most important. 5% will work most of the time, but I want a failsafe rate, and that means looking at times when equity valuations are high.