Online Retirement Calculators

Today’s post is about online retirement calculators and how the results they produce vary because of the different assumptions underlying them.
Trustnet article
In the June 2020 issue of Trustnet magazine, John Blowers (( I couldn’t find a picture )) looks at the online pension calculators on offer in the UK. (( I found this article on Monevator, who in turn was tipped off by one of his readers ))
He looked at five platforms:
- Aviva
- Barclays Smart Investor
- Fidelity
- Hargreaves Lansdown, and
- Interactive Investor
He also used his own spreadsheet and a calculator from Cass Business Scholl/Whole Money, designed to calculate a safe withdrawal rate (SWR).
He was surprised that AJ Bell, Charles Stanly and Bestinvest didn’t offer calculators.
- I’m less shocked – my main platforms are AJ Bell, X-O, Fidelity and iWeb, only one of which offers a calculator.
But I’d prefer to use my own spreadsheet in any case.
The scenario
John looked at a 55-year-old man who wanted to retire at 65.
- He has £250K in his pension
- He will add £2K per month for the next 10 years (another £240K)
- His target income is £36K pa (excluding the state pension, an additional £9K pa)
This is a high target income, and a quick back-of-the-envelope calculation makes it sound like a stretch to me:
- Median base pot size (contributions only) is £370K ( = £250K + £240K/2)
- 3% real growth over 10 years is 34%
- This brings the pot size at retirement to just under £500K
- A 3% SWR (after charges of 0.5%pa) means that the pot will only generate £15K pa
Obviously, the calculators can assume that the pot will run down over the rest of John’s lifetime from 65.
- That should just about get him to age 89, at £21K pa of “overspend”.
So this is a tight situation, but not an impossible task.
The questions
The questions that John wanted the planners to answer were:
- What would his pension be worth at age 65?
- Could he afford to retire a couple of years earlier than that?
- What income would the pot provide in retirement?
- What would a “more realistic” scenario look like, with income tax removed and the state pension added on?
The outcome
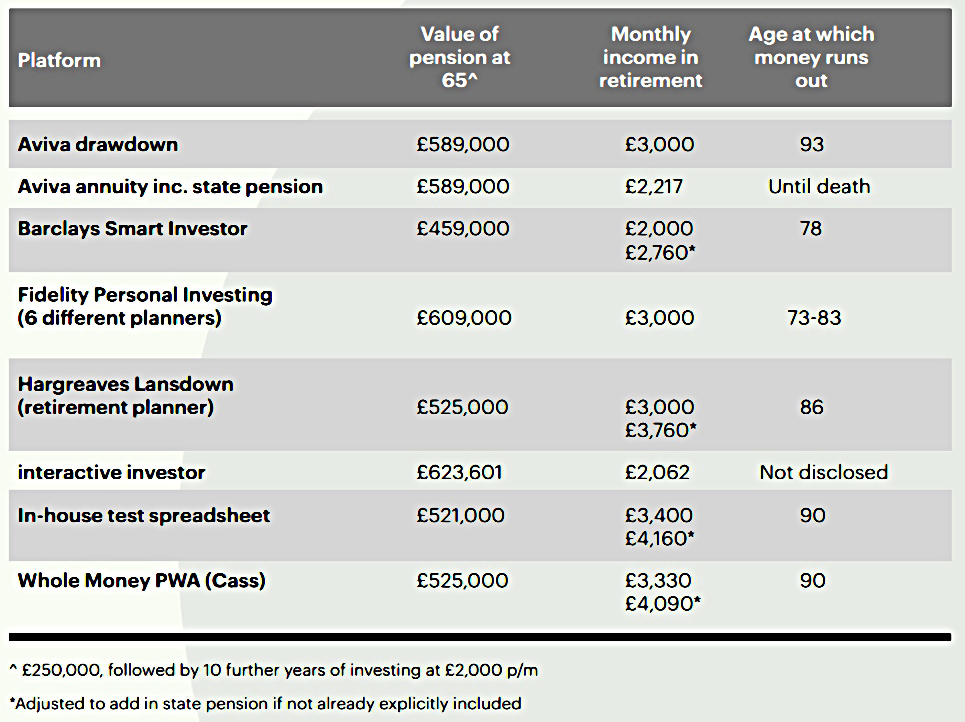
Surprisingly, he found little agreement between them on how much money he would have in retirement.
- The age at which his money would run out varied by 15 years
- The pot size at age 65 varies by £165K, even though John’s scenario only covers 10 years of growth.
The pot sizes are in general larger than my own back-of-the-envelope calculation, so there are some optimistic assumptions in there somewhere.
- Despite the larger pots, the calculators come up with an average age for pot exhaustion which is similar to mine (though with wide variation).
The pots generally translate into the £36K income John is after, with a couple of exceptions.
John notes that the top priority for financial advisors is protecting themselves from the regulator, and wonders whether regulatory pessimism is part of the problem,
- I think what he’s getting at is that advisors (and by extension, online planners) are always likely to recommend a safe option – one that can be justified later.
I see what he’s getting at, but even my own planning calculations are rooted in past outcomes and the likely returns of the future.
Assumptions
The variation in the results is more likely to reflect variation in the underlying assumptions used by each platform, so let’s dig into them:
- Aviva assumes charges of 0.8i% pa and median growth of 3.5% in accumulation and 2.4% in drawdown.
- HL uses a 4% growth rate.
- Interactive investor assumes 3.17% growth but uses 4% withdrawals in retirement
Nothing too shocking there, and not too much to go on.
- The wide variation in outcomes from the online planners means that I remain convinced that it’s better to build your own spreadsheet.
Conclusions
The best approach to retirement planning is to keep it simple:
- How much money do I need and when?
- What do I think is a safe withdrawal rate?
- How fast do I think my savings pot will grow? (Hint: it should probably be the same rate as your SWR).
- What asset allocation do I need to be confident of achieving that growth rate?
For most people, a 3% SWR means that you need a pot that 33 times your annual spend so that you can retire.
- Now a simple spreadsheet can roll the growth of your savings (at 3% above inflation each year) forward until you hit that goal.
To be confident of a 3% growth rate, you’ll also need an asset allocation which around 75% equities.
- Don’t fall into the trap of lowering your allocation to risky assets in retirement – it’s the period either side of retirement where you are vulnerable to a market crash.
And of course, you should minimise costs and maximise your use of tax shelters.
If you are lucky enough to have DB pensions and/or you feel confident about the state pension. you’ll need to factor these in.
You have two choices:
- Calculate the present value of these pensions and add that to your pot size
- Use a cash flow model to reduce your spend by the amount of these pensions when they become due.
And that’s it.
- Until next time.
Mike Rawson
Mike is the owner of 7 Circles, and a private investor living in London. He has been managing his own money for 40 years, with some success.


I agree with your DIY conclusion.
The reality is that even apparently very small changes in the key assumptions can have quite a dramatic impact on the model outputs. This is primarily due to the number of years modelled.
The best way I found to understand this was to build my own tool and then play with it.
IMO, it is also worth reading William Bernstein’s “The Retirement Calculator from Hell” series of articles, a succinct summary of which is given at:
https://www.mcleanam.com/william-bernsteins-the-retirement-calculator-from-hell/
Interesting article. I have a question about point 3 that you made. I’ve always thought that SWR should be lower than expected returns because it has to allow for sequencing risk of withdrawing cash during a market crash which isn’t as relevant during the investment phase. I’ve found some of the monte carlo simulators interesting in terms of showing potential drawdown scenarios, although all the ones I’ve found are based on US stocks which doesn’t really reflect a UK investor’s portfolio. I do agree though that sticking to a simple model has a lot of pluses given that assumptions are just that.
You’re right of course, but it all depends on what you mean by “expected”.
I’ve internalised the failsafe return of a diversified portfolio (say 3.25% real pa) to such an extent that I refer to that as the expected return – hence the confusion. So when I say expected, I don’t mean the median, and I’ve factored in the sequencing risk (and the starting CAPE, which is another big influence).
Once you have decided on an SWR, I’m not sure how it helps to think of the portfolio as returning more than that. Of course, I’m already in decumulation, and someone with many years to go before they reach FI might feel differently.
Mike