Rabener on TAA

Today’s post looks at three articles from Nicolas Rabener on the subject of Tactical Asset Allocation (TAA).
Contents
Rabener

We have look at the work of Nicolas on several previous occasions.
- He runs the analysis firm Finomial, which used to be called Factor Research.
TAA ETFs
In 2022, Nicolas wrote three pieces about Tactical Asset Allocation (TAA).
- The first is called “Defining Tactical Asset Allocation”.
It looks at TAA ETFs to see whether their characteristics can justify them charging higher fees than plain index ETFs.
TAA strategies invest across asset classes dynamically. Many focus just on equities and bonds, while others also include REITs, currencies, and commodities. A managed futures strategy, also called a CTA, that goes long or short hundreds of asset classes, is the ultimate version.
I would separate out CTA funds since they are usually based on trend-following, but I take Nicolas’s point.
Nicolas found 15 US ETFs that he would classify as TAA. (( When I checked their prices just a few months later, it looked like three of them were no longer available, but your mileage may vary ))
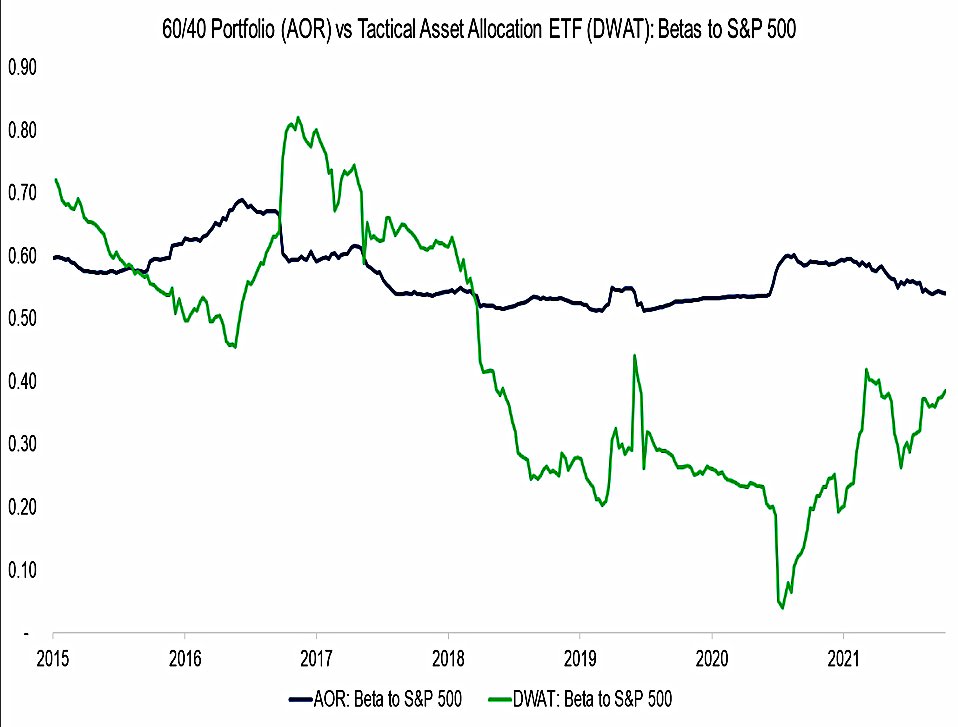
- He compares these funds with the iShares Core Growth Allocation ETF (AOR), as a proxy for a 60/40 portfolio, to determine their betas to the S&P 500 and to US bonds.
The Arrow DWA Tactical ETF (DWAT) is the TAA ETF used in the charts above and below.
AOR’s beta to the U.S. stock market was almost consistently between 0.5 and 0.6, compared to a significantly wider range between 0.1 and 0.7 for DWAT. DWAT is indeed allocating tactically.
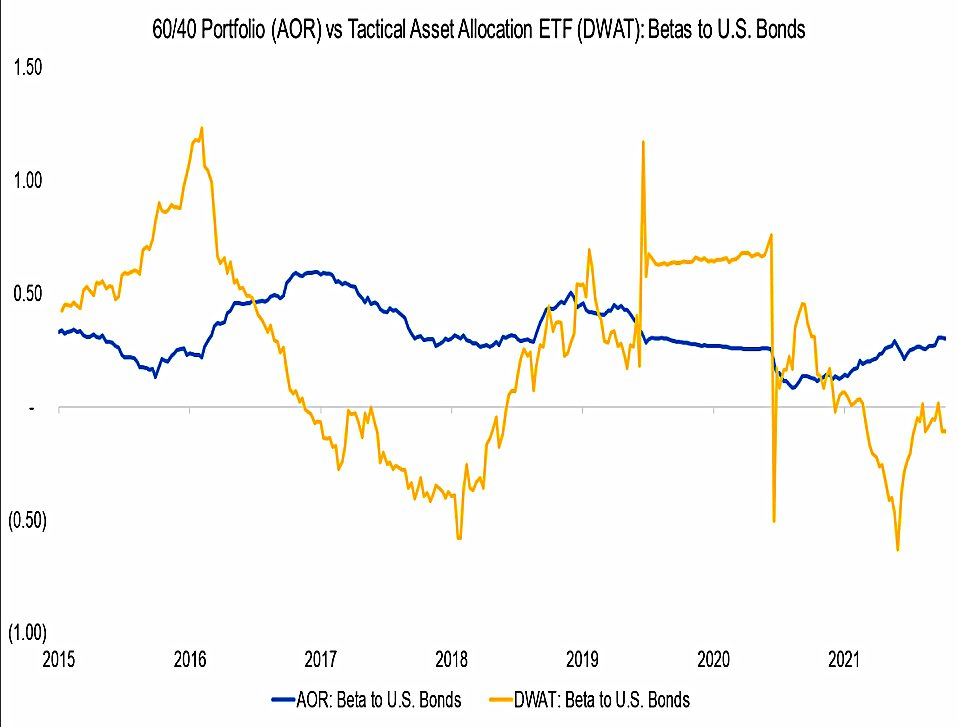
We observe similar differences in betas to U.S. investment grade bonds for AOR and DWAT. The former had an almost consistent exposure of approximately 0.4, compared to a range between -0.6 and 1.3 for the latter.
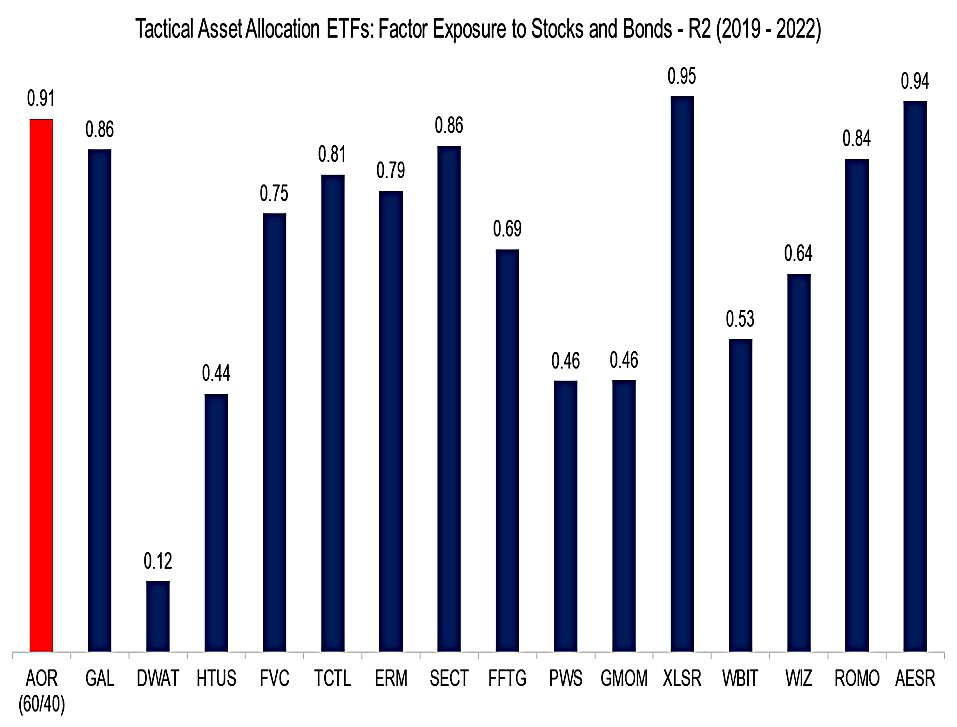
Nicolas looked at the 15 TAA ETFs from 2019 to 2022 (which includes a bull market and a crash), comparing them to the S&P 500 and to bonds.
The R2 for the regression analysis ranges dramatically across the ETFs. Strategies with low values can be considered more attractive given that we were not able to well explain their returns with U.S. stocks and bonds. In contrast, some ETFs had an R2 close to or above that of a 60/40 portfolio, which was 0.94.
Top of the class is DWAT, with HTUS, PWS and GMOM as runners-up.
- WBIT, WIZ and FFTG had middling scores, and the other eight scored badly.
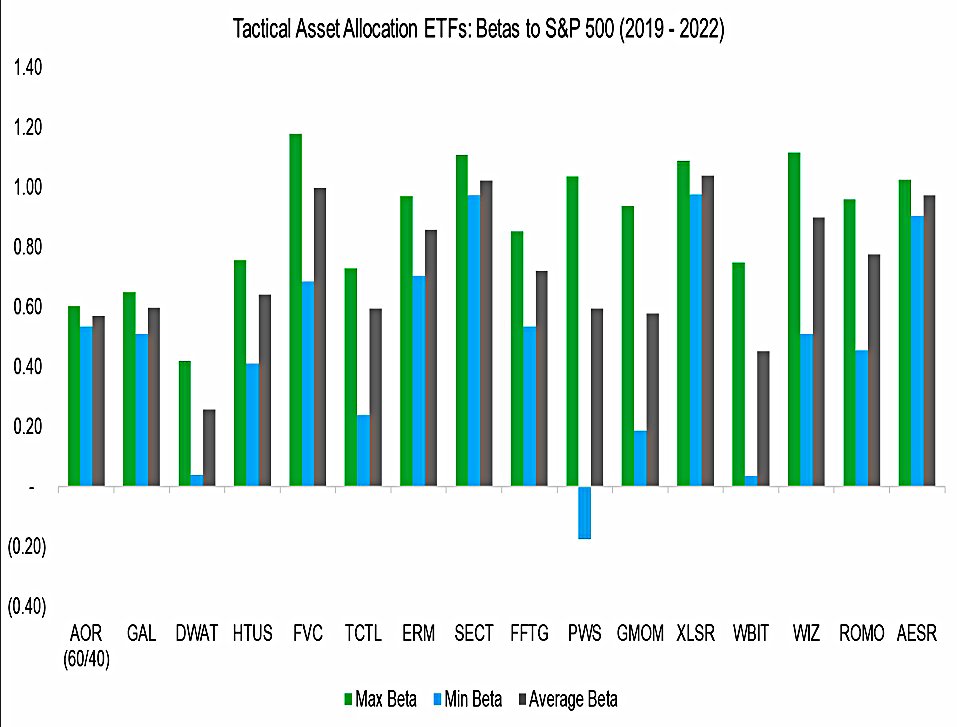
Next up was the beta to the S&P 500.
- A low and/or variable beta is good here.
The funds with consistently high betas (eg. GAL) should be seen as strategic allocations (“lazy portfolios”) rather than as TAA.
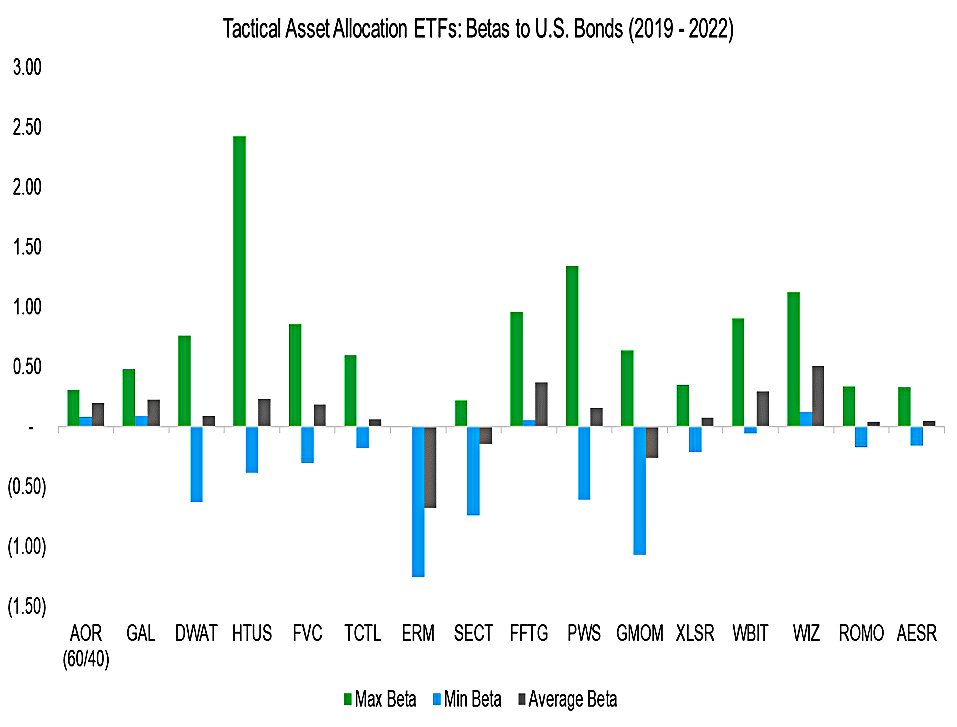
The betas to US bonds were a lot better.
Finally, we calculate the difference between the maximum and minimum betas to stocks and bonds. If the difference was lower than that of the 60/40 portfolio, then the ETF is not active enough and should be considered a strategic rather than a tactical asset allocation product.
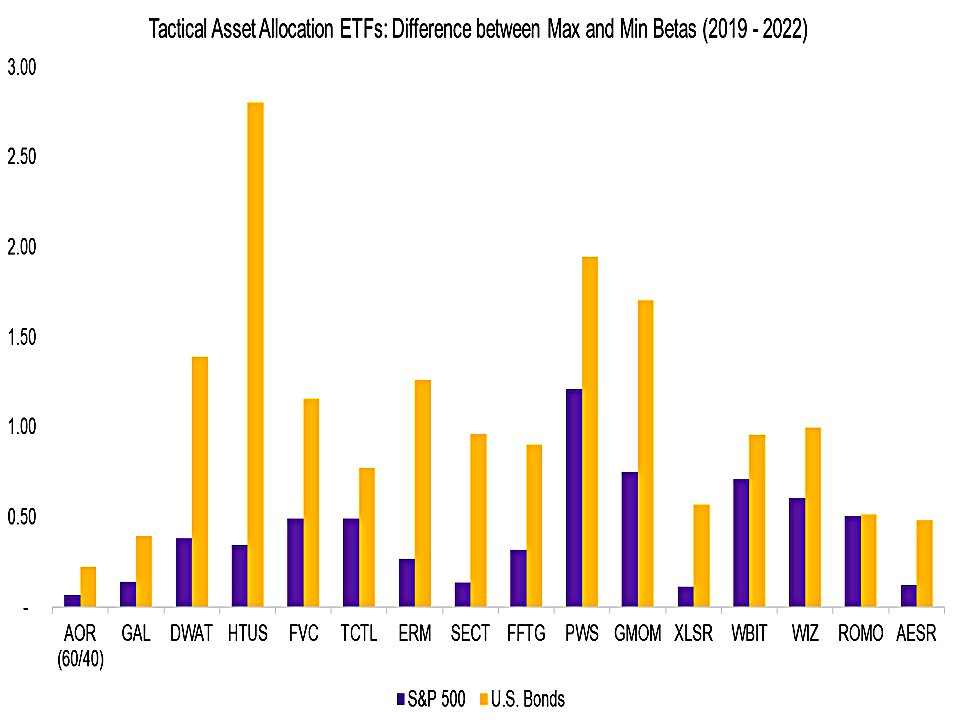
According to this analysis, Nicolas would classify all except GAL (a GLobal Asset Allocation lazy portfolio) as TAA ETFs.
TAA ETF performance
The second note was called ” Revisiting the Performance of TAA ETFs”.
- Nicolas finds the recent declines in stock and bond markets to have been challenging for TAA ETFs, and so their recent track record has been poor.
This is in contrast to the 2008 crisis:
No strategy works all the time. The global financial crisis was great for tactical asset allocation strategies as it featured a slowly evolving bear market. By the time stock markets crashed seriously in 2008, many of these strategies were allocated out of equities and into bonds.
But the following decade featured rapid crashes and recoveries driven by central bank action.
- Slow-moving TAA strategies often sold and the bottom and reentered too slowly to catch the recovery.
Since 2022 featured slower declines than recent years, Nicolas wanted to examine whether this would lead to the rehabilitation of TAA ETFs.
RORO
The most popular tactical asset allocation strategy is using the 200-day average on
an equity index. If stocks are up, allocate 100% to U.S. stocks, if negative, allocate 100% to bonds. It is a simple risk-on risk-off model.
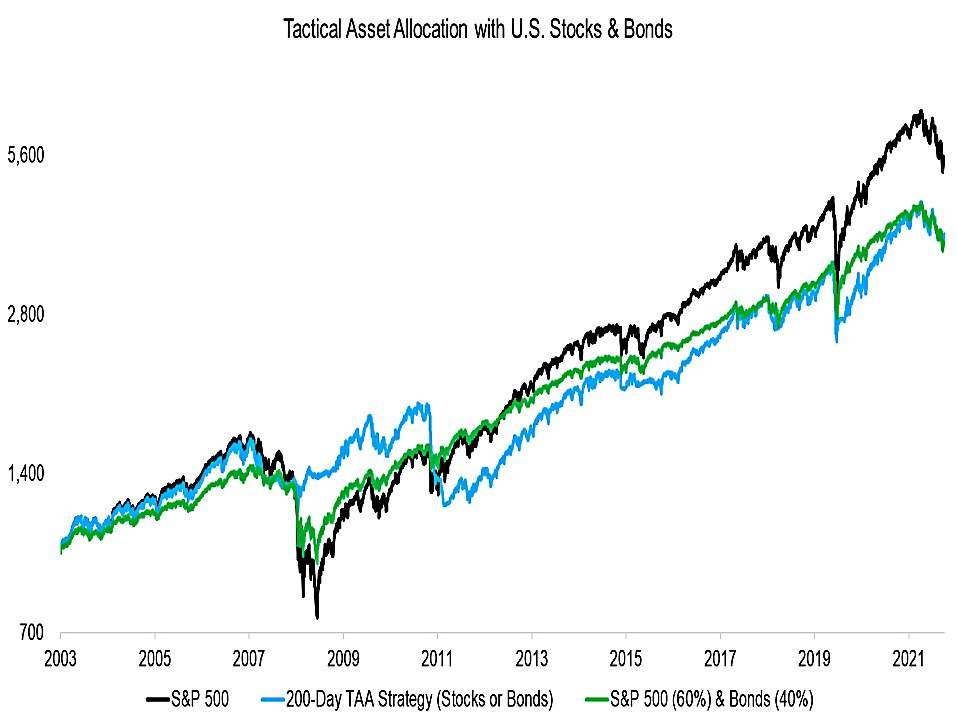
Nicolas plots this strategy against the S&P 500 and a 60-40 portfolio.
The TAA strategy preserved capital during the global financial crisis in 2008 and 2009, but did not perform well during minor stock market crashes like in 2011 and the COVID-19 crisis in 2020.
Buy and hold does best (from 2003 to 2022) but with more volatility.
- TAA and 60-40 show similar returns, but with varying responses to crises.
TAA ETFs Part 2
For the second note, Nicolas looks at TAA ETFs with a five-year track record.
- This reduces the universe to eight funds.
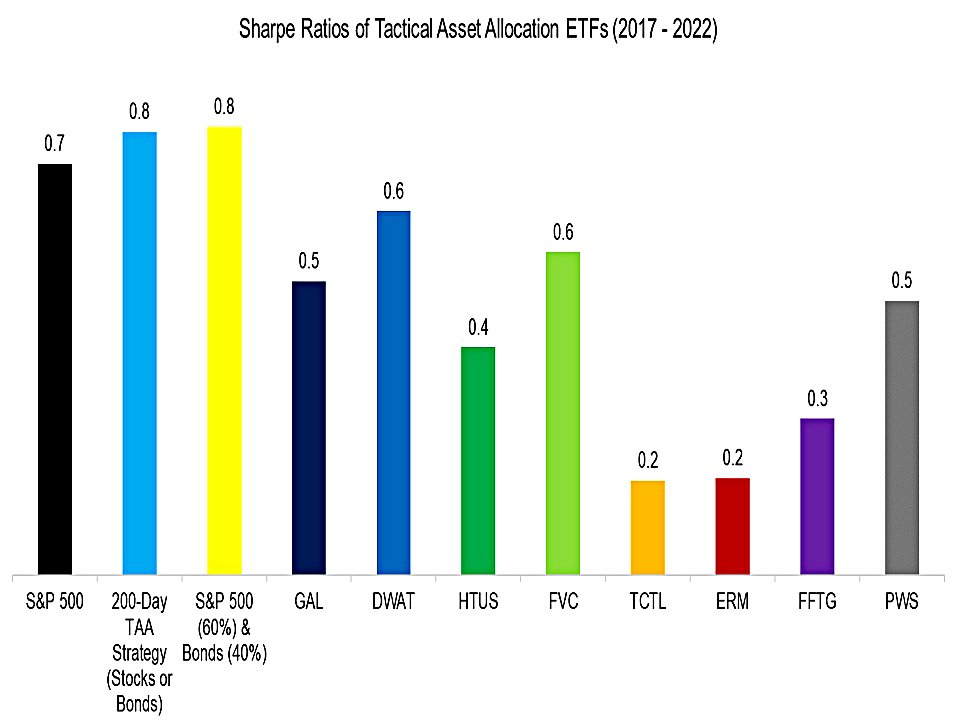
Calculating the Sharpe ratios for the TAA ETFs for the period between 2017 and 2022 highlights that these were lower than those of the S&P 500, the simple TAA strategy using the 200-day average, or the 60/40 portfolio.
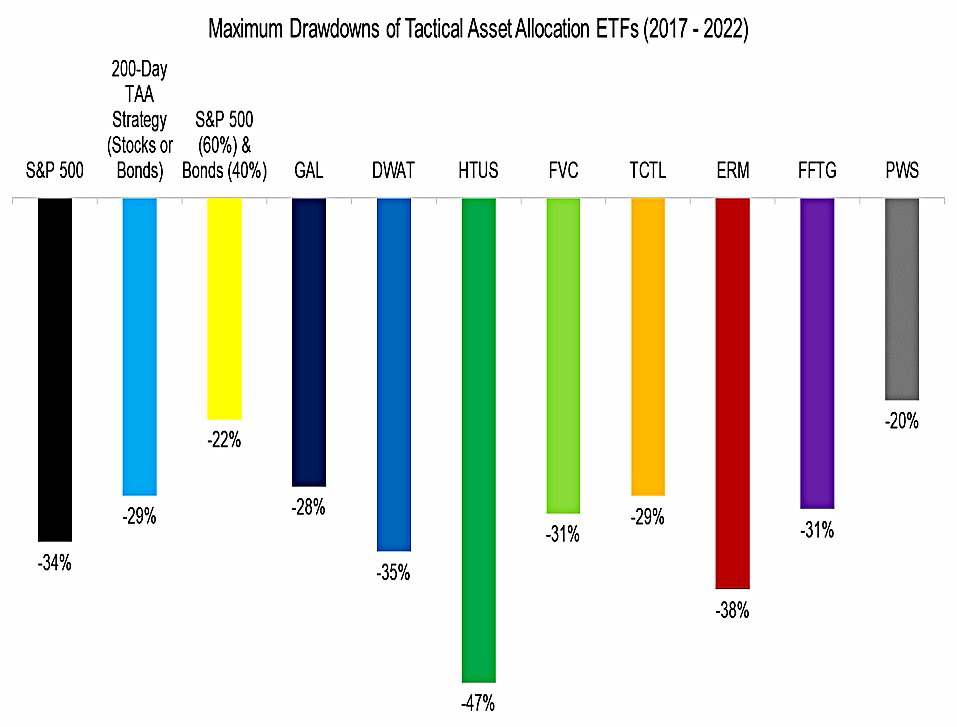
Some TAA ETFs had larger drawdowns than that of the S&P 500 (-34%), and most were worse than that of a 60/40 portfolio, which is surprising.
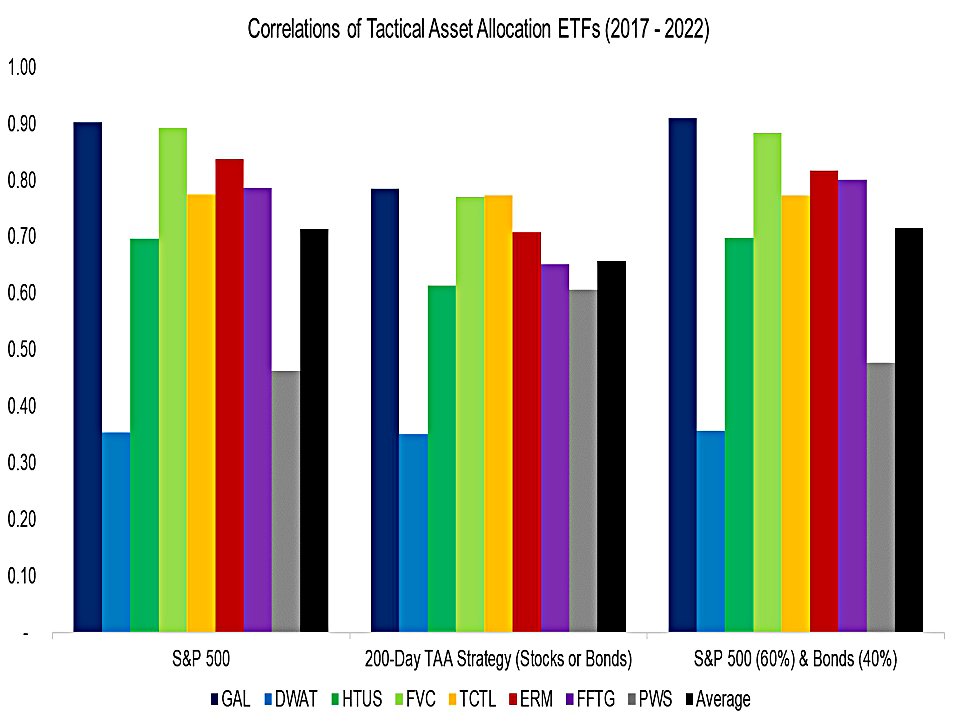
There’s better news from correlations, which average only 0.66.
These ETFs are doing something different than simply using the 200-day average . This may include more asset classes and indices, different or multiple lookback windows, scaling techniques, and so on.
The correlations to the S&P 500 are quite high, so Nicolas recommends that the TAA strategies are used to replace rather than complement an equity allocation.
- That means they are equity alts rather than true alts.
Nicolas is surprised that ETFs with varying strategies have such high correlations to the 200-day MA strategy.
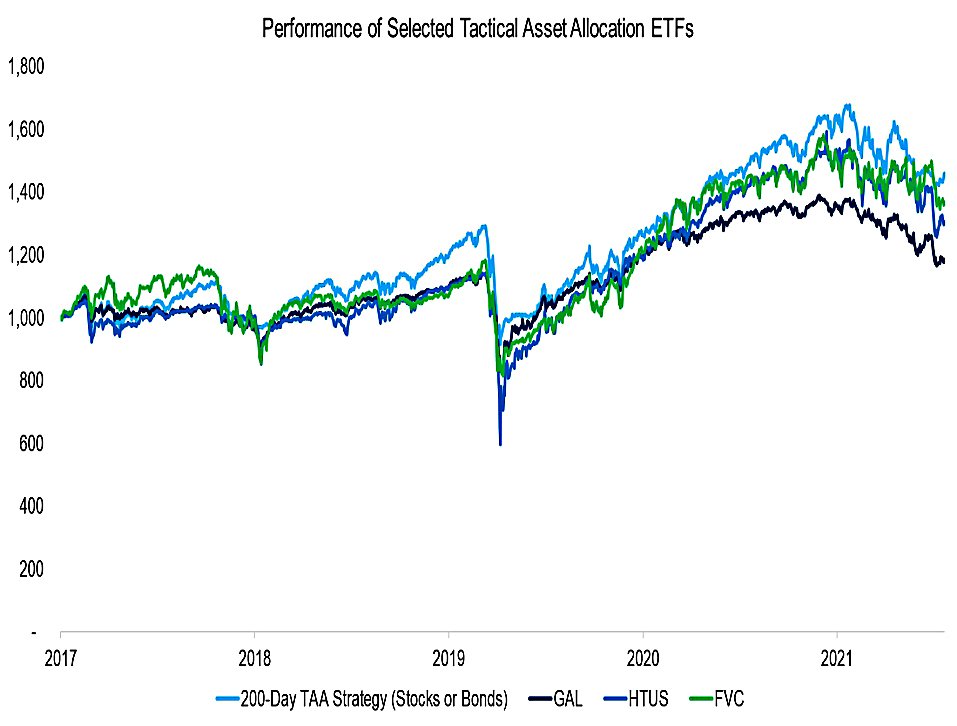
GAL pursues a global asset allocation that is less tactical than HTUS, which uses leveraged and short positions, or FVC, which employs a momentum-based sector rotation that can go into cash.
The TAA ETFs have not performed well recently, but conditions have been difficult:
Switching from equities to bonds when stock markets decline has not worked out well in 2022. Bonds have also lost value given rising interest rates, even short-term U.S. Treasuries.
Holding ultra short-term government bonds might lower the loss , but given that inflation is close to 10% in most developed markets, this implies
a significant loss in real terms.
Explaining underperformance
The third note is called ” Tactical ETFs: Tactfully No, Thank You?”
- It tries to explain why different types of TAAs have failed to provide either better risk-adjusted returns and/or reduced drawdowns in recent years.
Every investor is a tactician, whether they actively try or not. Even long-term buy-and-hold investors are tactically allocating capital when they decide on an asset allocation mix, portfolio rebalancing dates, investment products, capital deployment plans, etc. No one simply holds the market portfolio.
At the time of the third note, Nicolas’ universe of US TAA ETFs comprises 14 funds.
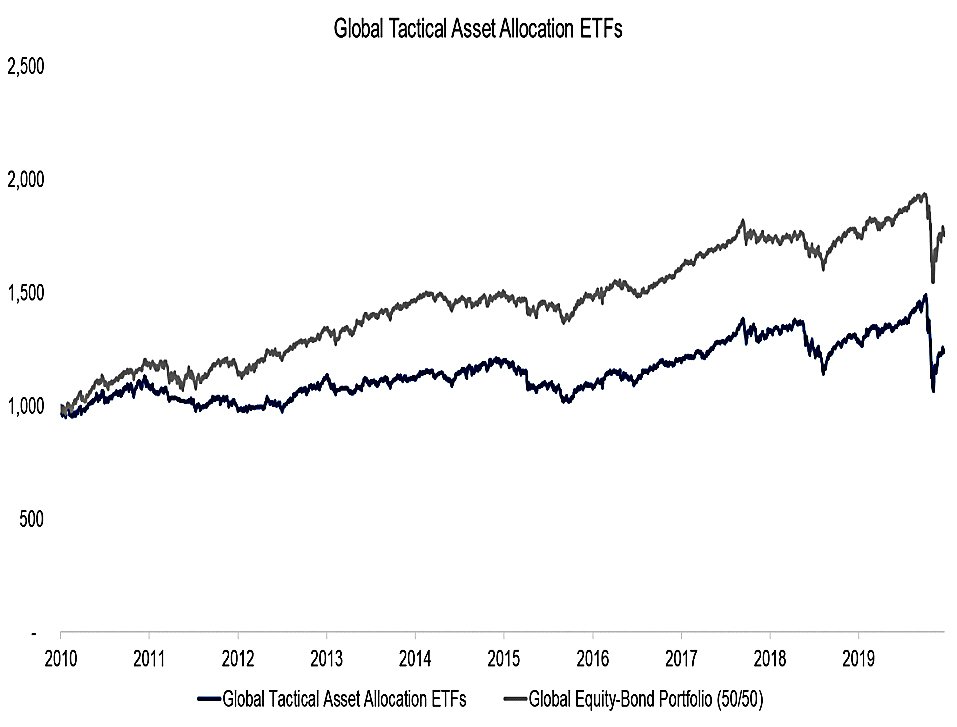
- His chosen benchmark this time is 50% stocks and 50% bonds.
The TAA funds underperform from 2009 to 2020.
- This can partly be explained by fees, which average 0.87% pa.
Global complexity
Another candidate is the complexity of global investing:
Discretionary or systematic approaches to tactical investing that work in the US might be less effective in emerging or international markets, which have idiosyncratic features.
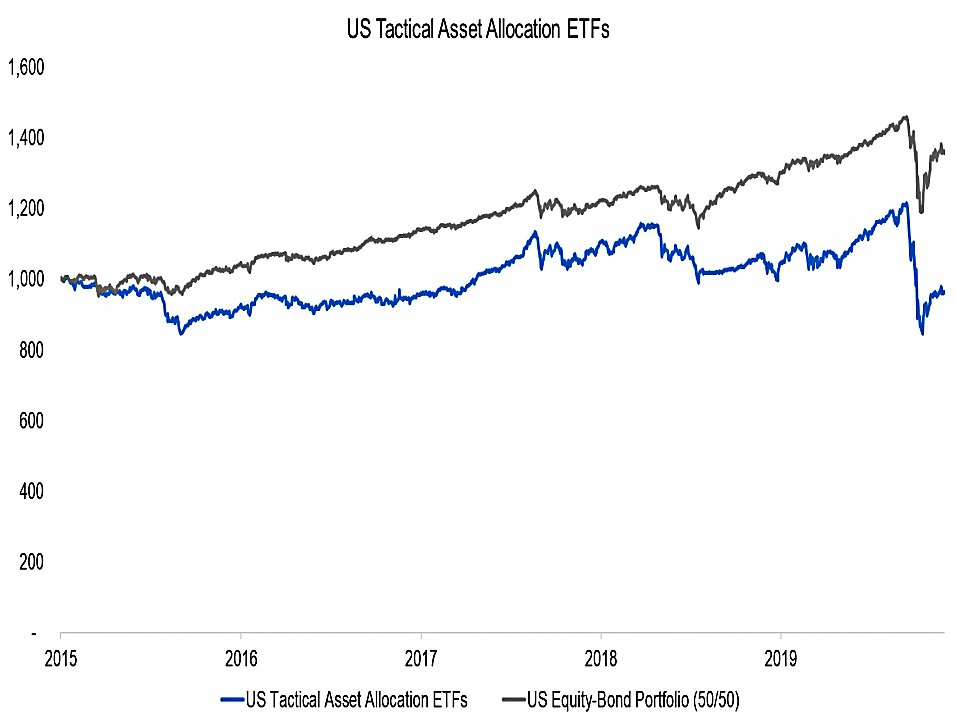
To test this, Nicolas looks at the ETFs which restrict themselves to the US market.
- They still underperform a US version of the 50-50 portfolio.
Tactical S&P 500
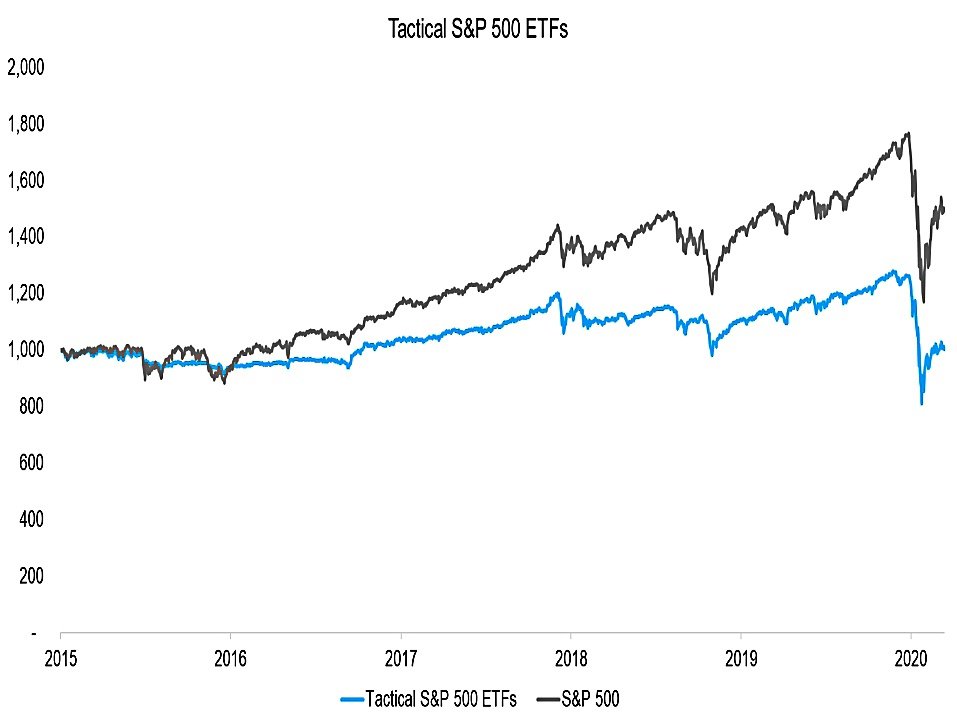
The third analysis (from the third note) was to just look at the S&P 500 ETFs, this time comparing the, to the plain S&P 500 return.
- Once again, the TAA ETFs underperformed.
Reducing risk
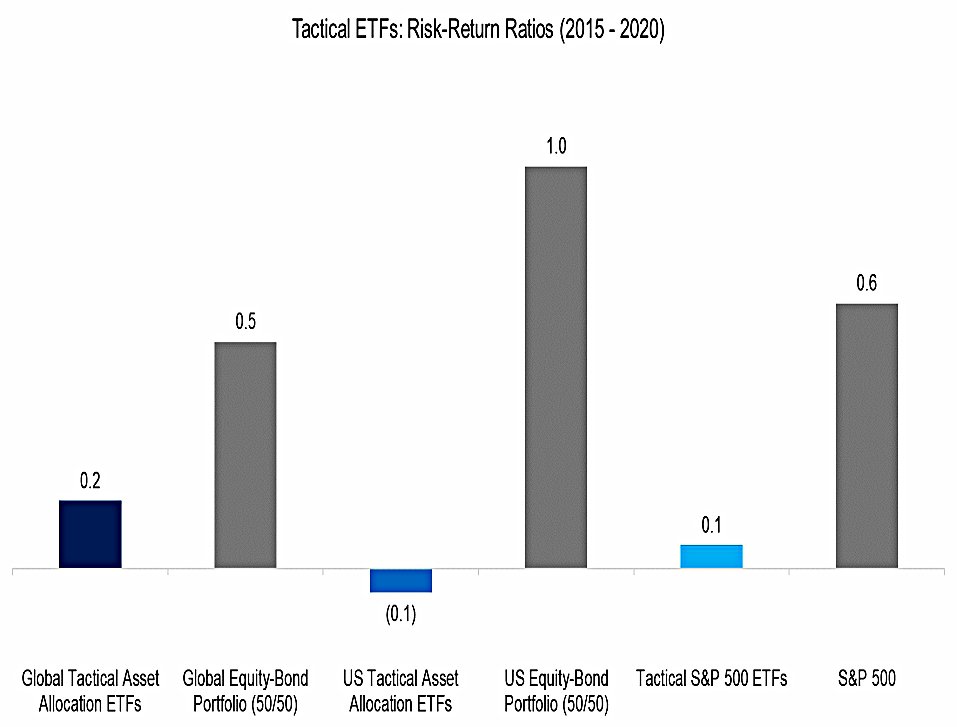
Looking at risk-return ratios (Sharpe) doesn’t improve things for the TAA ETFs.
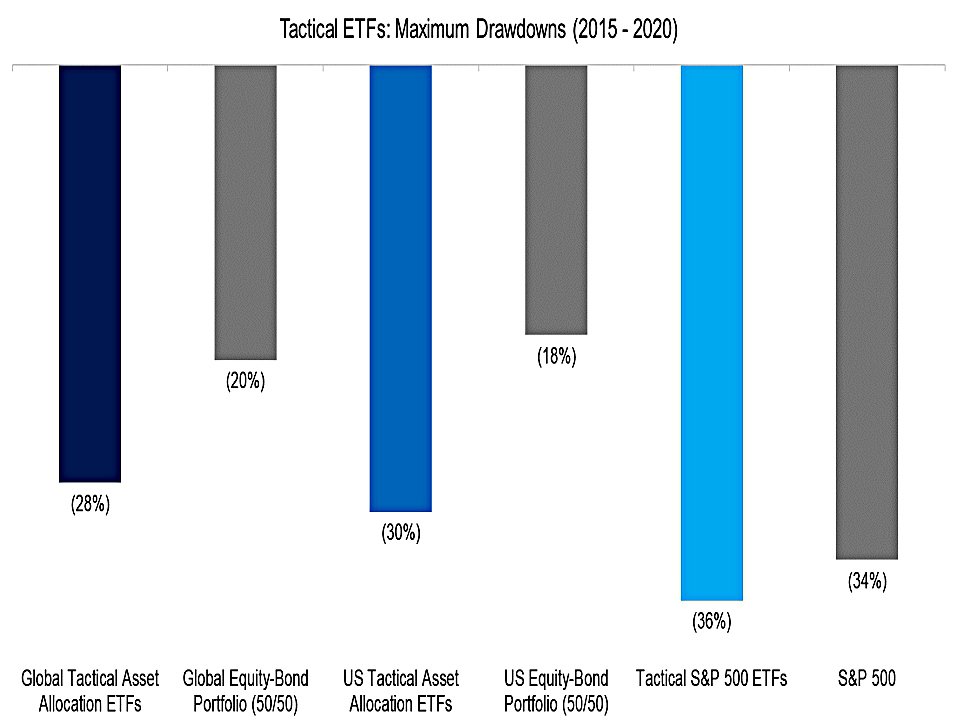
And the max drawdowns of the TAA ETFs (during Covid) were worse than their benchmarks.
This crisis was unusual considering the speed of the market crash and government intervention, which perhaps did not provide the optimal conditions of tactical ETFs to shine. However, market crashes are always unusual.
Conclusions
I’m grateful to Nicolas for introducing me to a much larger universe of (US) TAA ETFs than I was previously aware of.
- However, it’s clear that they have not done well in recent years.
The issue of “the wrong kind of crisis” has come up before, in the context of trend following, which can also provide crisis alpha and decent long-term returns.
- The conclusion then was to run more than one speed of trend-following, so that a least a portion of capital would benefit.
It looks as though the ETFs currently available don’t provide such diversity.
- This means that users of these ETFs must hope that the next crisis plays out at a different speed – the Goldilocks tempo.
Until next time.
Mike Rawson
Mike is the owner of 7 Circles, and a private investor living in London. He has been managing his own money for 40 years, with some success.