Leverage for the Long Run

Today’s post is about a second paper from Michael Gayed on using Leverage for the Long Run.
Leverage for the Long Run

In this paper (which dates to 2016, and won a Charles Dow award), Michael argues that the key to using leverage in order to magnify performance is knowing when to reduce risk.
- He finds that low volatility environments respond best to leverage and that moving averages can be used to identify such environments.
The Leveraged Rotation Strategy (LRS) from the paper shows better absolute and risk-adjusted returns than buy and hold in the S&P 500, and also outperforms a constant leverage strategy.
- LRS works across different amounts of leverage, different MA periods, and multiple economic and financial market cycles.
The LRS can be compared to card-counting in blackjack – it uses leverage only under the volatility regimes where its use is more likely to be beneficial.
Why?
Michael puts forward a structural and behavioural explanation for why LRS works:
Certain institutional investors such as pension plans, mutual funds, and endowments are simply unable to borrow money to invest beyond their portfolio’s asset value based on stated mandates and regulatory requirements.
And for those institutions that can use leverage, there are extra costs and risks compared to not using it which lead to conservatism.
- Behavioural factors include the availability heuristic which associates leverage with historic major crashes leading to aversion.
Earlier studies on low beta and risk parity suggest that leverage is effective when most investors are unable or unwilling to use it.
Volatility and path
To keep things practical, Michael looks at leverage levels of 1.25X, 2X and 3X, which match up to popular daily-leveraged ETFs on the S&P 500.
One of the mistaken notions about daily re-leveraging is the idea that there is some form of natural decay. This is the belief that over time the cumulative returns from such rebalancing will end up moving towards zero or at the very least be considerably less than a constant buy and hold strategy. Going back to 1928, we find this is simply not the case.
![]()
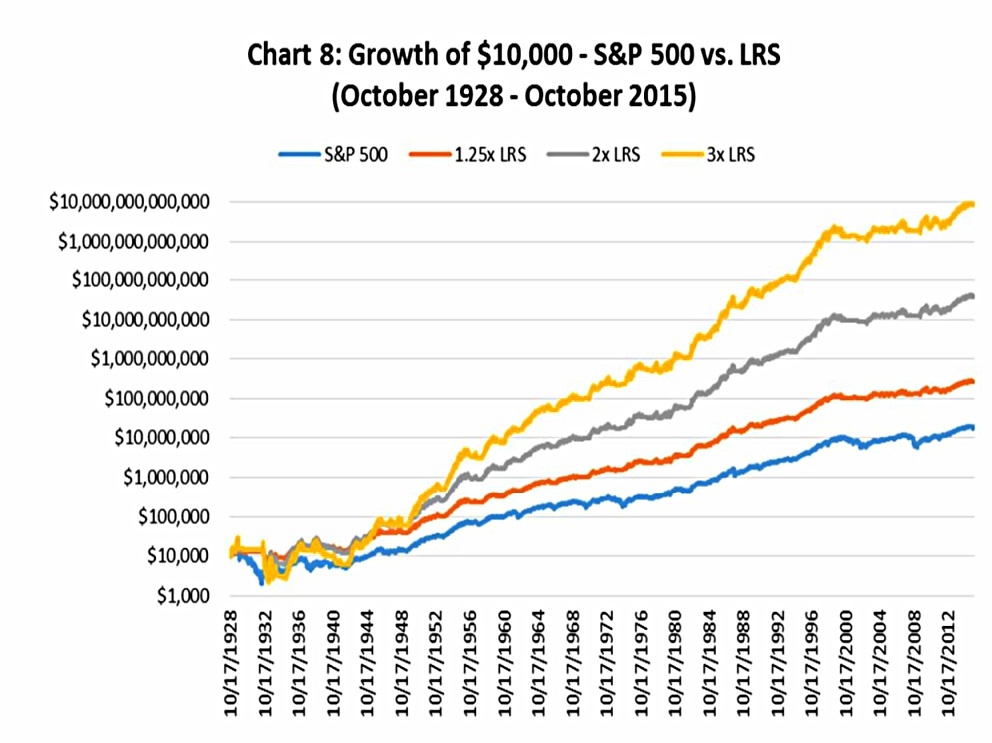
In fact, the 3X fund would have returned 290 times the S&P over that period!
The real problem is volatility:
When the path of returns is not trending but alternating back and forth between positive and negative returns (seesawing action), the act of re-leveraging is mathematically destructive. The reason: you are increasing exposure (leveraging from a higher level) after a gain and decreasing exposure (leveraging from a lower level) after a loss, again and again.
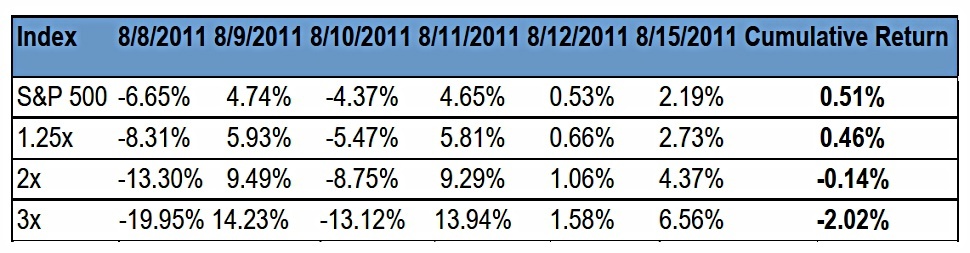
The next chart provides more detail on this:
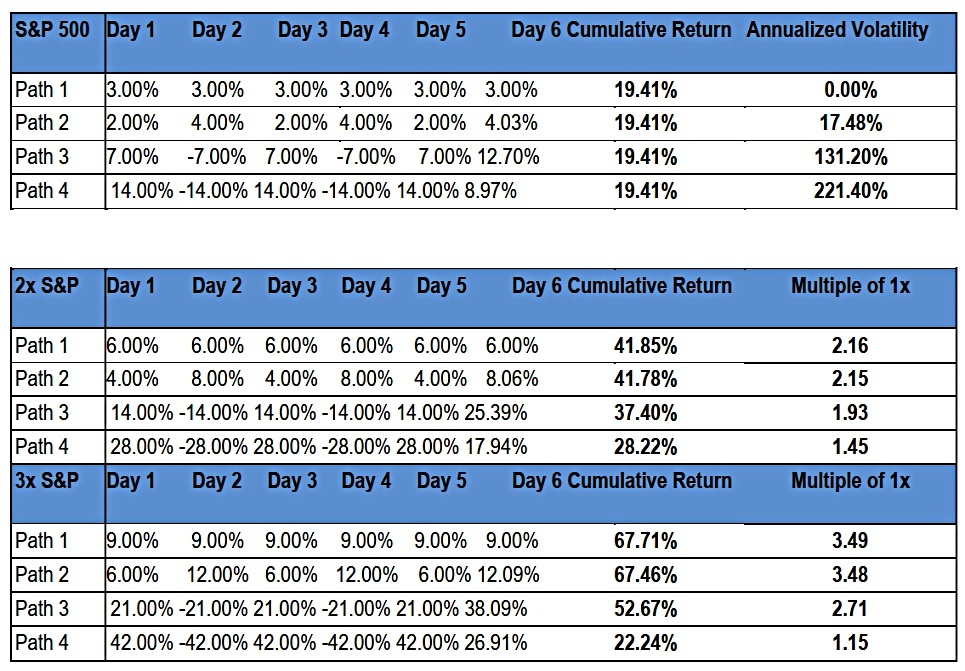
In both Path 1 and Path 2, the S&P 500 is positive for six consecutive days, but the lower volatility Path 1 achieves a higher return. Both Path 1 and Path 2 perform better than the leverage multiplier as the constant re-leveraging benefits from compounding.
The opposite is true in Path 3 and Path 4, which have alternating positive and negative returns during the first five days. These paths fall directly into the constant leverage trap and the highest volatility Path 4 is hurt the most when leverage is applied.
Michael also links volatility and “streakiness”:
High volatility environments tend to be characterized by investor overreaction which is more prone to back-and-forth market movement. In contrast, low volatility environments are more consistent with investor underreaction which in turn results in more streaks or consecutive up days.
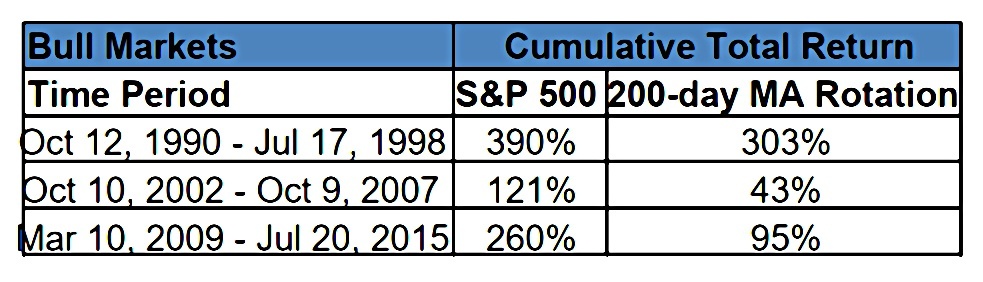
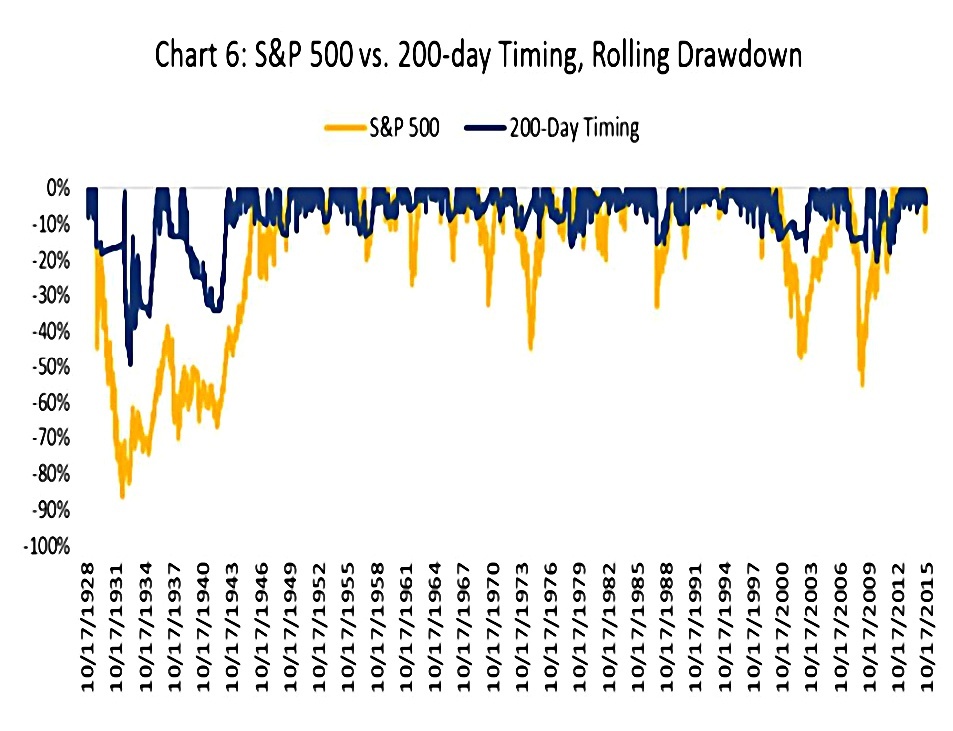
Trend protection
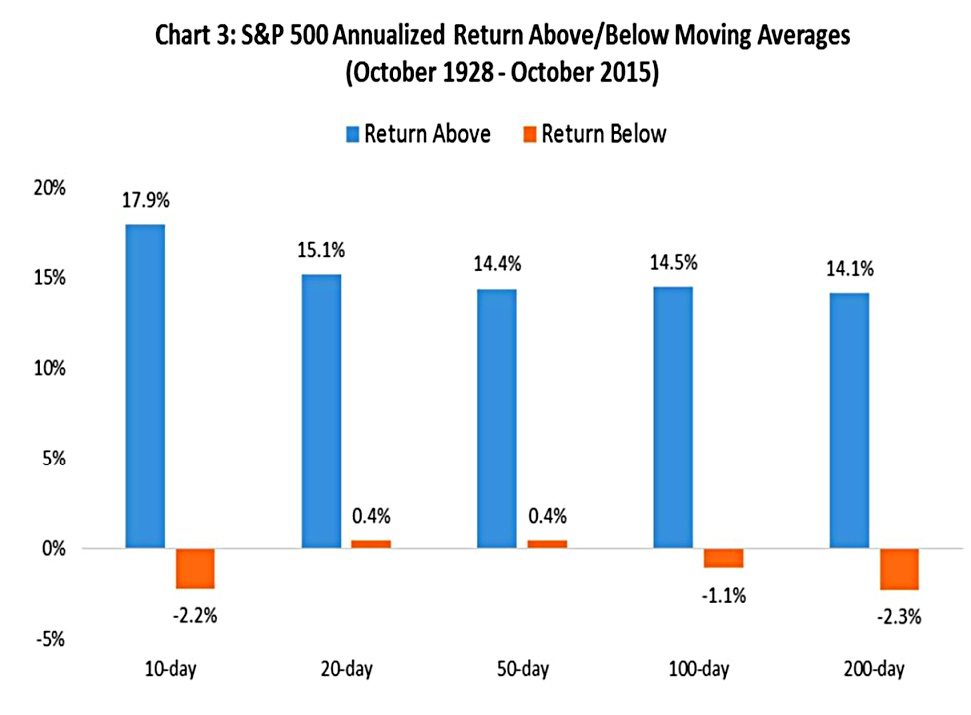
Michael notes that following the 200-day MA underperforms Buy and Hold during bull markets:
But in bear markets, it outperforms: (( Apologies for the broken table formatting ))
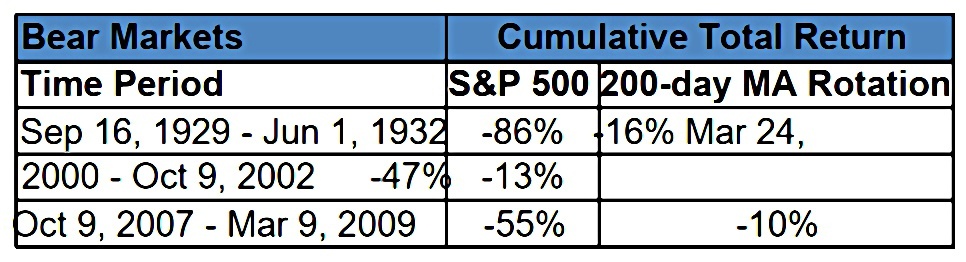
The Moving Average is more about downside protection than upside participation.
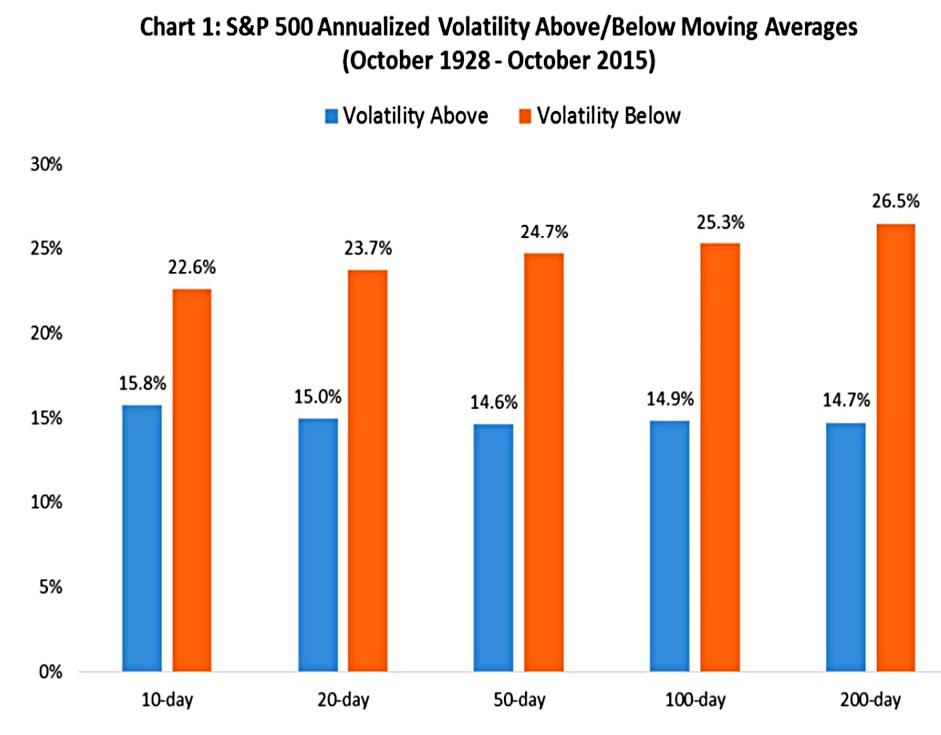
Volatility is much higher when prices are below the moving average:
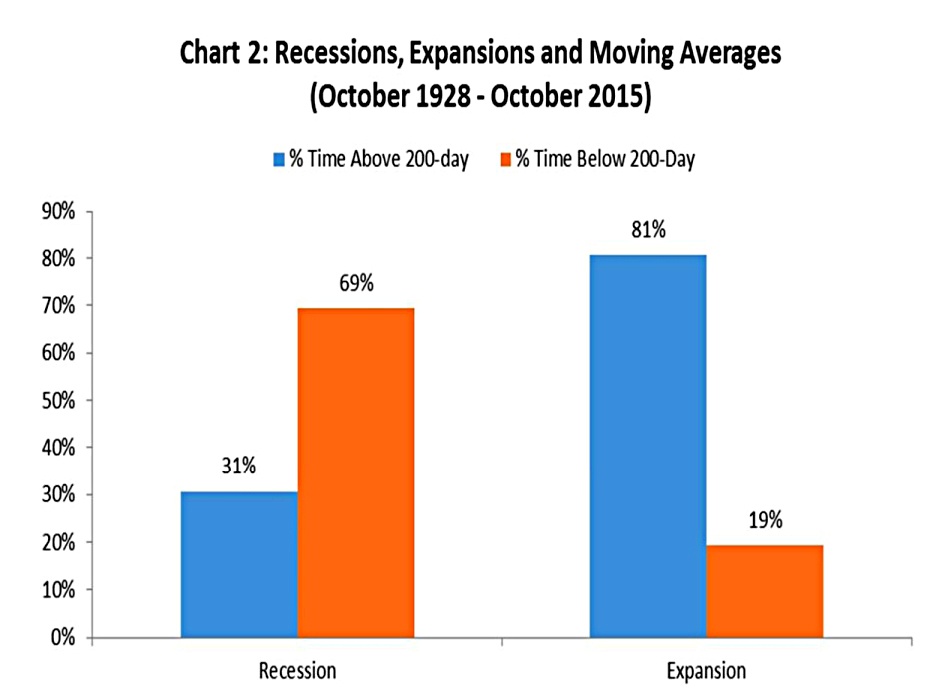
Since 1928, the U.S. has experienced 14 recessions, spending approximately 19% of the time in contraction. During these recessionary periods, the S&P 500 has traded below its 200-day Moving Average 69% of the time versus only 19% of the time during expansions. Meanwhile, during expansionary periods the S&P 500 has traded above its 200-day Moving Average 81% of the time versus only 31% of the time in recession.
Michael proposes that uncertainty in future expectations during recessions leads to investor overreaction and increased volatility.
- And of course, higher volatility is bad for stock returns.
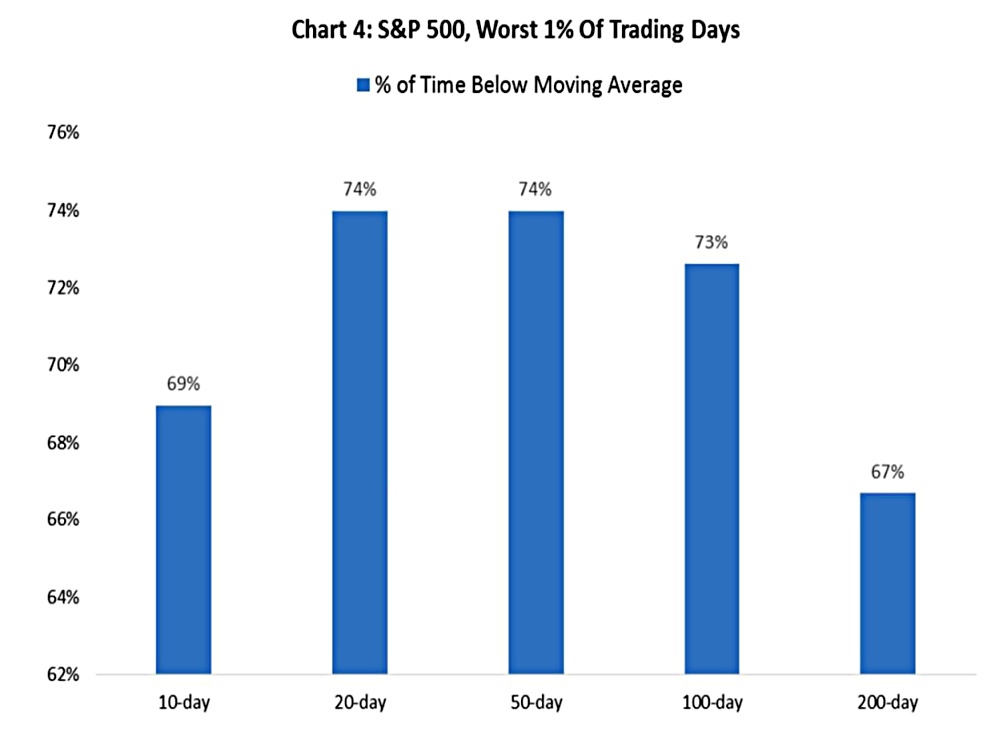
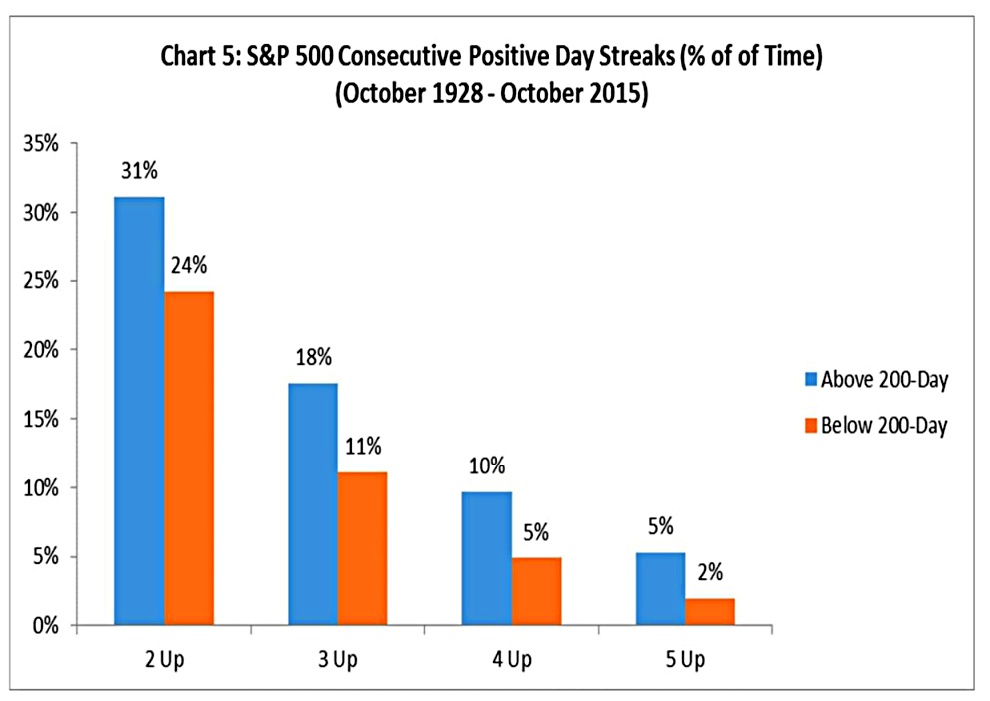
Michael notes that the worst 1% of trading days tend to occur when already below the MA:
Whereas streaks of up days tend to occur above the MA:
The LRS
Michael starts by comparing buy and hold with MA rotation without leverage:
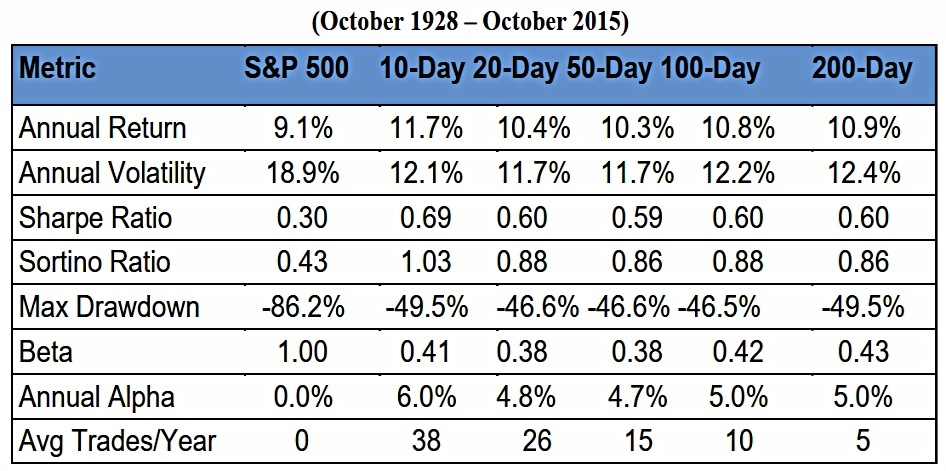
The Moving Average rule beats buy-and-hold in absolute performance in only 49% of rolling 3-year periods. The true value here is in terms of risk-adjusted outperformance, where the Moving Average rule generates positive alpha in 69% of rolling 3-year periods.
The problem with buy and hold is of course that almost nobody holds through big drawdowns (though you will meet a lot of people who tell you that they do).
- The 200-MA significantly truncates drawdowns, making you more likely to stick with your strategy.
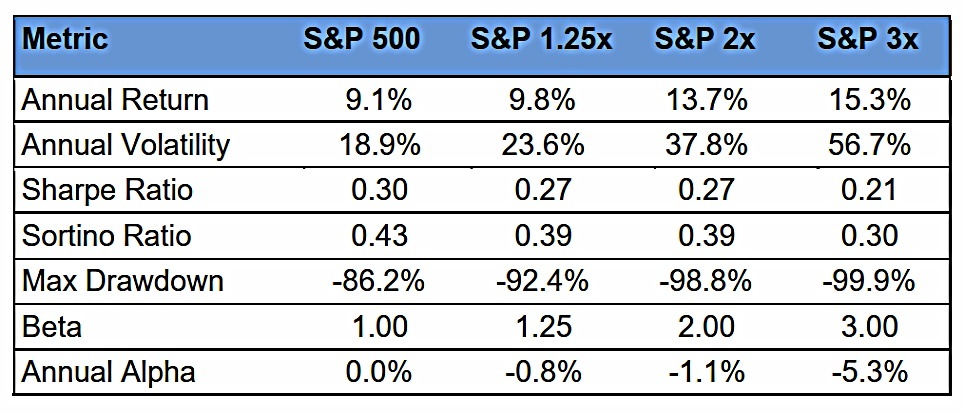
Adding leverage lead to significant outperformance, along with much higher volatility.
- Risk-adjusted performance is lower and drawdowns are larger.
But the LRS fixes this.
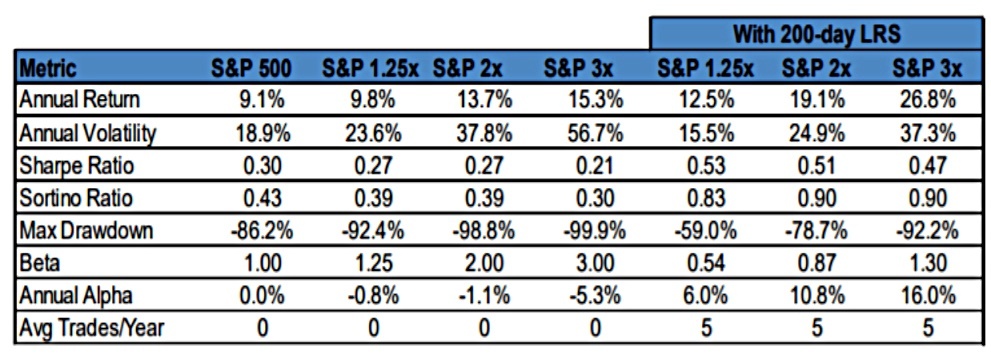
Michael focuses on the 200-MA, since this leads to an average of five rotations per year, keeping transaction costs low.
The LRS achieves: 1) improved absolute returns, 2) lower annualized volatility, 3) improved risk-adjusted returns (higher Sharpe/Sortino), 4) lower maximum drawdowns, 5) reduced Beta, and 6) significant positive alpha.
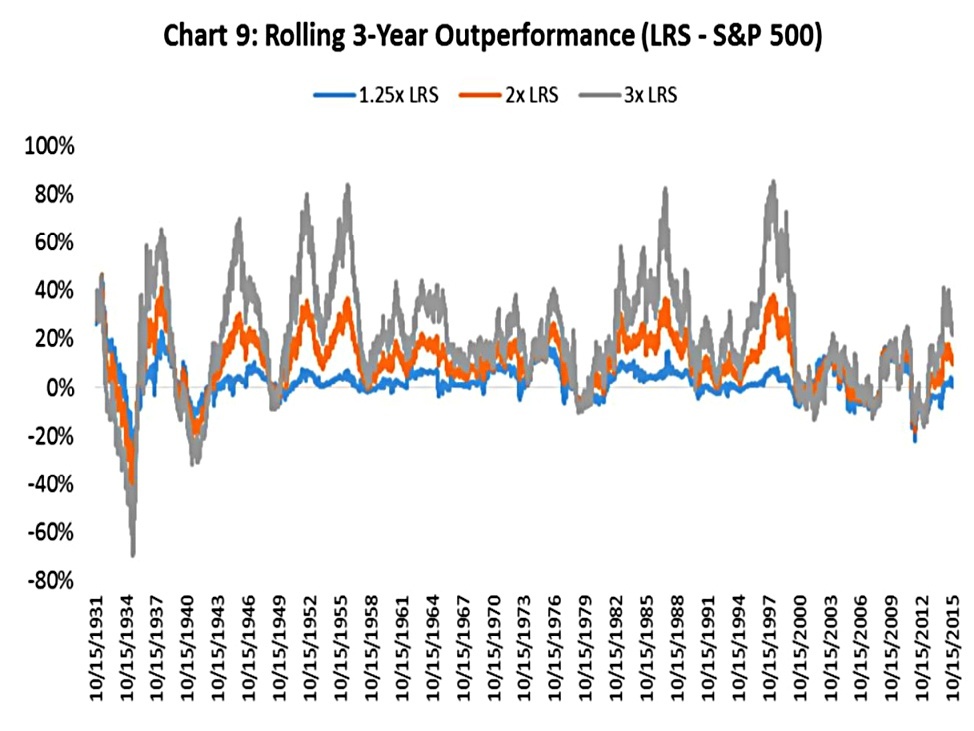
The LRS also outperforms in 80% of rolling three-year periods.
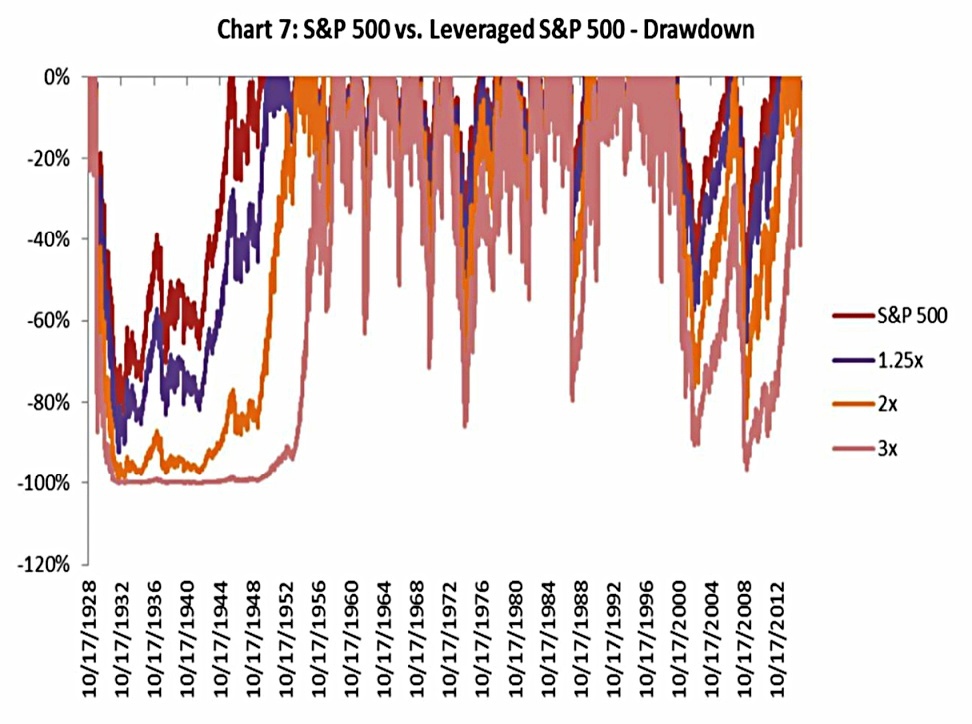
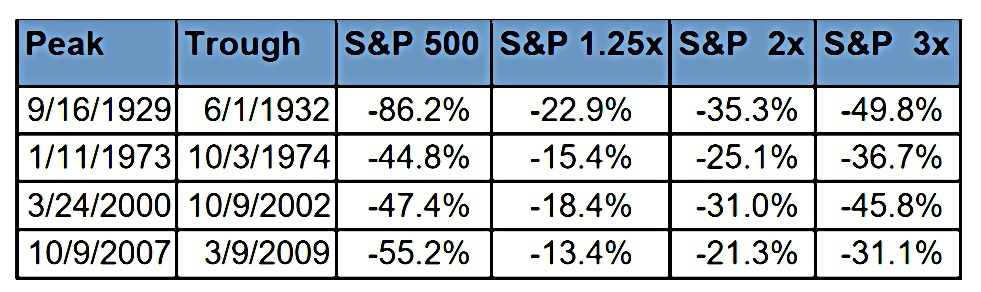
During the four worst bear markets in U.S. history, all of the Leverage Rotation
Strategies have a lower maximum drawdowns than an unleveraged buy and hold of the S&P 500.
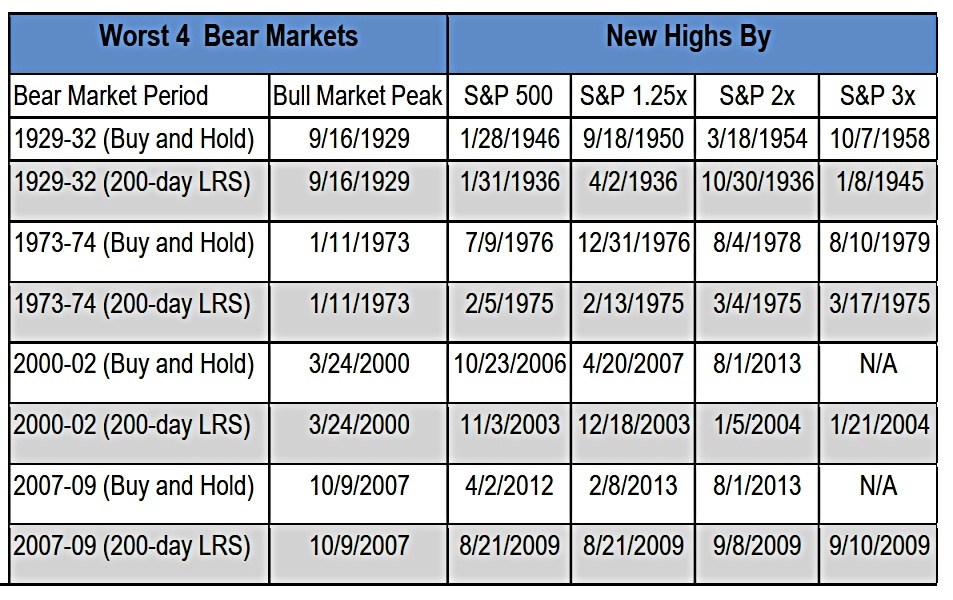
If we look at the worst Bear Markets in history, the LRS reaches new highs ahead of buy and hold in every example, from 1.25x through 3x.
That’s it for today.
- I really like this strategy, which is easy to implement and should complement a core buy-and-hold portfolio.
I’ll be trying it out at the earliest opportunity.
- Until next time.
Mike Rawson
Mike is the owner of 7 Circles, and a private investor living in London. He has been managing his own money for 40 years, with some success.


Hi Mike,
Were you able to test out the LRS?
I’m afraid not. Partly down to cash flow problems (a lack of cooperation from a couple of pension companies, HMRC and the probate office) but more importantly, the rising interest rate environment.
I’m parking experimentation until the rate cycle peaks, so perhaps in 2024?